

Abstract
Motivation: The development of new high-throughput genotyping products requires a significant investment in testing and training samples to evaluate and optimize the product before it can be used reliably on new samples. One reason for this is current methods for automated calling of genotypes are based on clustering approaches which require a large number of samples to be analyzed simultaneously, or an extensive training dataset to seed clusters. In systems where inbred samples are of primary interest, current clustering approaches perform poorly due to the inability to clearly identify a heterozygote cluster.
Results: As part of the development of two custom single nucleotide polymorphism genotyping products for Oryza sativa (domestic rice), we have developed a new genotype calling algorithm called ‘ALCHEMY’ based on statistical modeling of the raw intensity data rather than modelless clustering. A novel feature of the model is the ability to estimate and incorporate inbreeding information on a per sample basis allowing accurate genotyping of both inbred and heterozygous samples even when analyzed simultaneously. Since clustering is not used explicitly, ALCHEMY performs well on small sample sizes with accuracy exceeding 99% with as few as 18 samples.
Availability: ALCHEMY is available for both commercial and academic use free of charge and distributed under the GNU General Public License at http://alchemy.sourceforge.net/
Contact: mhw6@cornell.edu
Supplementary information: Supplementary data are available at Bioinformatics online.
1 INTRODUCTION
The number of single nucleotide polymorphisms (SNPs) that can be genotyped in a single experiment has increased exponentially in the past 5 years, with costs per data point declining at the same time (Kim and Misra, 2007; Maresso and Broeckel, 2008). This technological advance has been critical to the design and execution of cost-effective genome wide association studies (GWAS) in humans and other well-studied systems (Hirschhorn and Daly, 2005; McCarthy et al., 2008). While most ‘catalog products’ offered by companies such as Illumina and Affymetrix are developed for human genotyping, the underlying technologies of the assays themselves and the manufacturing methods which produce such high-density products should be transferable to most diploid systems of interest and are currently being adapted for domesticated plants and animals.
The development of a custom genotyping product is still an expensive process, especially if re-sequencing for SNP discovery must be performed. Even with a sufficient SNP database on hand, the development of a working assay may require dozens or even hundreds of samples to be run in order to identify which array features are working reliably and which simply do not perform well in the multiplexed environment. Human genotyping products from Affymetrix and Illumina, now in their fifth generation or later, are largely free of SNPs and probes which did not ‘convert’ to working assays, as previous generation products have identified these SNPs empirically and they have been removed from later generation products. However, a first generation custom product may see up to 50% of the intended SNP assays fail to generate accurate results, and this may only be determined after 100 or more samples have been run. Depending on the number of samples planned for the entire experiment, the cost of the samples needed for development and quality control procedures for custom genotyping products may easily form a significant fraction of the total experiment cost.
One limitation in custom genotyping array development is the requirement of many automated genotype calling algorithms such as Affymetrix's ‘BRLMM-P’ to have a large number of samples from which three distinct clusters of genotypes (AA, AB, BB) can be reliably identified and clearly distinguished (Affymetrix Inc., 2006; Carvalho et al., 2007; Rabbee and Speed, 2006; Teo et al., 2007). The methodology in many of these clustering algorithms implicitly assumes the existence of all three clusters. Other published methods attempt to statistically test whether or not two or three clusters best describes the data (Liu et al., 2003). Some more recent methods such as ‘Birdseed’ (Korn et al., 2008) require 100 or more samples with known genotypes to be assayed in advance to ‘train’ the algorithm. The BRLMM-P algorithm can accept training samples as ‘priors’ or can be run without priors for de novo calling. For well-funded studies such as the Human HapMap (The International HapMap Consortium, 2005, 2007), it is possible to obtain this prior information and then apply it to future samples. In smaller projects, however, obtaining verification data for this many samples may be prohibitive.
Another aspect of high-throughput SNP genotyping assay design is the laboratory protocols used to prepare samples prior to the actual genotyping step performed by the manufacturer's system. The Affymetrix Human genotyping products have long employed a genome-reduction step where the genome is enzymatically digested and the digestion products are ligated with universal adapters followed by PCR amplification of small (<2 kb) fragments. In principle, this method is generalizable to other genomes but may require optimization of the restriction enzymes used and fragment sizes amplified. An alternative, especially for systems with smaller and less complex genomes, is to skip the complexity reduction step and directly label a randomly digested genome or amplify with random labeled primers. These options, and others, can only truly be assessed by running some samples and assessing the genotype call rates and accuracies. However, if the calling method is inaccurate with <100 samples or requires priors from known genotype samples, experimenting with and optimizing the sample preparation and labeling step is simply too costly. For new and custom products, it is desirable to have a genotype calling method which does not require prior information or training samples and can produce accurate results with only a few samples.
Another consideration not addressed by genotype calling algorithms designed for human applications is the possibility that the samples genotyped may be inbred or deficient in heterozygote genotypes. Many animal model systems have developed panels of inbred lines or strains that are widely used in genetic experiments (Yang et al., 2009). Likewise, in plant systems, many research systems and many agronomically important species have large collections of inbred lines which form the basis of breeding programs and large quantitative genetic studies (Buckler et al., 2009; Yu et al., 2008). Typically, these large collections of inbred lines are genetically and phenotypically diverse and thought to capture a large proportion of the naturally occurring variation in these species.
Genotyping these inbred panels presents a possible problem for automated genotype calling based on cluster analysis because the heterozygote cluster, which is always expected for a population in Hardy–Weinberg equilibrium (HWE) if the SNP is segregating within the sample batch, may have very few observations or be completely absent, for nearly all SNPs. In our experience, these deviations from HWE result in very few or no heterozygote samples within the batch and this confuses current software causing one of the homozygous clusters to be declared heterozygous, or one homozygous cluster to be split into heterozygote and homozygote calls. This is related to the problem of requiring large batch sizes since the main problem with analyzing only a few samples at a time is that one or two genotype classes may be completely absent or have too few observations for clustering analysis to reliably identify cluster locations and boundaries.
In the development of two SNP genotyping products for cultivated rice (Oryza sativa), we encountered both problems, particularly that posed by the lack of heterozygosity in our largely inbred sample collection. To address this, we developed a custom genotype calling algorithm called ALCHEMY, specifically designed to perform de novo calling without prior information and to perform reliably on small numbers of samples while still gaining in accuracy and call rates when multiple samples are available for simultaneous analysis.
2 APPROACH
The central idea behind the ALCHEMY algorithm is that the summary raw intensities for each channel (allele) is a mixture distribution composed of a signal component and a noise component. When an allele is present, an intensity value drawn from the ‘signal’ component is observed. If the allele is not present, the intensity value observed is drawn from the ‘noise’ component. Conceptually, under this model, a diploid organism with an AA genotype would have a signal observation on the A channel and a noise observation on the B channel, and likewise but reversed for a BB genotype. The heterozygous genotype AB would produce signal on both channels. The opposite, noise observed on both channels, indicates an assay failure (no call). This may occur for many reasons, but the two most likely reasons are complete lack of the genomic region (deletion) in the sample, or polymorphism within the flanking sequence which causes non-allele-specific interference with primer or probe binding.
As shown in Figure 1, these signal and noise modes are readily identified visually and reasonably well approximated by the fit of a Gaussian mixture distribution. Let μsA and μnA be the means of the signal and noise distributions for the A channel, respectively, and σ2A be their common variance. Let π(AA) be the prior probability of observing an AA genotype. Then, using Bayes rule, the posterior probability of AA, AB, BB or no call (NC) given the observed intensities xA and xB, is
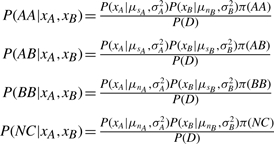 |
(1) |
where the likelihood terms of the form P(xA|μsA, σ2A) is given by the Gaussian density function. P(D) represents the total probability of the data which is calculated by summing the numerators of all four cases above. For the prior terms, let pj be the frequency of the A allele at SNP j in the population, fi be the inbreeding coefficient for sample i, and zj be the probability that an individual sample for SNP j may fail entirely. Let π be specified by the HWE genotype frequencies adjusted for inbreeding and the random possibility of unexplained assay failure:
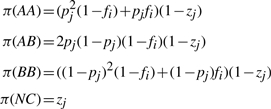 |
(2) |
Fig. 1.

Density plot of log intensities across all A allele probes for one sample (black solid line) and fit of Gaussian mixture distribution (gray dashed line).
We take as the genotype call the genotype with highest posterior probability. This framework not only provides a conceptually simple means to call genotypes derived directly from first principles and easily verified properties of the data, but also provides an easily understood quality metric for each call. In many other methods, quality metrics are available but their scale is not well defined or easily understood. The posterior probability produced by the ALCHEMY model may be taken directly as the (subjective) probability that the call is correct. In practice, a threshold for this probability of correctness is set and all calls which are below this threshold are taken as ‘no calls’. This allows a simple trade-off between completeness of the dataset produced and accuracy.
The signal and noise means, as well as SDs, for each channel, are estimated across samples for each SNP independently. This is performed using the expectation–maximization (EM) algorithm. Likewise, the A allele frequency is initially set to a random value drawn from Beta(7,7)/1.052+0.025 which gives a value of pj in the range of (0.025–0.975) with a mean of 0.5 and most of the mass in the mid-frequency range. This parameter is then updated via EM in tandem with the channel parameters. Similarly, the nuisance parameter zj (probability of an assay failing for a individual at SNP j) is also estimated via EM in tandem with the model parameters and A allele frequency, with initial values being proposed from the Beta(1,20) distribution. Worthy of note is that the prior distribution π is different for each sample due to the dependence on fi. This parameter may be specified by the user for each sample or estimated from the data via EM, as described below.
The above discussion, for purposes of clarity, illustrates the central idea behind ALCHEMY and is an accurate description of the initial implementation of the algorithm. However, a few further observations from the data improve the calls obtained and the accuracy of the posterior probabilities associated with these calls. Namely, it is easily seen that the tails of the two components of the mixture distribution in Figure 1 are heavier than a Gaussian distribution. Thus, the distribution is better modeled as a mixture of Student's t distributions. Secondly, it is readily seen (data not shown) that intensity values on the two channels are correlated, particularly for heterozygotes. Rather than take the product of the two channel likelihoods as given above, which is correct only if the two channels are independent, we model both channels together as a bi-variate t-distribution with the correlation between the intensities on each channel being derived from the ratio of signal and noise mean intensity values as described below. Thus, the numerators in Equation (1) [for P(AA) shown below, other cases omitted] are given by
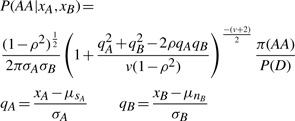 |
(3) |
where xA, xB, μsA, μnB, σA, σB are as defined previously and ρ is the correlation between channels, and v the degrees of freedom of the bi-variate t-distribution. As before, signal and noise means (μsA, μsB, μnA, μnB) and the common SDs (σA, σB) of each channel's signal and noise mixture distribution are estimated from the data, but ρ (for each genotype case) is determined via a simple heuristic and v is a fixed parameter that may be adjusted by the user (see Section 4). Finally, for the Affymetrix and Illumina technologies considered here, the intensity level is typically proportional to the amount of allele present and thus the signal on either channel is reduced for heterozygotes compared with homozygotes. To account for this, we used a reduced value for μsA and μsB in the likelihood for P(AB). These reduced values may be either a fixed proportion of the homozygote signal levels or estimated from the data if a sufficient number of heterozygotes are observed at an SNP.
3 ALGORITHM
Input: the input to ALCHEMY is the summary intensity values for the A allele and B allele channels, for all SNPs interrogated by the assay. Prior to running ALCHEMY, the actual raw data that is platform dependent is converted into these summary intensities. For Affymetrix arrays which have multiple probes per allele per SNP, the log intensity values for each allele are averaged across probes to create a single summary value. For Illumina GoldenGate, intensity values are already summarized as one number for each allele as outputted from BeadStudio. The log of the raw (not normalized) intensity is used.
Normalization: to adjust for variations in signal and noise intensities due to differences in sample DNA concentration and other sample-specific effects, the observed intensities for the A and B allele channels for all SNPs for a sample are pooled and a bimodal Gaussian mixture model is fit to the data to estimate signal and noise means across all SNPs for the sample as well as a common variance. These parameters are determined for all samples and the values tm (target midpoint) and td (target difference) are determined by the average across samples of the respective quantities (μs + μn)/2 and μs − μn. To adjust an individual intensity x, we calculate xnorm = (xorig − (μs + μn)/2)td/(μs − μn) + tm, where μs and μn are the signal and noise means determined from fitting the Gaussian mixture for the sample. This adjustment results in every sample having the same signal and noise means estimated from fitting the bimodal Gaussian mixture model on the normalized intensity values, but the common variance parameter of the mixture model may vary between samples.
EM starting distribution: the normalization procedure results in every sample having a common signal and noise mean when intensity values for all SNPs are fit to a bimodal Gaussian mixture. These common values are used as means for Gaussian proposal distributions to generate starting values to seed the EM procedure. Initially, the average of the common SD for each sample's bimodal fit from the normalization procedure divided by 2.5 is used as the SD of the proposal distributions, but if many proposals fail to result in EM convergence, this variance is increased to allow less typical parameters to be proposed.
EM: for each SNP, random values for the parameters μsA, μnA, μsB, μnB, σ2A, σ2B are drawn from the distribution described in the step above. Values for pj and zj are proposed from their starting distributions as described in the Section 2. Given these values, the probability of each possible genotype call (AA, AB, BB and no call) is calculated via Equation (3). The call with maximum posterior probability is assigned and then the maximum likelihood estimates of the model parameters, assuming these genotype calls, are computed, including the A allele frequency pj and probability of assay failure zj. Using these new parameters, genotype call probabilities are recomputed followed by re-estimation of the model parameters. This continues in an iterative fashion until the genotype call for each sample remains fixed across successive iterations. The genotype call with maximum posterior probability is the final call produced by the algorithm and the posterior probability itself a quality metric which may be subjectively interpreted as the probability that the genotype call is correct.
EM estimation of inbreeding coefficient: an estimate or prior belief for the inbreeding coefficient for each sample may be specified as input to the program and in this case this value will be used when calculating the prior distribution (π) in Equation (2) and posterior probabilities via Equation (3). Alternatively, ALCHEMY can estimate the inbreeding coefficient for each sample via EM. In this case, a randomly selected user-specified number of SNPs are called via the full ALCHEMY algorithm, initially with random values selected for the inbreeding coefficient. These initial values are sampled from a Gaussian distribution with a mean value that may be specified by the user for each sample, or for all samples without individually specified values by a command line parameter. If neither a command line default mean nor individually specified inbreeding coefficient starting value means are specified, the starting value distribution mean is set to 0.0. The SD of this starting value distribution is fixed in the program at 0.25, and invalid values [outside (−1.0, 1.0)] are truncated at the valid range endpoints. Given the genotype calls produced by ALCHEMY, the heterozygosities for each sample are computed (Hobs) and compared with the heterozygosity expected (Hexp) given the allele frequency at each SNP (estimated from the current genotype calls) assuming HWE. A new inbreeding coefficient is estimated by f = 1 − Hobs/Hexp. Using the new inbreeding coefficient values, genotype calling is repeated for the subset of SNPs. Iteration stops when the improvement in the total likelihood of the data no longer improves or a preset maximum number of iterations is exceeded. EM is performed for a user-specified number of random starting points and the inbreeding coefficients which produced the maximum total likelihood across all samples are retained and used for the final, full ALCHEMY run on all SNPs.
4 METHODS
SNP arrays: we designed two multiplexed high-throughput SNP genotyping products for use in genotyping a collection of inbred lines of O.sativa (domestic rice). The first product is an Illumina 1536 SNP GoldenGate Oligo Pool Assay (OPA) (Fan et al., 2003) intended for use in breeding applications. The second product is an Affymetrix 44 100 SNP GeneChip (Matsuzaki et al., 2004) designed through the company's custom genotyping program. This higher density array is intended both for direct use in GWAS in rice as well as a pilot array for designing a much higher density Affymetrix GeneChip. The vast majority of SNPs for both products were selected from the OryzaSNP project's Perlegen resequencing of 20 diverse O.sativa inbred lines (McNally et al., 2009), selected to represent four of the five major rice subpopulations plus one line from the aromatic/Group V subpopulation (Garris et al., 2005). For both arrays, SNPs were chosen primarily to obtain uniform density across the entire genome and to maximize informativeness both within and between the four major subpopulations for which multiple lines were resequenced in the OryzaSNP project. As only one line was resequenced in the Aromatic/Group V subpopulation, SNPs private to this subpopulation were not available for selection. Additionally for the 44 100 SNP array, SNPs were chosen to minimize pairwise linkage disequilibrium.
Samples: at the time of writing, both products have been utilized on a much larger number of samples than that which is presented in this article, as part of an ongoing effort. For the purposes of illustration of ALCHEMY and for consistency and comparability between the datasets, a subset of 166 samples were selected that were run on both the Illumina and Affymetrix platforms with some samples run multiple times on one or both platforms. Counting replicate assays, a total of 200 Affymetrix 44K assays and 184 Illumina 1536 assays are used. In the Affymetrix dataset, 22 samples were run at least twice. In the Illumina dataset, seven samples were run at least twice. The sample selection includes the two rice reference genome lines ‘Nipponbare’ (temperate japonica) and ‘9311’ (indica), as well as the Nipponbare × 9311 F1, run in several replicates on both platforms. An additional 30 lines have Illumina Genome Analyzer II short-read re-sequencing data which can be used to verify genotype calls. The remaining samples are all inbred domestic rice varieties representing all five major subpopulations of O.sativa (Garris et al., 2005) and are representative of a typical sample collection of interest in this system.
QC filtering: as with any new genotyping product, a number of intended SNP assays fail to convert to working assays in the multiplexed environment for reasons which cannot always be determined. All results presented here for the two rice arrays exclude up front SNPs which did not convert to working assays, to the best of our ability to determine. For both Illumina and Affymetrix rice arrays, we excluded SNPs which were inconsistent with Mendelian transmission across 33% or more of our control trios, and also excluded SNPs which had call rate of 67% or less. Since these SNPs are determined empirically from ALCHEMY or the vendor's software, we required that a SNP fail one or both of these criteria for both ALCHEMY and the vendor's software (Beadstudio or BRLMM-P) in order to be excluded. Thus, the exclusion list does not bias analyses in favor of either ALCHEMY or the vendor's software.
For the Illumina 1536 GoldenGate OPA, 93 SNPs were inconsistent with Mendelian transmission for both ALCHEMY and BeadStudio analyses in >33% of the possible trios formed from the Nipponbare, 9311 and Nipponbarex9311 F1 replicate samples and were excluded from all analyses. In addition, 21 SNPs were found to produce low call rates (<67%) in both BeadStudio and ALCHEMY analyses and were also excluded. The remaining 1422 SNPs (92.6% conversion rate) were evaluated for accuracy, concordance and call rates in this study.
For the Affymetrix 44 100 SNP array, 1850 SNPs were inconsistent with Mendelian transmission in both ALCHEMY and BRLMM-P analyses for >33% of control trios. Additionally, 755 SNPs produced low call rates (<67%) in both BRLMM-P and ALCHEMY analyses and were excluded from all analyses. A total of 41 495 SNPs were evaluated for accuracy and concordance in this study (94.0% conversion rate). For both Illumina and Affymetrix, the SNPs excluded by these criteria were excluded from both ALCHEMY and the vendor's software when computing accuracies, concordances and call rates.
For HapMap analyses, no exclusion of SNPs based on empirical measures of accuracy or call rate was performed under the presumption that the Affymetrix 500K Mapping GeneChip is a mature product containing SNPs already known to work with the manufacturer's system. However, since ALCHEMY presently does not handle hemizygosity due to male/female differences in sex chromosome copy number, all non-pseudo-autosomal X-chromosome SNPs were excluded from both ALCHEMY and BRLMM-P analyses. Additionally, two SNPs (SNP_A-1919896 and SNP_A-4299916) were excluded because the HapMap validation data contained genotypes that were inconsistent with the two alleles defined for these SNPs, indicating these SNPs may be tri-allelic.
Run-time options: ALCHEMY has very few run-time options or parameters other than input specification parameters that can be adjusted to improve performance and this is considered a feature rather than a bug or weakness (see Section 6). All analyses presented in this article used identical settings for these parameters, except for the proposal distribution means for inbreeding coefficients. For per-sample inbreeding coefficients, proposal distribution means were provided for each inbred sample as 0.95 and for F1 samples −0.5 was specified. As described, these values are means of starting point distributions for EM-estimated inbreeding coefficients for each sample. The EM step for estimating inbreeding coefficients for both Illumina 1536 and Affymetrix 44K rice arrays was performed for 10 random starting points on 1536 SNPs (whole array for Illumina, a random subset of SNPs for Affymetrix) and iterated until convergence. This step was also performed for the Human HapMap analysis, except a random subset of 5000 SNPs was used and the mean of the starting point distribution was set to 0.0 for all samples.
The degrees of freedom of the bi-variate t-distribution was set to 12 for all analyses. The sensible range for this ALCHEMY parameter is roughly 5–15. Similar results as those presented here are obtained at any setting in this range, though in general lower values produce slightly increased accuracies with decreased call rates, and higher values produce slightly reduced accuracy and higher call rates.
For each SNP, EM was performed at new starting points until 50 successive new starting points fail to produce a total likelihood higher than the maximum likelihood EM solution already observed. This stopping point parameter may be changed on the command line and will directly effect the total run-time of the method. For Affymetrix 44K analyses, a value of 50 produces similar run-times for ALCHEMY and BRLMM-P on the same data on a 8 CPU system. However, ALCHEMY is a multithreaded application and can utilize multiple CPUs while BRLMM-P cannot. Thus, ALCHEMY is roughly eight times the computational cost of BRLMM-P in terms of CPU-minutes at this setting. Reducing the value produces similar results but slightly reduced accuracies and call rates. Increasing the parameter increases accuracy and call rates but with greater and greater computational cost and diminishing returns. Because BeadStudio is a proprietary software and not available to us to run directly (analyses presented here were performed by the genotyping facility), we cannot compare run-time efficiency of ALCHEMY versus BeadStudio.
The depression in signal intensity for heterozygotes is perhaps the weakest aspect of the model and most likely to vary between genotype products and vendors. As separate parameters, it can be impossible to estimate in datasets lacking significant numbers of heterozygotes, or SNPs which are monomorphic within the sample batch or have very low minor allele frequencies. ALCHEMY can either attempt to estimate the heterozygote mean signal parameter for both channels or predict it on the basis of the homozygote signal mean and noise mean. A command-line parameter may be specified to indicate a threshold at which ALCHEMY should attempt to estimate the heterozygote signal mean (M-step) if the number of heterozygotes (as determined by the E-step) exceeds this threshold. Below this threshold, ALCHEMY will set these parameters to 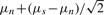 . If a value of 0 is specified for this parameter, estimation is turned off completely. For all analyses, this parameter was set to 5.
The most significant parameter affecting accuracies and call rates is the threshold at which genotypes with lower posterior probability of accuracy are declared ‘no call’. This threshold is not actually a proper parameter of the algorithm and is applied as a post-processing filter. The ALCHEMY algorithm always produces an AA, AB or BB genotype call in its output even if the assay-failure case produces the highest posterior probability. In that case, the genotype with the second highest posterior probability is the ALCHEMY call. For all analyses, a threshold of 0.80 was used and any call with posterior probability less than this was considered a ‘no call’.
The correlation between intensities for AA homozygotes is fixed by the program to tan−1(μnB/μsA) and analogously for the BB homozygote. The heterozygote correlation is set to tan−1(μAhs/μBhs) if μAhs < μBhs, and tan−1(μBhs/μAhs) if μBhs < μAhs, where μAhs is the heterozygous signal mean of the A allele channel, and likewise for the B channel. Analogous to the heterozygote case, the correlation between channels for the assay failure tan−1(μnA/μnB) if μnA < μnB, and tan−1(μnB/μnA) if μnB < μnA. The covariance matrix of the bi-variate t-distribution for evaluating the likelihood and computing the posterior probabilities is determined by these correlations and the EM estimates of the marginal variances. Setting these parameters to fixed values is not advised and unlikely to perform well. Changing the formulae for these parameters requires modifying the source code. Estimating these parameters proved difficult and reduced performance on small sample sets due to lack of information for estimating these parameters in addition to others required by the model.
HapMap analysis: the Affymetrix Human 500K GeneChip comes as two separate fixed arrays, the Nsp and Sty arrays, designated by the restriction enzyme used in the sample preparation protocol. These two chips were run separately for BRLMM-P since there is no mechanism to combine them. For ALCHEMY, however, superior results were obtained by running the two chips together in a single batch. Additionally, since the 270 HapMap samples are composed of 90 samples from each of three distinct and well-defined human subpopulations, these populations were run as separate batches for ALCHEMY. When combined, ALCHEMY estimates positive inbreeding coefficients as a result of the decreased heterozygosity in the structured population compared with the expectation for a single random-mating population. As separate batches, both slightly positive and negative inbreeding coefficients are estimated with a mean inbreeding coefficient near zero for all three populations. Accuracies and call rates were slightly improved by running each subpopulation separately. While there is no need to perform estimation of the inbreeding coefficient with these samples, ALCHEMY was run with the estimation turned on in order to conform as much as possible to the rice analyses.
Vendor algorithms: genotype calls produced by the ALCHEMY method were compared with calls produced by the vendor's software for both Illumina and Affymetrix rice arrays as well as the Human HapMap samples run on the Affymetrix Mapping 500K GeneChip. For Illumina BeadStudio, analyses were performed by the genotyping facility using the manufacturer's recommended settings. For Affymetrix, all BRLMM-P analyses were performed using Affymetrix Power Tools (APT) version 1.12.0-20091012 using the option ‘-a brlmm-p-plus’ to select an alternate recommended setting which demonstrated much better performance on the rice 44K array than the default ‘-a brlmm-p’ setting. For rice analyses, a ‘priors’ file was not available and not specified to the algorithm. Since rice does not have sex chromosomes, the option ‘–no-gender-force’ was used to turn off BRLMM-P features designed to handle hemizygosity in males for X chromosome SNPs. This option was also used for the Human HapMap samples, but all non-pseudo-autosomal X chromosome SNPs were excluded from both ALCHEMY and BRLMM-P analyses on these samples. A ‘priors’ file was not specified for the BRLMM-P analysis of HapMap samples.
5 RESULTS
In the development of the two genotyping products, we have four types of samples which can be used to evaluate performance of the assays themselves and the ALCHEMY genotype calling method: (i) reference samples, (ii) replicate samples, (iii) OryzaSNP samples and (iv) samples which have been re-sequenced by high-throughput short-read sequencing (Illumina GenomeAnalyzer II) to a sufficient extent to determine the allele at a large majority of SNP sites. Except where explicitly stated otherwise, all validations were performed comparing either ALCHEMY or the vendor's software (BeadStudio and BRLMM-P) run on the entire collection of 184 Illumina assays or 200 Affymetrix assays.
The ‘reference’ samples are the two rice lines for which assembled genome sequence is publicly available. The first, ‘Nipponbare’, is a temperate japonica line which has been extensively sequenced and assembled into high-quality pseudo-molecules (Goff et al., 2002). The second, ‘9311’, is an indica variety which has been sequenced by Sanger whole-genome shotgun sequencing and assembled using the Nipponbare genome sequence as a scaffold (Yu et al., 2002). Our samples bear the same name as these reference genomes but are not identical to the lines sequenced. As seen in Table 1, ALCHEMY calls replicate the expected calls based on the Nipponbare sequence to a high degree, but diverge from the 9311 genome sequence. However, since we have many replicates of these samples, we find that there is high concordance across our reference samples and it seems likely that the differences seen between our 9311 and the genome sequence reflect true differences, resulting from different origins of the materials. Likewise, the F1 genotypes which we predict from the Nipponbare and 9311 genome sequences also show differences with the ALCHEMY calls as a consequence of the divergent 9311 lines.
Table 1.
Comparison of reference lines to published genome sequence
| Illumina 1536 SNP GoldenGate OPA | |||||
|---|---|---|---|---|---|
| ALCHEMY |
BeadStudio |
||||
| Line | #a | Agreementb | Call rate | Agreementb | Call rate |
| (%) | (%) | (%) | (%) | ||
| Nipponbare | 7 | 99.6 | 99.0 | 96.4 | 99.6 |
| 9311c | 7 | 95.6 | 98.0 | 93.3 | 98.4 |
| NPx9311 F1d | 6 | 93.6 | 96.7 | 91.7 | 99.8 |
| Average | 96.4 | 98.0 | 93.9 | 99.2 | |
| Affymetrix 44K GeneChip | |||||
| ALCHEMY |
BRLMM-P |
||||
| Line | #a | Agreementb | Call rate | Agreementb | Call rate |
| (%) | (%) | (%) | (%) | ||
| Nipponbare | 7 | 99.1 | 97.6 | 93.2 | 87.1 |
| 9311c | 5 | 96.5 | 96.4 | 89.1 | 87.1 |
| NPx9311 F1d | 6 | 94.7 | 92.7 | 90.3 | 84.5 |
| Average | 96.9 | 95.6 | 91.1 | 86.2 | |
aNumbers reported are averages across replicate samples.
bPercentage of genotype calls which agree with published sequence presuming homozygosity.
cThe 9311 line genotyped in this study was obtained from a different source than the sequenced line (see text).
dGenotypes predicted from parental genome sequence assuming normal Mendelian transmission and presuming homozygosity of the parents.
Next we looked at the samples run in replicate, including the reference samples above. In the Illumina samples, we have seven samples run at least twice (including the 3 reference samples) with all pairs of replicates showing an average concordance of 99.6% and average pairwise mutual call rate (genotype called in both samples) of 95.4% (Table 2). This is also seen in the Affymetrix samples where 22 different samples run at least twice have an average pairwise concordance of 99.5% and average mutual call rate of 92.6%. This indicates both the assays themselves and ALCHEMY genotype calls are consistent across many distinct samples.
Table 2.
Pairwise concordance for replicate samples
| Illumina 1536 SNP GoldenGate OPA | |||||
|---|---|---|---|---|---|
| ALCHEMY |
BeadStudio |
||||
| Line | # pairs | Concordance | Call ratea | Concordance | Call ratea |
| (%) | (%) | (%) | (%) | ||
| Nipponbare | 21 | 100.0 | 98.4 | 98.5 | 99.3 |
| 9311 | 21 | 99.5 | 94.6 | 97.0 | 95.1 |
| NB+9311-GL | 15 | 99.5 | 93.7 | 98.4 | 99.4 |
| All others | 4 | 98.2 | 90.5 | 95.6 | 94.1 |
| Average | 99.6 | 95.4 | 97.8 | 97.5 | |
| Affymetrix 44K GeneChip | |||||
| ALCHEMY |
BRLMM-P |
||||
| Line | # pairs | Concordance | Call ratea | Concordance | Call ratea |
| (%) | (%) | (%) | (%) | ||
| Nipponbare | 21 | 99.6 | 95.7 | 98.1 | 80.1 |
| 9311 | 10 | 99.6 | 92.6 | 98.0 | 79.1 |
| NB+9311-GL | 15 | 99.4 | 88.6 | 98.5 | 75.0 |
| All others | 19 | 99.4 | 92.2 | 97.6 | 77.5 |
| Average | 99.5 | 92.6 | 98.0 | 78.0 | |
aCall rate in this table refers to the percentage of SNPs called in both samples of a replicate pair. Individual sample call rates are higher.
Because our SNP discovery panel was limited to 20 accessions across five subpopulations of domestic rice and we purposely selected SNPs that would be informative in at least 2 or more subpopulations where possible, there are no SNPs in the panel of lines studied here with a minor allele frequency < 10%. However, it is easy to construct a subset of samples such that a large percentage of SNPs will have only a single observation of the minor allele homozygote. To do this, we selected one Nipponbare control sample (a temperate japonica line) and 28 lines from the Aus subpopulation which is highly diverged from temperate japonica [FST = 0.42, (Garris et al., 2005)]. In this collection, we expect 11 465 SNPs to have minor allele frequency <10% and most of them only the Nipponbare control sample will have the minor allele. In this constructed subsample, for all SNPs, we found 99.7% agreement with consensus Nipponbare calls from the full dataset and a call rate of 98.0%, consistent with the results shown above. Limiting to just those SNPs which are expected to have a low minor allele frequency in this subsample, 99.1% of genotypes agreed with consensus Nipponbare calls with a call rate of 98.5%.
We also looked at the concordance between ALCHEMY calls and the OryzaSNP project's Perlegen sequence from which these assays were designed. Unfortunately, while the materials utilized in our study are identical or as closely related as possible to the original OryzaSNP lines, the Perlegen dataset contains many missing observations and an average per-line error rate of approximately 2.9% [(McNally et al., 2009)–MBML intersect set]. Comparing ALCHEMY genotype calls on these samples to the Perlegen sequence confirms this with an average concordance of 96.5% (see Supplementary Table 1).
Finally, in an effort to discover more SNPs for the production of an even larger genotyping array, we have performed short-read next-generation sequencing on 19 inbred rice lines utilizing the same material as that which was genotyped. Additionally, another 11 lines have been re-sequenced by collaborating groups, in most cases utilizing materials derived from the same original sources as our materials. Combining these datasets and analyzing them to determine the genotypes expected (presuming homozygosity) for these lines from the sequence data, we can compare these expected genotypes to ALCHEMY calls. On average, we find a high concordance (average 99.1%, call rate 96.3%) with some of the lines having lower concordance being those derived from distinct plant materials or having lower coverage depth in re-sequencing (Supplementary Table 2). Taken together, these analyses broadly validate ALCHEMY's genotype calls across many different rice samples.
Next, we asked whether or not ALCHEMY was over-fit to these specific genotyping products. The vendor's genotyping algorithms work well for human products and other supported products, but did not perform well ‘out-of-the-box’ on our custom arrays and our samples as demonstrated above. In the interest of promoting the development of new genotyping products in more systems, we would like to have a genotyping algorithm that performs well across a broad range of vendors, products, systems and sample sets, requiring little or no empirical fine-tuning to obtain high-quality data. To assess ALCHEMY's performance on a non-rice dataset, we obtained the publicly available HapMap Phase II published genotypes and the Affymetrix Human 500K GeneChip .CEL files that were run on these same samples and ran ALCHEMY and BRLMM-P (Table 3). As expected, BRLMM-P performs very well as it, and its predecessor BRLMM, has been developed and tuned for Affymetrix Human Genotyping products. Although ALCHEMY does not perform as well as BRLMM-P on Human HapMap samples, it still performs very well even without specific tuning or trial-and-error adjustments to improve accuracy or call rate. These results, taken together with the results above showing strong performance on two very different technologies, suggests ALCHEMY is a generalized method with broad applications, especially for custom products where fine-tuned specialized algorithms are not available.
Table 3.
ALCHEMY versus BRLMM-P on 270 Human HapMap Phase II samples
| ALCHEMY (%) | BRLMM-P (%) | |
|---|---|---|
| Accuracy | 99.78 | 99.82 |
| Call rate | 98.82 | 99.19 |
Accuracy refers to the agreement between genotype calls for the respective algorithm and HapMap Phase II published genotypes.
Finally, since custom products may require optimization of molecular techniques and protocols to obtain optimal results, we wanted to develop a method which produced accurate and usable results even if the total sample size was small. To demonstrate ALCHEMY's ability to call small sample sizes, we ran ALCHEMY as well as the vendor's software on a series of sample subsets and assessed the accuracy and call rates for our three reference samples: Nipponbare, 9311 and the Nipponbare X 9311 F1. Additionally, we ran each of the three reference samples alone to assess performance on a single sample. Because of the unfortunate discrepancy between our 9311 line and the 9311 line which was sequenced, we gauge ‘accuracy’ on the basis of agreement with the consensus ALCHEMY calls for these samples across all replicates in the full dataset but restrict ourselves to SNPs with consensus calls which are consistent with Mendelian transmission to the F1 in the full dataset. In Table 4, we find that ALCHEMY quickly attains >99% accuracy with as few as 18 samples (see also Fig. 2 for a graphical representation of Table 4). Additionally, it performs very well on either homozygote sample alone, but quite poorly on the heterozygote sample alone. In contrast, BRLMM-P performs very poorly on any of the three reference samples alone and poorly on small samples sizes. BRLMM-P accuracy increases as sample size increases, as expected, but surprisingly, call rates decline. Similar results are observed with Illumina BeadStudio, except call rates do not decline with larger sample size and BeadStudio performs very well on either homozygote sample alone, but not with the heterozygote sample alone (Supplementary Table 3).
Table 4.
ALCHEMY versus BRLMM-P on single samples and small sample subsets
| # of samples | ALCHEMY |
BRLMM-P |
||
|---|---|---|---|---|
| Accuracy | Call rate | Accuracy | Call rate | |
| (%) | (%) | (%) | (%) | |
| Nipponbare alone | 99.2 | 94.9 | 83.2 | 98.2 |
| 9311 alone | 98.8 | 96.1 | 80.1 | 98.4 |
| NPx9311 (F1) alone | 69.0 | 99.2 | 89.8 | 98.6 |
| 3 (full trio) | 97.1 | 97.9 | 87.6 | 97.8 |
| 6 | 97.7 | 97.4 | 87.7 | 96.8 |
| 9 | 98.6 | 97.2 | 87.7 | 96.0 |
| 12 | 98.8 | 97.3 | 88.1 | 95.3 |
| 18 | 99.2 | 97.4 | 88.7 | 94.4 |
| 24 | 99.3 | 97.5 | 89.1 | 93.4 |
| 48 | 99.5 | 97.5 | 90.1 | 91.0 |
| 72 | 99.6 | 97.6 | 91.6 | 90.2 |
Fig. 2.

Effect of increasing number of samples which are simultaneously analyzed for ALCHEMY and BRLMM-P (Affymetrix 44K).
6 DISCUSSION
The design of ALCHEMY was motivated primarily by two concerns: (1) the poor performance of the vendor's software on inbred sample sets and (2) the requirement for a large number of samples to be simultaneously analyzed to obtain accurate results. As mentioned previously, the two concerns are related, as the main reason many samples are required for clustering algorithms is to ensure that each genotype cluster is well represented allowing its location and boundaries to be well defined. Thus, if heterozygotes are rare or absent in the data due to inbreeding, the heterozygote cluster cannot be reliably identified even if large numbers of inbred samples are used.
To address this, we have proposed a statistical model to describe the raw intensity data which is the basic observation of both Affymetrix and Illumina genotyping platforms. The model is capable of making an inference even if only a single sample is analyzed, but the parameters of the model are refined and optimized when several samples are available for simultaneous inference. In addressing concern (2), this approach is shown to be highly successful, with ALCHEMY obtaining >99% accuracy with as few as 18 samples on the Affymetrix 44K platform, and larger number of samples continuing to improve call rates. Additionally, the statistical treatment of the problem permits inbreeding to be explicitly considered and incorporated into the model in an appropriate way. Simultaneously estimating and optimizing the inbreeding coefficient on a per-sample basis allows both outbred and inbred samples to be analyzed simultaneously and improves both accuracy and call rates.
Although not studied extensively here, the posterior call probability produced by ALCHEMY as a quality metric can conceivably be used directly in downstream population genetic and quantitative genetic statistical analyses. For the rice datasets and the Human HapMap dataset, the signal-to-noise ratio of the intensity data is strong enough that for most SNPs there is little uncertainty in the genotype call. However, in noisier data, incorporating the probability of error estimated by ALCHEMY for genotype calls into statistical analyses may allow for more accurate population genetic inferences and improve both sensitivity and specificity of GWAS. We caution, however, that these probabilities are subjective due to the use of a Bayesian model and may not precisely correspond to actual observed error rates. The Bayesian model not only presumes the bimodal intensity distribution but also HWE (with inbreeding adjustment) of genotype frequencies across the sample set. Violation of either model assumption will introduce deviations between expected error rates [formed by summing (1 − p) were p is the posterior probability of the call] versus observed error rates. This is particularly relevant for our rice samples which come from a highly structured population where deviations from HWE frequencies are expected not only due to inbreeding but also from differences in allele frequencies between subpopulations.
The results presented here show that ALCHEMY's performance is superior to either vendor's standard software on the two rice genotyping products considered. Additionally, the strong performance on Human HapMap data suggests that ALCHEMY may work well on a wide range of products. We have also tested ALCHEMY on currently unpublished data from dogs in both Affymetrix and Illumina products and found a consistent high level of performance at or exceeding the levels reported here. While BRLMM-P outperforms ALCHEMY on the HapMap samples, it is important to note that we did not attempt to tune or alter ALCHEMY for improved performance on HapMap as the purpose was to test whether or not ALCHEMY is already over-fit to the rice genotyping arrays for which it was developed.
Compared to many other genotype calling software packages, ALCHEMY has relatively few options to tune its performance for specific datasets. In part, we consider this a feature rather than a weakness, as the multitude of tuning parameters for programs such as BRLMM-P are bewildering to the user and potentially allow the user to over-fit the model or program by trial-and-error to the control samples for which genotypes are known, at the expense of a potentially worse performance on samples for which validation cannot be performed. In practice, there are four main options that may affect accuracy of genotype calls and posterior call probabilities: the number of degrees of freedom for the bi-variate t distribution, whether or not to estimate heterozygote signal means and at what number of suspected heterozygotes to use these estimates, EM parameters such as the maximum number of iterations and the number of starting points to try, and finally, whether or not to use the EM algorithm to estimate inbreeding coefficients, specify them for each sample, or set them all to 0.0 or another fixed value. These parameters and the values used for the analyses presented here are discussed in Section 4. All other aspects, such as normalization, channel intensity correlation, allele frequency estimates and estimates of per-SNP assay failure probabilities, are automatically handled.
The most influential parameter under a user's control is the threshold at which a ‘no call’ is declared, but this is not actually a direct parameter to the ALCHEMY program. ALCHEMY will always produce an AA, AB or BB genotype call and a corresponding ‘posterior call probability’ as a subjective measure of confidence in the accuracy of this call. Many users will simply want to use this to filter out a subset of low-quality calls which are then treated as missing data in downstream analyses. To demonstrate the effect of this parameter, in Figure 3 we show accuracy of genotype calls versus the percentage of genotypes declared ‘no call’ (‘drop rate’) for each of the genotyping products studied. To the extent these probabilities reflect actual frequencies of genotype calling errors, the threshold at which to declare a genotype ‘no call’ provides a direct but flexible trade-off between accuracy and call rate. Different thresholds can be utilized depending on whether or not the downstream analysis is more sensitive to missing data or potentially inaccurate genotypes. Although our primary motivation in developing ALCHEMY was to model inbreeding for improved performance on our own genotyping products, the strong performance on HapMap samples out-of-the-box with no specific optimization of ALCHEMY's run-time parameters including the threshold for declaring no calls suggests that the ALCHEMY algorithm is robust, broadly applicable and does not require extensive tuning to obtain good performance. We caution, however, that despite all efforts to produce a robust algorithm, there is no substitute for performing empirical validation utilizing Mendelian trios, samples with known genotypes from exogenous sources and replicate samples.
Fig. 3.

Trade-off between accuracy and completeness of the dataset generated by varying the threshold at which genotypes with lower posterior probabilities are declared ‘no call’ and dropped from the final dataset. Note the limited range of the y-axis.
A novel feature of ALCHEMY is the use of a population genetic model to inform the genotype calling process, allowing the explicit handling of inbreeding and the ability to simultaneously estimate both genotypes and inbreeding levels from the raw intensity data. However, as mentioned above, the prior probabilities only hold for a single population, and the presence of subpopulation structure may result in overestimation of inbreeding coefficients. Regardless, for genotype calling in ALCHEMY, only the reduction in expected heterozygosity is relevant, not whether it is due to inbreeding or population structure. The difference in allele frequencies between subpopulations may effect the accuracy of the posterior call probability and thus the genotype calls since the prior probability is formulated in terms of HWE frequencies (accounting for inbreeding) assuming a single, random mating population. In principle, however, it is possible to extend ALCHEMY such that population structure, and inbreeding within subpopulations, is simultaneously estimated along with genotype calls, potentially improving the accuracy of both analyses.
7 AVAILABILITY
ALCHEMY is written in C and developed and used under the GNU/Linux environment. It is available free of charge for both commercial and academic use under the terms of the GNU General Public License version 3. Source code and documentation is available at http://alchemy.sourceforge.net/. Source code is expected to compile and run on any GNU/Linux platform, Mac OS X and Unix environments with the GNU C compiler and associated tools installed.
Supplementary Material
ACKNOWLEDGEMENTS
DNA and plant material for the Nipponbare x 9311 F1 as well as the exact parent lines was provided by Dr Guo-Liang Wang. Dr Brian Scheffler on behalf of the RiceCAP project (USDA/CSREES grant 2004-35317-14867) provided raw Illumina GenomeAnalyzer II reads for lines Cypress, LaGrue, Bengal, Cocodrie, Francis, Lemont, Tequing, Jasmine85 and Wells which were used in validating genotype calls on these lines. Resequencing data for Koshihikari was provided by Dr Masahiro Yano. Resequencing data for IR64 was provided by Dr Pam Ronalds.
Funding: Funding for all authors was provided by United States National Science Foundation, grant #0606461 to SMc and CDB.
Conflict of Interest:none declared.
REFERENCES
- Affymetrix Inc. BRLMM: an improved genotype calling method for the genechip® mapping 500k array set. 2006 Available at http://affymetrix.com/support/technical/whitepapers/brlmm_whitepaper.pdf (last accessed date September 29, 2010) [Google Scholar]
- Buckler ES, et al. The genetic architecture of maize flowering time. Science. 2009;325:714–718. doi: 10.1126/science.1174276. [DOI] [PubMed] [Google Scholar]
- Carvalho B, et al. Exploration, normalization, and genotype calls of high-density oligonucleotide snp array data. Biostatistics. 2007;8:485–499. doi: 10.1093/biostatistics/kxl042. [DOI] [PubMed] [Google Scholar]
- Fan JB, et al. Highly parallel snp genotyping. Cold Spring Harb. Symp. Quant. Biol. 2003;68:69–78. doi: 10.1101/sqb.2003.68.69. [DOI] [PubMed] [Google Scholar]
- Garris AJ, et al. Genetic structure and diversity in Oryza sativa l. Genetics. 2005;169:1631–1638. doi: 10.1534/genetics.104.035642. [DOI] [PMC free article] [PubMed] [Google Scholar]
- Goff SA, et al. A draft sequence of the rice genome (Oryza sativa l. ssp. japonica) Science. 2002;296:92–100. doi: 10.1126/science.1068275. [DOI] [PubMed] [Google Scholar]
- Hirschhorn JN, Daly MJ. Genome-wide association studies for common diseases and complex traits. Nat. Rev. Genet. 2005;6:95–108. doi: 10.1038/nrg1521. [DOI] [PubMed] [Google Scholar]
- Kim S, Misra A. Snp genotyping: technologies and biomedical applications. Annu. Rev. Biomed. Eng. 2007;9:289–320. doi: 10.1146/annurev.bioeng.9.060906.152037. [DOI] [PubMed] [Google Scholar]
- Korn JM, et al. Integrated genotype calling and association analysis of snps, common copy number polymorphisms and rare cnvs. Nat. Genet. 2008;40:1253–1260. doi: 10.1038/ng.237. [DOI] [PMC free article] [PubMed] [Google Scholar]
- Liu W, et al. Algorithms for large-scale genotyping microarrays. Bioinformatics. 2003;19:2397–2403. doi: 10.1093/bioinformatics/btg332. [DOI] [PubMed] [Google Scholar]
- Maresso K, Broeckel U. Genotyping platforms for mass-throughput genotyping with snps, including human genome-wide scans. Adv. Genet. 2008;60:107–139. doi: 10.1016/S0065-2660(07)00405-1. [DOI] [PubMed] [Google Scholar]
- Matsuzaki H, et al. Genotyping over 100,000 snps on a pair of oligonucleotide arrays. Nat. Methods. 2004;1:109–111. doi: 10.1038/nmeth718. [DOI] [PubMed] [Google Scholar]
- McCarthy MI, et al. Genome-wide association studies for complex traits: consensus, uncertainty and challenges. Nat. Rev. Genet. 2008;9:356–369. doi: 10.1038/nrg2344. [DOI] [PubMed] [Google Scholar]
- McNally KL, et al. Genomewide snp variation reveals relationships among landraces and modern varieties of rice. Proc. Natl Acad. Sci. USA. 2009;106:12273–12278. doi: 10.1073/pnas.0900992106. [DOI] [PMC free article] [PubMed] [Google Scholar]
- Rabbee N, Speed TP. A genotype calling algorithm for affymetrix snp arrays. Bioinformatics. 2006;22:7–12. doi: 10.1093/bioinformatics/bti741. [DOI] [PubMed] [Google Scholar]
- Teo YY, et al. A genotype calling algorithm for the illumina beadarray platform. Bioinformatics. 2007;23:2741–2746. doi: 10.1093/bioinformatics/btm443. [DOI] [PMC free article] [PubMed] [Google Scholar]
- The International HapMap Consortium. A haplotype map of the human genome. Nature. 2005;437:1299–1320. doi: 10.1038/nature04226. [DOI] [PMC free article] [PubMed] [Google Scholar]
- The International HapMap Consortium. A second generation human haplotype map of over 3.1 million snps. Nature. 2007;449:851–861. doi: 10.1038/nature06258. [DOI] [PMC free article] [PubMed] [Google Scholar]
- Yang H, et al. A customized and versatile high-density genotyping array for the mouse. Nat. Methods. 2009;6:663–666. doi: 10.1038/nmeth.1359. [DOI] [PMC free article] [PubMed] [Google Scholar]
- Yu J, et al. A draft sequence of the rice genome (Oryza sativa l. ssp. indica) Science. 2002;296:79–92. doi: 10.1126/science.1068037. [DOI] [PubMed] [Google Scholar]
- Yu J, et al. Genetic design and statistical power of nested association mapping in maize. Genetics. 2008;178:539–551. doi: 10.1534/genetics.107.074245. [DOI] [PMC free article] [PubMed] [Google Scholar]
Associated Data
This section collects any data citations, data availability statements, or supplementary materials included in this article.