

Abstract
Ante-mortem diagnosis of neurodegenerative disorders based on clinical features alone is associated with variable sensitivity and specificity, and biomarkers can potentially improve the accuracy of clinical diagnosis. In patients suspected of having Alzheimer’s disease (AD), alterations in cerebrospinal fluid (CSF) biomarkers that reflect the neuropathologic changes of AD strongly support the diagnosis, although there is a trade-off between sensitivity and specificity due to similar changes in cognitively healthy subjects. Here we review the current approaches in using CSF AD biomarkers (total tau, p-tau181, and Aβ42) to predict the presence of AD pathology, and our recent work using multi-analyte profiling to derive novel biomarkers for biofluid-based AD diagnosis. We also review our use of the multi-analyte profiling strategy to identify novel biomarkers that can distinguish between subtypes of frontotemporal lobar degeneration, and those at risk of developing cognitive impairment in Parkinson’s disease. Multi-analyte profiling is a powerful tool for biomarker discovery in complex neurodegenerative disorders, and analytes associated with one or more diseases may shed light on relevant biological pathways and potential targets for intervention.
Keywords: Biomarker, diagnosis, Alzheimer’s disease, frontotemporal dementia, Lewy bodie, tau, tauopathy, TDP-43
INTRODUCTION
Age-related neurodegenerative diseases, including Alzheimer’s disease (AD)[5], frontotemporal lobar degeneration (FTLD),[18] amyotrophic lateral sclerosis (ALS), dementia with Lewy bodies (DLB),[33] and Parkinson’s disease (PD), represent a growing challenge for patients, caregivers, and clinicians. Among these, AD is the most common disorder, with an estimated worldwide prevalence of over 26 million.[13] AD is thus the focus of investigation by many independent as well as coordinated efforts, with an increasing emphasis on advancing key areas of personalized medicine, i.e. diagnosis, prognosis, and intervention at the individual patient level. These efforts have resulted in the wide spread use of medications alleviating the cognitive symptoms of AD and the growing investment in the development of disease-modifying small molecule drugs that specifically target the signature pathologic changes in AD including neuritic plaques and neurofibrillary tangles. In that regard, neuropathologic analysis of post-mortem central nervous system (CNS) tissue specimens over the past century has led to the identification of these histochemical changes as the most likely pathologic substrates for AD and therefore the most suitable targets for intervention. Early identification of patients with the characteristic pathologic alterations of AD will be not only essential for accurate diagnosis but also appropriate patient selection for substrate-specific disease modifying therapy. While clinical diagnosis may achieve highly sensitive selection of patients with underlying AD pathology (in part due to its high prevalence in the elderly population), prediction of AD as the disease-causing pathology in any given patient based on clinical characterization alone is often associated with suboptimal specificity due to atypical or late clinical presentations, medical co-morbidities (cerebrovascular disease, alcoholism, polypharmacy), and the common presence of concomitant additional pathologic findings including lesions immunoreactive to TAR DNA binding protein of ~43 kD (TDP-43) or α-synuclein. The introduction of structural and functional imaging to the process of clinically predicting AD as the underlying pathology responsible for dementia has increased the overall diagnostic accuracy, although such structural and functional changes often occur as a mid-to-late consequence of disease (for a recent review, see Jack et al, 2010).[48] A potentially earlier and more reliable method of differentiating between multiple underlying pathologic substrates for cognitive impairment is the use of biomarkers in physiologic fluids such as blood or cerebrospinal fluid (CSF).
Ante-mortem biomarkers have a long history in neurological practice. Quincke first devised a clinical lumbar puncture procedure for possible diagnostic purposes in 1891, and Lichtheim and von Ziemssen each contributed to the earliest use of CSF examination in the differential diagnosis of meningitis.[36] In the modern era, CSF examination has been a critical step in the diagnosis of multiple sclerosis.[9] AD-related proteins/peptides were first identified in the CSF, and CSF levels of total tau, tau phosphorylated at threonine 181 (p-tau181), and amyloid-beta 1-42 (Aβ42) have subsequently emerged as the most reliable analytes associated with eventual pathologic confirmation of AD among other candidate proteins.[21, 69] At the University of Pennsylvania (UPenn), patients with neurodegenerative disorders were historically evaluated at the respective clinical unit or center with expertise in the diagnosis and management of each disorder. These units include the NIA funded Alzheimer Disease Core Center (ADCC), the Frontotemporal Dementia (FTD) Clinic, the amyotrophic lateral sclerosis (ALS) Clinic, and the NINDS funded Udall Parkinson’s Disease Center. With our long-standing interest in CSF biomarkers of AD,[21] we have been collecting CSF in a standardized fashion from patients evaluated in each of these clinical units and healthy elderly volunteers for >10 years. The standardized collection and banking procedures allow for comparative analysis between a disease of interest and other neurological disorders, identification of analytes related to specific stages of disease (prodromal, mild, moderate, severe), and correlational studies of clinical longitudinal changes following CSF collection for “predictive” testing based on sequential and temporal-specific modulations in CSF analyte profiles. Importantly, as few studies in biomarker discovery and validation have used neuropathologic analysis as the true gold standard,[15, 19, 21, 26, 29] we have accumulated a collection of CSF samples from patients with known pathology despite the long delay between CSF collection and autopsy.[42] Analyte stability over years of storage, even at −80°C, also needs to be determined for each biomarker of interest. However, this long-term collection and banking effort is now linked to a rich body of longitudinal clinical information, and has become a resource for novel biomarkers analyzed by new platforms. One such technology is Luminex multiplex platform which allows for simultaneous measurements of multiple analytes using very small volumes (e.g. 75 μl) of CSF. Using proprietary assays in the Human DiscoveryMAP™ panel designed and validated by Rules-Based Medicine, Inc. (RBM, Austin, Texas), we have been able to interrogate the levels of 150 – 189 analytes in the CSF and plasma of patients evaluated in the UPenn specialty clinical units and centers. Since we approach an era in which the diagnosis of dementia due to AD will depend on both clinical impression and biological support of AD pathology[6] and other diseases will likely follow, this review aims to address some of the advantages and limitations of several different contemporary analytical approaches to biomarker measurement, and to review the most recent work we and others have presented on the use of multi-analyte profiling in discovering novel biomarkers in neurodegeneration.
ALZHEIMER’S DISEASE
Approach 1: Core Analytes, Single threshold
The use of a single analyte with a single threshold value is perhaps the most familiar classification strategy to the practicing physician. Each clinical laboratory has a set of defined cut-off values, sometimes age- and gender-adjusted, for common systemic illnesses associated with neurological manifestations such as vitamin B12 deficiency and hypothyroidism. Multiple peptides have been proposed as such a litmus test for AD (reviewed by Shaw et al.[68]), and CSF levels of peptides associated with the underlying AD pathology[5] – total tau, p-tau181, and Aβ42 – have been the most widely studied surrogate markers. Alterations of these peptides have been found in autopsy-confirmed cases of AD:[26] CSF Aβ42 levels are decreased in AD presumably due to aggregation of soluble extracellular Aβ42 peptides in neuritic plaques, while CSF tau and p-tau181 levels are increased due to release from degenerating neurons.[15, 68] Multiple monoclonal antibody combinations are available commercially or through the development of individual laboratories for each peptide, and standardized kits to be used in an enzyme-linked immunosorbent assay (ELISA) are commercially available. The clear advantages of using such an assay system include its low upfront cost and convenience, as most investigators have expertise in developing or applying ELISA to peptide targets without highly specialized reagents or instruments.
At the same time, the ease of conducting such assays comes at the cost of relatively higher inter-assay variability which has been the main barrier in translating ELISA-based analyses to the clinical diagnosis of AD. While coefficients of variation (%CV) can be reduced significantly over a large number of samples and assays at single centers,[66] significant inter-center variability continues to be reported. In one study that attempted to address this type of variability across 14 clinical neurochemistry laboratories in Europe (Germany, Austria, and Switzerland) using commercially available ELISA kits (Innogenetics, Gent, Belgium), the CV of ELISA-based assays were in the 20–30% range (26% for tau, 27% for p-tau181, and 29% for Aβ42).[52] In another study in 2004, 13 international centers each received three CSF-pool samples, and the majority used the same commercially available ELISA kits to measure levels of AD biomarkers.[79] The CV for Aβ42 ranged from 17 to 53%, with CV for tau ranging from 13–29% and for p-tau181 ranging from 10 to 16%. The variability improved when the same samples were again assayed by the participating centers 4 years later, with CV ranging from 19–26% for Aβ42, 13–18% for tau, and 14–16% for p-tau181.[79]
This type of variability is especially troublesome when levels of different biomarkers are combined, as there is a certain degree of variation associated with each analyte analyzed in the model. For example, in our analysis of the best predictor combination of CSF AD biomarkers to differentiate between pathologically confirmed cases of AD and FTLD, our initial analysis derived a cut-off value of 1.06 for the CSF total tau to Aβ42 ratio (tau/Aβ42) to achieve 78.9% sensitivity and 96.6% specificity in distinguishing between FTLD and AD.[11] However, our subsequent re-analysis of a larger cohort including both CSF samples from living patients and pathologically confirmed cases derived a cut-off value of 1.45 using the same set of autopsy-confirmed cases as our initial analysis.[45] These differences were not due to cases having widely different relative levels of tau or Aβ42, but rather small differences in measured levels of tau and Aβ42. One potential solution is the inclusion of autopsy-confirmed cases within each experimental design to derive the receiver operating curve (ROC) for each assay, although there is a limited supply of autopsy-confirmed cases with ante-mortem CSF and it will be impractical to translate this approach to additional sites where similar assays will be performed. A second approach is to come up with systematic numeric normalization to account for the inter-site and inter-assay variability, which has been demonstrated in a multi-center study.[55] The exact variability this method introduces is unclear, and deserves further review.
An alternative to the use of ELISA to measure levels of CSF AD biomarkers is the use of a bead-based approach (AlzBio3®, Innogenetics, Ghent, Belgium)[47] in the Luminex platform. Instead of plate-mounted antibodies, antibodies targeting total tau, p-tau181, and Aβ42 are attached to beads that can be suspended in solution. This method resembles more a solution-phase interaction between specific antibodies and paired antigens, and has been empirically determined to be associated with less intra- and inter-assay variability. As part of the Alzheimer’s Disease Neuroimaging Initiative (ADNI) Biomarker Core,[69] a seven-site round robin study was undertaken to determine the inter-site and inter-assay variability of pooled CSF samples.[76] The intra- and inter-assay CVs using 5 pooled CSF samples averaged 6.7–7.5% within single centers, and 18–20% for Aβ42, 12–19% for tau, and 15–26% for p-tau181 between centers, compared to the 20–30% values typically seen in ELISA-based assays. Currently, additional work is underway to explore and minimize such inter-center CVs similar to what was done to ELISA-based assays. The advantages of a Luminex-based approach thus include the increased precision and the ability to multiplex assays using a very small sample volume of biofluid, while the disadvantages include the upfront cost and the maintenance of the specialized equipment. Using living cognitively normal subjects (n=52) and autopsy-confirmed cases of AD (n=56) from UPenn, Shaw and co-workers were able to use the Luminex platform in a multiplex fashion to derive threshold values for each CSF AD biomarker (i.e. total tau, p-tau181, and Aβ42) to distinguish between AD and cognitively normal subjects.[69] The observed trade-off between sensitivity and specificity was similar to that seen in ELISA-based analyses, with CSF Aβ42 levels garnering higher sensitivity at the cost of specificity, and CSF tau levels associated with higher specificity at the cost of lower sensitivity. Also similar to work based on ELISA, combination of the two biomarkers – either as a ratio or as linear combinations[55, 69] – achieved a stronger balance between sensitivity and specificity, again suggesting that the use of multiple biomarkers instead of any single biomarker may generate the best diagnostic profile for AD against cognitively healthy subjects.
However, a number of questions remain unanswered in the use of a single cut-off value for each core analyte or analyte combination. For example, do the threshold values derived from studies of AD vs. cognitively healthy subjects apply to the distinction between AD and non-AD dementing illnesses? Given the lag time between clinical CSF collection and autopsy evaluation, most studies rely on analysis of living AD patients or living cognitively health subjects, and few reports are available on the relationship between these CSF AD biomarkers and the eventual pathologic diagnosis.[19, 21, 29] As detailed neuropathologic analysis remains the gold standard against which biomarkers are compared, cut-off values based on living patients and control subjects may over- or under-estimate the diagnostic accuracy given any threshold level. Furthermore, such cut-off values are usually derived from comparisons between elderly AD patients (with or without autopsy confirmation) and age-matched cognitively normal control subjects. The proportion of cognitively healthy subjects with an “abnormal” (i.e. AD-like) pattern of CSF AD biomarker profile may increase with age either as a reflection of the increasing incidence of age-associated amyloidosis or pre-symptomatic AD.[27] In 168 living cognitively healthy subjects who underwent CSF analysis by ELISA, Morris and colleagues found age-associated trends of change in Aβ42, total tau, and p-tau181 all in the direction of pathologic alterations in those with and without the ApoE ε4 allele.[58] When a cut-off value of 500 pg/mL was used to distinguish between normal and pathologic levels of CSF Aβ42, the proportion of cognitively healthy subjects with AD-like biomarker levels increased from 18.2% among those 45–49 years of age to 50% among those 80–89 years of age. Thus, cut-off values derived from studies using older cognitively health subjects must strike a balance between the sensitivity of detecting symptomatic and pre-symptomatic AD,[28] and the specificity associated with clinical cognitive status. On the other hand, in younger subjects with cognitive concerns and patients with non-AD neurodegenerative disorders (FTLD, DLB, vascular dementia) who often have younger ages of onset than patients with AD,[31, 41, 44] applying threshold values from elderly AD vs. age-matched cognitively healthy subjects may underestimate the proportion of younger patients with pathologic AD. Therefore, as our first analysis using CSF from patients with known pathology (n=91) and living cognitively healthy subjects (n=33, Table 1),[42] we sought to validate the diagnostic utility of established CSF AD biomarkers and their proposed threshold values in a Luminex platform in differentiating between pathologically confirmed AD and non-AD neurodegenerative disorders.
Table 1.
Subjects included in the initial CSF biomarker studies, including cognitively healthy subjects and demented subjects with known pathology. Neuropathologic diagnosis was made based on published consensus criteria.
| Group | Cognitively Healthy (n=33) | AD (n=66) [5] | FTLD-TDP (n=14) [18] | FTLD-Tau (n=9) [18] | DLB (n=2) [33] |
|---|---|---|---|---|---|
| % Female | 58 | 53 | 50 | 44 | 0 |
| Age at onset, yr (SD) | - | 67.11 (9.94) | 57.21 (7.46) | 61.44 (9.25) | 68.00 (5.66) |
| Age at CSF, yr (SD) | 71.79 (9.26) | 70.79 (9.26) | 59.57 (6.91) | 64.11 (9.14) | 71.00 (5.66) |
| Disease duration at CSF, yr (SD) | - | 3.65 (2.14) | 2.29 (1.64) | 3.22 (1.48) | 2.50 (0.71) |
| Age at death, yr (SD) | - | 76.08 (10.17) | 62.57 (8.46) | 67.56 (9.94) | 75.50 (9.19) |
| Disease duration, yr (SD) | - | 8.97 (3.44) | 5.36 (3.15) | 6.11 (2.47) | 7.50 (3.54) |
Using previously proposed threshold values,[69] CSF levels of total tau, p-tau181, and Aβ42 in general achieved adequate performance in distinguishing between cases of AD and non-AD neurodegenerative disorders (Table 2). When each traditional AD biomarker or biomarker combination (e.g. CSF levels of total tau, p-tau181, and Aβ42) was examined, measurement of Aβ42 levels again was highly sensitive with moderate specificity (overall diagnostic accuracy of 90.1%, other performance characteristics in Table 2), while total tau and p-tau181 levels achieved high specificity at the cost of sensitivity. Compared to the performance characteristics of the same biomarkers in differentiating between AD and cognitively healthy subjects, p-tau181 was associated with much higher specificity when used to distinguish between AD and non-AD dementia cases (92.0%) than when used to differentiate between AD and cognitively healthy subjects (73.1%), although the ratio of tau/Aβ42 continued to provide the best balance between sensitivity and specificity.
Table 2.
Sensitivity, specificity, and diagnostic accuracy of established CSF AD biomarker or biomarker combination in the distinction between autopsy-confirmed AD (n=66) and non-AD neurodegenerative disorders (n=25) using cut-off values (in parentheses) from Shaw et al.
| Aβ42 (192 pg/mL) | Tau (93 pg/mL) | p-tau181 (23 pg/mL) | Tau/Aβ42 (0.39) | p-tau181/Aβ42 (0.10) | |
|---|---|---|---|---|---|
| Sensitivity (%) | 93.9 | 56.1 | 60.6 | 80.3 | 80.3 |
| Specificity (%) | 80.0 | 88.0 | 92.0 | 84.0 | 80.0 |
| Diagnostic Accuracy (%) | 90.1 | 64.8 | 69.2 | 81.3 | 80.2 |
It is also noteworthy that the overall diagnostic accuracy of total tau or p-tau181 as a single biomarker to separate AD from non-AD disorders was at similar levels as chance alone (assuming all cases are AD; diagnostic accuracy=72.5%, with 100% sensitivity and 0% specificity). Thus, different threshold values may be potentially derived for the distinction between AD and non-AD dementia (Table 3). Hence, in this set of core analytes, the single threshold approach could be augmented by adjusting the cut-off values for Aβ42 to improve specificity without significant change in sensitivity, while doing the same for total tau and p-tau181 still demonstrated sub-optimal performance as lone biomarkers.
Table 3.
Optimal threshold values and associated diagnostic performance for each traditional CSF AD biomarker or biomarker combination in the distinction between AD and non-AD neurodegenerative disorders.
| Aβ42 | Tau | p-tau181 | Tau/Aβ42 | p-tau181/Aβ42 | |
|---|---|---|---|---|---|
| ROC AUC | 0.876 | 0.811 | 0.798 | 0.904 | 0.887 |
| Threshold value (AD vs. cognitively healthy threshold values) | 181.0 pg/mL (192 pg/mL) | 73.5 pg/mL (93 pg/mL) | 17.5 pg/mL (23 pg/mL) | 0.367 (0.39) | 0.110 (0.10) |
| Sensitivity (%) | 92.4 | 68.2 | 72.7 | 86.4 | 80.4 |
| Specificity (%) | 88.0 | 80.0 | 84.0 | 84.0 | 88.0 |
| Diagnostic Accuracy (%) | 91.2 | 71.4 | 75.8 | 85.7 | 82.4 |
To improve upon the performance of these more established CSF AD biomarkers, we analyzed the levels of novel candidate biomarkers included in the RBM Human DiscoveryMAP™ panel (hereby referred to as the MAP panel). This approach has been used for discovery of biomarkers for ovarian cancers,[3, 10] coronary artery disease,[38] Sjogren’s disease,[24] and pre-natal screening for Down syndrome.[50, 63] The MAP panel currently includes in its membership 189 analytes, and the levels of many MAP analytes have been proposed to be altered in AD when contrasted against non-AD cases[19, 29, 65, 72]. The initial version of the RBM MAP panel available to us for CSF biomarker studies included 151 analytes, although only 106 analytes had measurable levels in the CSF.[42] Among these 106 analytes, we searched for novel biomarkers which could substitute or complement the classification performance by established AD biomarkers (i.e. tau, p-tau181, and Aβ42). This is important in two regards. First, as we demonstrated above in the single-analyte approach, there is a clear trade-off between sensitivity and specificity in using the more established CSF AD biomarkers to classify between AD and non-AD cases (cognitively healthy subjects and non-AD demented cases), and one or many of the MAP analytes may improve the sensitivity or specificity of AD classification with or without the traditional CSF AD biomarkers. Second, as existing therapeutic strategies in AD largely target the molecular signature of AD, it will be important to have an independent set of biomarkers not directly linked to Aβ42 or tau metabolism as surrogate endpoints in monitoring therapeutic response. In other words, if a gamma-secretase inhibitor[30] is successful in restoring the CSF Aβ42 levels in patients clinically diagnosed with AD, restoration (partial or complete) of additional biochemical analytes altered in AD could be very useful in determining the extent of therapeutic success[64] especially if clinical measures of cognition or imaging measures of brain atrophy do not demonstrate clear disease amelioration or regression. In identifying novel MAP biomarkers, we analyzed levels of MAP analytes between autopsy-confirmed cases of AD and cognitively normal subjects, and then between autopsy-confirmed cases of AD and non-AD neurodegenerative disorders. This two-stage approach was preferred over a comparison between AD and a combined cohort of non-AD cases (cognitively healthy and demented), as the two stage approach can isolate 1) analytes useful in the identification of AD, but whose levels are intermediate between cognitively normal subjects and non-AD disorders; 2) analytes common between AD and one other group of subjects, but distinct from the third group. Univariate analysis using Mann-Whitney U-test (a non-parametric analysis was chosen because MAP analyte levels in CSF usually had non-normal distribution even after transformations) showed that multiple analytes do differ between AD and cognitively normal subjects, but only a few differ between AD and non-AD neurodegenerative disorders. This result was the first suggestion that the majority of MAP analytes likely represented common pathway elements in neurodegeneration downstream from the initial steps of pathogenesis. Indeed, as the MAP panel is biased towards a large number of peptides in inflammatory, cell signaling and apoptotic pathways that are hypothesized to be activated in both AD and non-AD disorders, altered patterns of multiple such peptides in both AD and non-AD disorders should not be surprising.
Since AD and non-AD disorders (and possibly normal aging) will activate inflammatory and apoptotic pathways, any single MAP analyte is most likely insufficient to distinguish AD from other groups in the cohort. Indeed, on a single analyte level, CSF Aβ42 outperformed any other analyte with respect to the ability to distinguish between AD and cognitively health control subjects by generating the largest area-under-the-curve (AUC) i.e. an AUC of 0.920, with total tau closely behind (AUC of 0.813, Figure 1). At the same time, 35 other analytes outperformed p-tau181 (AUC of 0.613) in the ROC curve analysis (Table 4), and platelet derived growth factor (PDGF; biological relevance to AD reviewed by us[42]) had an intermediate AUC between Aβ42 and tau. Using a cut-off value of 432 pg/ml, CSF PDGF levels are associated with a sensitivity of 84.8% and a specificity of 72.7% (Figure 1). If we replaced tau with PDGF in the traditional AD biomarker set, the PDGF/Aβ42 ratio can achieve a sensitivity of 89.4% and a specificity of 87.9%. Similar to CSF tau levels, CSF PDGF levels likely improved upon the low specificity associated with using CSF Aβ42 levels alone. As we hypothesized that elevated CSF tau levels serve as a surrogate marker of tau pathology mediated cell death, the improved specificity (against control subjects) with the introduction of PDGF levels in the diagnostic model is probably due to the distinction between cognitively normal subjects with decreased CSF Aβ42 levels and demented AD patients. When we examined this in detail, 4 of the 5 cognitively healthy subjects with low CSF Aβ42 levels had normal PDGF levels, and 3 of the 4 AD patients with normal CSF Aβ42 levels had elevated PDGF levels (78% accuracy in re-classification). In contrast, 3 of the 5 cognitively healthy subjects with low CSF Aβ42 levels had normal tau levels, and 1 of the 4 AD patients with normal CSF Aβ42 levels had elevated tau levels (44% accuracy in re-classification).
Figure 1.
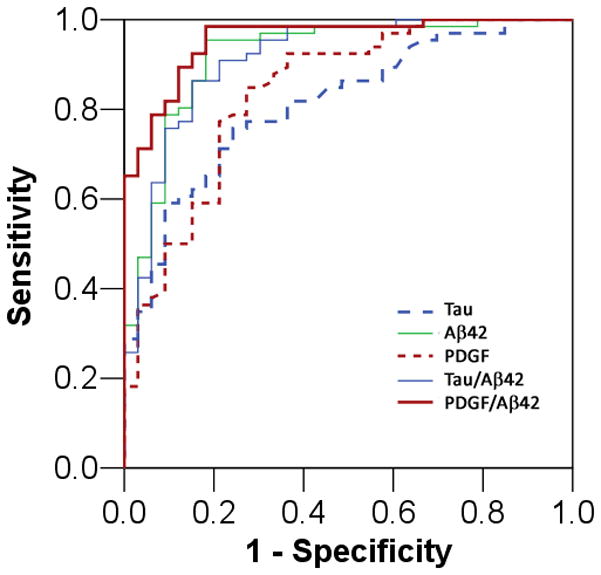
Receiver operating characteristic curve for the diagnosis of AD using a single biomarker level or the ratio of two biomarker levels.
Table 4.
AUC for traditional and novel AD biomarkers in the diagnosis of AD compared to cognitively healthy subjects. Higher levels of analytes are diagnostic of AD, except underlined analytes where lower levels are diagnostic of AD.
| Analyte | AUC |
|---|---|
| Aβ42 | 0.920 |
| PDGF | 0.839 |
| Tau | 0.813 |
| IL-1α | 0.758 |
| C3 | 0.752 |
| BMP-6 | 0.746 |
| Fabp | 0.718 |
| NrCAM | 0.701 |
| Adiponectin | 0.698 |
| Prolactin | 0.698 |
| Eotaxin-3 | 0.696 |
| IL-23 | 0.695 |
| Resistin | 0.691 |
| ThBG | 0.691 |
| Pancreatic Polypeptide | 0.682 |
| IL-7 | 0.682 |
| Myoglobin | 0.681 |
| α2macroglobulin | 0.679 |
| α1antitrypsin | 0.674 |
| Ferritin | 0.674 |
| IgA | 0.674 |
| HCC4 | 0.657 |
| SHBG | 0.656 |
| IGFBP2 | 0.654 |
| TIMP-1 | 0.653 |
| ApoH | 0.651 |
| VEGF | 0.65 |
| MIP-1α | 0.645 |
| RANTES | 0.64 |
| CgA | 0.638 |
| FAS | 0.633 |
| IgM | 0.630 |
| FGF | 0.626 |
| Thrombospondin-1 | 0.626 |
| TRAIL-R3 | 0.618 |
| Leptin | 0.617 |
| Myeloperoxidase | 0.613 |
| p-tau181 | 0.612 |
Approach 2: Core analytes, multiple thresholds
As demonstrated above, AD can be diagnosed with moderate sensitivity and specificity using single threshold values for a core panel of AD biomarkers (consisting of multiple traditional and one novel CSF biomarker). If intra- and inter-assay variability is limited, a single threshold value can be empirically determined from multi-center studies to generalize the utility of such core analytes, single threshold approach. Nevertheless, some supervised algorithm must be employed to select such thresholds for the optimization of sensitivity and specificity, given age-associated prevalence of AD within each decade of life and the purpose of such diagnostic testing (screening vs. confirmatory). There are a number of alternatives to this strategy, and two are presented in this review for their practicality. The first is to derive multiple threshold values for each biomarker of interest. For example, CSF Aβ42 levels are known for their sensitivity in predicting underlying AD pathology at some cost to specificity. However, a closer examination of the ROC reveals threshold values at which specificity is quite high despite lowered sensitivity. Whereas a threshold of 193 pg/mL is associated with 95.5% sensitivity and 81.0% specificity, a threshold of 166 pg/mL is associated with 89.7% specificity and 78.8% sensitivity. Thus, at the individual patient level, the majority (52 of the 66) of patients with autopsy-confirmed AD had CSF Aβ42 levels at 166 pg/mL or below this threshold have a positive predictive value of 94.5% for AD. An additional group of 10 patients with autopsy-confirmed AD had CSF Aβ42 levels over 166 pg/mL, but under 192 pg/mL, with a positive predictive value of 76.9%. It remains to be determined if these patients had similar degrees of AD pathology as those with lower CSF Aβ42 levels. These more intermediate CSF Aβ42 levels are also associated with less diagnostic certainty than those who met the more stringent threshold, and their clinical diagnosis may need supportive evidence from other modalities. Instead of a single threshold, a low-moderate-high likelihood scale or a probability-based score can be constructed for each potential biomarker. Such a quantitative approach can then be applied in a project-specific fashion. For example, a therapeutic trial targeting patients with highly probable AD may use CSF Aβ42 level of 166 pg/mL as the threshold, while a natural history of early AD study may use CSF Aβ42 level of 193 pg/mL as the threshold (Figure 2). The main advantage of this approach is the ability to pre-determine the specificity and positive predictive value of a biomarker-based diagnosis without introducing and refining assays for novel analytes, although this may be at the expense of diagnostic uncertainty for a subgroup of patients. To overcome the potential limitations of single analyte based strategies, we review our recent multi-analyte profiling approach in refining a biomarker-based diagnosis of neurodegenerative disorders.
Figure 2.
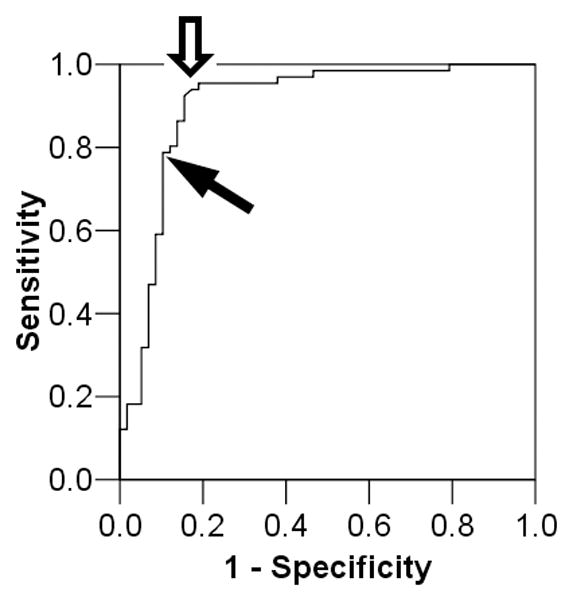
ROC curve of Aβ42 in distinguishing between AD and non-AD (cognitively healthy subjects and demented patients with non-AD neurodegenerative disorders). Empty arrow indicates typical range of Aβ42 threshold for high sensitivity with moderate specificity. Black arrow indicates alternate threshold with high specificity and moderate sensitivity.
Approach 3: Multi-analyte Profiling
Since combining traditional CSF AD biomarkers (e.g., deriving tau-to-Aβ42 ratio or a linear relationship among tau, p-tau181, and Aβ42)[55, 69] can improve the overall diagnostic accuracy over using individual component biomarkers, we hypothesized that combining multiple candidate biomarkers in combinatorial analyte profiling would improve the diagnostic performance of any individual novel biomarker. This type of approach has been used in cancer diagnosis using gene expression profiling[14, 35, 75, 81] and in one prior study of plasma biomarkers of AD.[65] A large number of classification schemes are available, including algorithms that are supervised and unsupervised,[56] and strategies that reduce the dimensionality of data through feature selection,[67] group membership with proxy features,[65, 75] tree-based approaches,[81] or a combination of the methods.[62] As biomarker identification and performance may vary according to the choice of analytical strategy due to dependence of each strategy on certain underlying assumptions (normal distribution, accuracy and precision of features, etc), we sought to determine the most optimal classification biomarkers for AD using three independent strategies in discovering novel CSF biomarkers for AD. These include feature selection using univariate analysis followed by logistic regression, a classification tree-based strategy (random forests analysis), and a nearest-shrunken centroid approach (predictive analysis of microarrays or PAM).[65, 75] Univariate analysis followed by logistic regression was included due to its common presence in the scientific literature, although it is associated with significant weakness in this instance due to the high dimensional data relative to the number of samples included. Thus, the smallest number of AD biomarkers emerged from the logistic regression model, largely due to sample size restrictions.[42] The nearest-shurnken centroid method is explained in detail by Tibshirani.[75] Briefly, it identifies analytes (genes in cancer expression profiles or proteins in our case) that are most representative of the class (e.g., AD) while eliminating analytes whose levels are more similar between classes. This approach was used by Ray et al. to identify plasma biomarkers of AD,[65] and gives more weight to analytes whose levels are stable within samples of the same class. At the same time, success in deriving differences in gene expression from transformed tissue may not necessarily translate into success in finding differences in soluble protein levels in biofluids that are/are not in close contact with the organ of interest, which in this case is the CNS (i.e. CSF versus plasma, respectively). Thus, we chose a tree-based classification strategy as our last analytical approach, as random forests analysis is less influenced by the within class variability which may be inherent to biofluid-based studies. Lastly, as these analytical approaches may differ in power in terms of identifying unique vs. shared biomarker changes and two- vs. multi-group classifiers, we separately performed two-class comparisons (AD vs. health elderly seniors, AD vs. non-AD dementia) using all three statistical approaches.
This parallel analytical approach thus permits voting of class membership (healthy elderly control, AD, non-AD dementias) both on an analyte-by-analyte basis and on an analysis-by-analysis basis to generate biomarkers with the highest likelihood of characterizing AD versus controls and non-AD subjects from a CSF perspective. When only MAP biomarkers were used, a core group of analytes were identified by multiple (two or three) analytical strategies to be useful in the distinction between AD and cognitively healthy subjects (analytes in shaded areas, Figure 3, left). Analytes determined by random forests analysis achieved 86.4% sensitivity and 81.8% specificity, in similar ranges as a model containing traditional AD biomarkers (i.e. CSF levels of total tau, p-tau181, and Aβ42) and demographic factors (age and gender). Analytes determined by PAM achieved 89.4% sensitivity and 75.8% specificity, also in similar ranges as traditional AD biomarkers plus age and gender per PAM. With the exception of the logistic regression model, long lists of MAP analytes were necessary for the most optimal classification between AD and cognitively healthy subjects (17 analytes by random forests, and 33 by PAM). Thus, if CSF tau and Aβ42 levels were altered in patients due to a therapeutic intervention of some kind such that they would no longer be available for classification purposes, these MAP analytes have the potential of maintaining the ability to distinguish between AD and cognitively healthy subjects. However, this type of modeling does not take into account the relationship between MAP biomarker levels and the levels of traditional AD biomarkers such as CSF tau and Aβ42. Thus, when we introduced these traditional AD CSF biomarkers into each classification model (logistic regression, random forests, and PAM), the improvement in classification both in terms of diagnostic accuracy and reduction of useful analytes can be visualized in the Venn diagram (Figure 3, right). First, CSF tau and Aβ42 levels were identified by all three algorithms as key CSF analytes for identifying AD cases. In addition, levels of PDGF and neuron-glia CAM-related cell adhesion molecule (NrCAM) continued to provide classification values in conjunction with CSF levels of tau and Aβ42, although the role of fatty acid binding protein (Fabp) was reduced in one algorithm (logistic regression). Similarly, many novel analytes in the MAP biomarker only model no longer contributed to the identification of AD cases, suggesting that some of the MAP biomarker combinations were likely biomarker substitutes for traditional AD biomarkers. Lastly, the number of total analytes necessary for the identification of AD was reduced in all models (especially PAM), which likely supports the notion that the majority of MAP analytes are needed to refine the classification performed by the dominant biomarkers (Aβ42, tau, PDGF, NrCAM). The combined model (MAP and traditional AD biomarkers) achieved 92.4% sensitivity and 97.0% specificity in classification by random forests, and 97.0% sensitivity and 87.9% specificity in classification by PAM.
Figure 3.
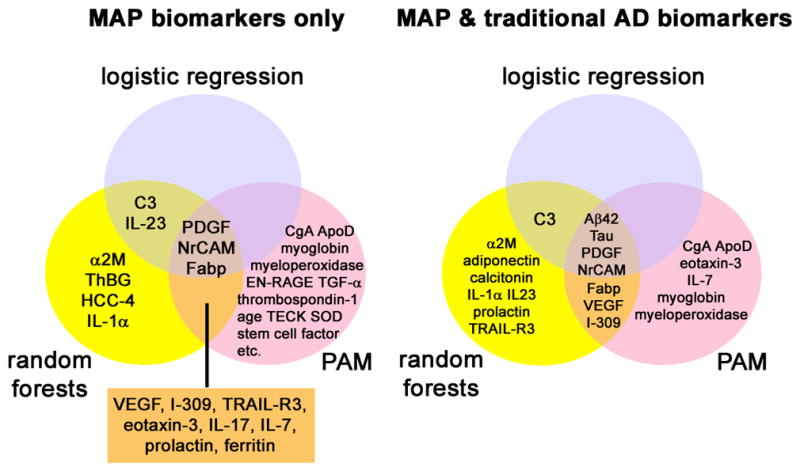
Analytes determined to be useful in the classification between AD and cognitively healthy subjects by one or more analytical algorithms (logistic regression, random forests, or PAM) when only MAP biomarkers are used (left) or when MAP biomarkers and traditional AD biomarkers are used (right). Age and gender were included in all models.
To better understand how MAP analytes improve the distinction between cognitively healthy subjects and AD, we analyzed PDGF levels according to CSF Aβ42 and tau categories using threshold values determined in this review (Figure 4). As we previously demonstrated, low CSF Aβ42 levels identified the majority of AD, while 13 cases were misclassified based on CSF Aβ42 alone. Using elevated tau levels (red circles in Figure 4) in addition to CSF Aβ42 levels did not significantly alter the outcome, as there was a trade-off between increased sensitivity and decreased specificity. Elevated PDGF levels were more specific than elevated tau levels to correctly identify those with autopsy-confirmed AD but normal CSF Aβ42 levels (Figure 4). In fact, when we analyzed the relative levels of the MAP analytes in these 13 misclassified subjects next to tau levels alone (Figure 5), it was apparent that coupled changes in MAP biomarkers could better correctly re-classify autopsy-confirmed AD cases with normal CSF Aβ42 levels than using a tau threshold alone. At the same time, multiple cases of cognitively healthy subjects had low CSF Aβ42 levels and MAP biomarker patterns suggestive of AD. As CSF biomarker patterns can change long before symptomatic onset, alterations in MAP biomarkers other than tau provide possible support that these cognitively healthy subjects may be at increased risk for future cognitive symptoms.
Figure 4.
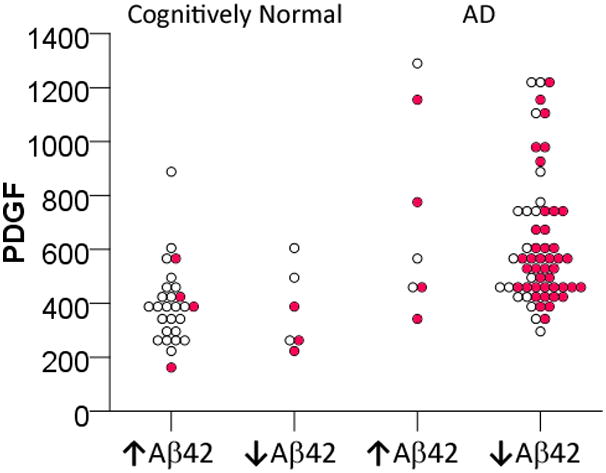
PDGF levels of cognitively normal subjects and AD patients according to their Aβ42 levels (↑Aβ42: Aβ42 levels > 181 pg/mL; ↓Aβ42: Aβ42 levels ≤ 181 pg/mL). Mean and SD values of cognitively normal subjects are 256.29 and 33.96 pg/mL for ↑Aβ42, and 154.38 and 19.31 pg/mL for ↓Aβ42; mean and SD values of AD patients are 205.66 and 35.92 pg/mL for ↑Aβ42, and 134.24 and 26.82 pg/mL for ↓Aβ42. Red circles represent cases in which CSF tau levels ≥ 73.5 pg/mL.
Figure 5.
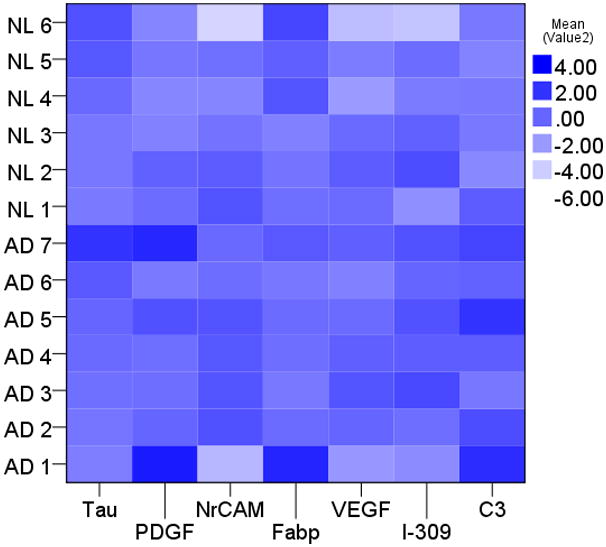
Relative levels of tau and MAP biomarker levels in 13 cases misclassified by CSF Aβ42 levels. A darker shade indicates more similar to the larger cohort of autopsy-confirmed AD.
Compared to the core analyte approaches (with single or multiple thresholds), the combinatorial MAP approach is more tolerant of analytes in the borderline ranges and analytes with larger CVs, as the eventual class membership depends more on each sample’s composite profile (and its neighbors) than the absolute relationship between a single analyte’s level and a cut-off value. Levels of multiple analytes can be measured simultaneously, as a fixed amount of assay volume is mixed with multiple types of beads each carrying specific antibodies. The disadvantages include the more sophisticated equipment and the necessity to develop multiple assays, which can be costly and time consuming. While individual investigators may weigh the disadvantages of a MAP approach against those associated with the threshold-approach using established targets and assays (such as Aβ42), a MAP approach is clearly superior to the single analyte approach in biomarker discovery as we discuss below.
FRONTOTEMPORAL LOBAR DEGENERATIONS
The distinction between AD and non-AD neurodegenerative disorders is a key component in the translation of AD biomarkers into clinical practice. The current use of traditional AD biomarkers in the CSF comes up short in generating a complete clinicopathologic relationship if the initial biomarker profile is not consistent with AD. For example, patients with normal cognition, depression, DLB, and FTLD can all have a negative CSF AD biomarker profile, and additional biomarkers are necessary for the further classification of patients with a negative AD profile. To this end, we extended our analysis of MAP biomarkers in AD to include patients with neurodegenerative disorders of known pathology. Due to the long-standing interest in FTLD,[31, 37, 60] 23 of the 25 patients with non-AD pathology had one of two FTLD subtypes, including 14 patients with FTLD and TDP-immunoreactive lesions (FTLD-TDP),[60] and 9 patients with FTLD and tau-immunoreactive lesions (FTLD-Tau).[18] When we repeated MAP analysis (using all three strategies described above) to distinguish between AD and non-AD neurodegenerative disorders, we identified p-tau181 (instead of total tau), Aβ42, and agouti-related peptide (AgRP) as useful classifying analytes by all three algorithms. While Aβ42 and p-tau181 are expected to improve the distinction between AD and non-AD disorders, the role of AgRP in this classification was not intuitive. One possible explanation is that all non-AD disorders shared a profile of AgRP levels unique from the profile of AD. As AgRP was not an analyte that differed in levels between AD and cognitively healthy subjects, AgRP levels would then be hypothesized to be altered in one or more non-AD disorders. When we examined AgRP levels in greater detail, it was found that AgRP levels were significantly elevated in a high proportion of FTLD-TDP cases, while elevated only in a small proportion of FTLD-Tau cases. Since clinical ante-mortem distinction between FTLD-TDP and FTLD-Tau cases is extremely challenging despite group-level phenotype-pathology correlation, we sought to determine if MAP analysis could generate analytes that can be clinically and biologically meaningful in FTLD.
Instead of a three-prong approach, we analyzed the CSF data from the two FTLD subgroups using Mann-Whitney univariate analysis (the overall sample size was too small for regression) and random forests as the small group size was a training challenge to PAM.[43] Perhaps not surprisingly, CSF Aβ42 levels did not differ in levels between the two FTLD groups. In addition, CSF tau levels were similar between the two FTLD groups, despite the tau-associated pathology in FTLD-Tau. The normal CSF tau levels in FTLD-Tau cases may reflect differential tau phosphorylation patterns and thus CSF tau solubility.[78] Aside from AgRP, 4 analytes were identified as putative markers including adrenocorticotropic hormone (ACTH), eotaxin-3, Fas, and interleukin 17 (IL-17) by both statistical methods. To the best of our knowledge, prior work on CSF or plasma biomarkers of FTLD subtypes only identified plasma TDP-43 levels to be altered in some patients with clinically diagnosed FTLD (and a smaller proportion of patients clinically diagnosed with AD),[32] and CSF TDP-43 levels to be increased in patients with clinically diagnosed amyotrophic lateral sclerosis (ALS).[71] While little is known about the biology of the candidate FTLD biomarkers in either FTLD subtype described here, we made a number of observations based on coupled changes in peptide levels. First, ACTH and AgRP were both elevated in FTLD-TDP compared to FTLD-Tau, and their common hypothalamic origin raises the possibility of hypothalamic dysfunction in FTLD-TDP. Second, along with IL-17, IL-23 levels also differed between FTLD-TDP and FTLD-Tau. IL-23 is the upstream effector that induces the differentiation of IL-17 secreting T-cells,[4] thus a paralleled change in IL-23 and IL-17 provides biological plausibility that this particular pathway is altered in FTLD-TDP. Lastly, as an example of two discovery studies that can mutually support the findings in each, angiopoetin-2 peptide was found to increase in FTLD-TDP relative to FTLD-Tau, while angiopoetin-1 mRNA was found to be increased in FTLD-TDP brain tissue.[20] Overall, the MAP-based discovery approach allowed the identification of putative biomarkers that can provide antemortem distinction between FTLD-TDP and FTLD-Tau, and analytes – both those that improve classification or only differ in levels – that may be biologically significant in the pathogenesis of these neurodegenerative disorders. As levels of these and other biomarkers differed between FTLD-TDP cases with clinical ALS and ALS cases without cognitive impairment (Hu, unpublished observation), it is possible that biomarkers for FTLD-TDP may reflect region-specific vulnerability to TDP-associated pathology. Furthermore, these biomarkers may thus be associated with the development of more diffuse brain pathology and dementia in ALS. While this study is currently on-going, two studies analyzing Parkinson’s patients and the development of cognitive impairment will illustrate our point.
PARKINSON’S DISEASE
Cognitive impairment (including dementia and milder forms of decline) can occur in patients with Parkinson’s disease (PD), and some estimates suggest that the lifetime prevalence of cognitive impairment in PD approaches 80%.[1, 17, 40] While certain clinical features have been identified as predictors of cognitive decline in some studies,[73, 77] effect sizes are generally small and it is difficult to see how these group-level indicators can be used on the individual patient’s level. In addition, the pathologic substrate for cognitive impairment in PD is not entirely clearly. One potential possibility is that cognitive impairment and dementia occur as a late consequence of PD due to extensive involvement of α-synuclein pathology. An alternative explanation may be that PD patients develop dementia through an AD-like pathogenic process, for which they may be at increased risk compared to the general population. These two potential mechanisms are by no means mutually exclusive and may occur in subsets of PD, or even within the same individuals (Figure 6).
Figure 6.

Overlap between pathology related to Parkinson’s disease (PD) and Alzheimer’s disease (AD) in biomarker discovery for Parkinson’s disease dementia (PDD) and dementia with Lewy bodies (DLB). A subset of patients with PDD/DLB have CSF biomarkers consistent with AD (area 1), while a second subset of patients with PDD/DLB do not have alterations in CSF AD biomarkers (area 2).
Evidence for the first possibility comes from observations of altered CSF levels of α-synuclein in individuals with various clinical syndromes characterized neuropathologically by accumulations of α-synuclein. For example, in patients clinically diagnosed with dementia with Lewy Bodies[49] and in PD with or without dementia,[57] CSF α-synuclein may be decreased relative to normal controls. However, reports for CSF α-synuclein as a biomarker of PD or dementia related to PD have been conflicting,[61] but the search for PD-specific biomarkers of cognitive impairment is still in its infancy.
Evidence for the second possibility comes from numerous studies demonstrating an AD-like CSF profile in PD dementia (PDD) and clinical dementia with Lewy bodies (for review of diagnostic criteria, see review by Lippa and colleagues[53]). In one study, patients with clinically diagnosed DLB or PDD had lower mean CSF Aβ42 levels than cognitively healthy subjects,[12] and a threshold-based approach may distinguish between AD, DLB, and PDD. A more recent cross-sectional study compared the CSF levels of traditional AD CSF tau and Aβ42 biomarkers between PD patients with and without dementia, and found that PDD patients as a group had higher tau levels and lower Aβ42 levels than cognitively healthy subjects and PD patients without dementia, although there was significant overlap in the Aβ42 levels between PD patients with and without dementia.[23] While these cross-sectional studies are highly suggestive that alterations in the CSF levels of AD-related peptides – and possibly AD pathology – may play an important role in cognitive decline for PD patients, they do not address the question of whether altered CSF patterns of traditional AD biomarkers predicted subsequent cognitive decline in individual PD patients overtime. A longitudinal study is necessary to correlate the level of traditional CSF AD biomarkers with cognitive change on the individual level.
To address this issue, Siderowf and colleagues from the UPenn Udall Center of Excellence for Parkinson’s Disease Research performed such a study.[70] In 45 patients who underwent CSF collection (mean disease duration 11 years) followed by longitudinal neuropsychological characterization (mean follow-up time 1.5 years), those with low CSF Aβ42 levels (≤ 192 pg/mL) had significantly greater cognitive decline over time than those with normal CSF Aβ42 levels. This trend persisted whether the model was unadjusted or adjusted for age, disease duration and baseline Hoehn and Yahr stage. At the same time, total tau and p-tau181 levels did not seem to correlate with rates of longitudinal cognitive decline, although the sample size may have limited the statistical power to discover any such association. Therefore, CSF Aβ42 levels in the range of pathologically-confirmed AD may predict subsequent cognitive decline within a non-demented PD population, although detailed clinicopathologic analysis will be necessary to determine whether an AD-like CSF profile is indicative of cognitive impairment by the development of AD pathology, and whether such a profile can differentiate those who develop PDD due to pure α-synuclein pathology vs. those who developed PD and then AD. Future studies exploring non-AD related biomarkers of cognitive decline can take advantage of the multi-analyte profiling approach we discussed above targeting two potential types of candidate biomarkers: those that are altered in PD patients with dementia regardless of cause (such as PDGF or NrCAM), and those that confer specificity to the pathologic substrate (amyloid, α-synuclein, or both).
FUTURE DIRECTION
Standardized Diagnostic Algorithm
We have now completed analysis in a number of projects associated with the multiple neurodegenerative disorder MAP approach, including diagnosis of AD by CSF, differential diagnosis between FTLD-TDP, and identification of those with PD at risk for cognitive decline. A number of additional projects are underway, including the single-center plasma-based biomarker diagnosis of AD, multi-center plasma-based biomarker diagnosis of AD in conjunction with Washington University at St. Louis[27, 28, 58] and the Australian Imaging Biomarkers and Lifestyle (AIBL) Study[25, 54], and CSF predictor of cognitive decline in ALS[46] among others. The goal of these discovery-phase studies is to identify candidate biomarkers that can reliably be measured across centers and used to distinguish clinically useful entities (with pathologic confirmation), while the diagnostic performance should be validated in large multi-center studies such as North American ADNI[76] and the European ADNI,[16] adjusting for important demographic and other factors that may influence the level of each biomarker, including age, gender, ApoE alleles, and neurological and systemic co-morbidities. As AD remains the most common disorder and biomarkers for AD represent the most mature analytes in this collection of candidate biomarkers, we propose that an age- and ApoE-based diagnostic evaluation be first performed to determine the likelihood that AD pathology is present in sufficient quantity to account for the clinical symptoms. Other biomarkers such as PDGF, NrCAM, or C3 can be used in conjunction to potentially distinguish between pre-symptomatic and symptomatic AD, although more work is necessary to clarify the significance of co-existing (“minor”) AD pathology in other disorders (DLB, FTLD-TDP, FTLD-Tau) and their relationship to CSF patterns of AD biomarkers. A number of the false-positive cases in our cohort with known pathology had a non-AD disorder as the dominant pathology but also neuritic plaques and neurofibrillary tangles that in the experienced neuropatholgists’ opinion likely did not contribute to the global neurodegeneration and cognitive decline, and this suggests that traditional AD CSF tau and Aβ42 biomarkers may be altered in cases of diffuse sparse AD pathology or dense focal AD pathology. This phenomenon is in keeping with the alteration of traditional CSF AD biomarkers prior to onset of clinical symptoms due to AD,[27, 28, 39, 48, 74] and we propose that positive biomarkers for each main class of pathology (AD, FTLD-TDP, FTLD-Tau, DLB) are necessary to identify all potential pathologic changes present in a cognitive impaired individual. In other words, while elevated levels of AgRP and ACTH are useful in distinguishing FTLD-TDP cases from FTLD-Tau cases, FTLD-Tau should not remain a diagnosis-by-exclusion and there persists the need for biomarkers that positively identify FTLD-Tau. Similarly, given the significant clinical and pathologic overlap between AD, DLB, and PDD, biomarkers are also needed to positively identify Lewy body pathology despite the apparent usefulness of AD biomarkers. Future novel biomarkers will likely come from both hypothesis-driven[49, 57] and discovery-based approaches,[2, 82] and success in both strategies may be necessary to positively identify the main neurodegenerative disorders while keeping in mind neurological mimickers such as Creutzfeldt-Jakob disease[8, 51] and HIV subjects with dementia[22] or opportunistic infections.[34]
Beyond Diagnostic Classification
Another important direction in biomarker work centers around the topic of prognosis. Traditional CSF AD biomarkers may predict decline in cognitively normal subjects at the group level,[28] although accurate prognosis at the individual level remains difficult. In our effort to identify CSF MAP biomarkers for AD, we also identified thymus-expressed chemokine (TECK; also known as CCL25) as a biomarker whose level is associated with rate of decline in patients diagnosed with mild cognitive impairment. Interestingly, TECK itself offered little value in classification between AD and cognitively healthy subjects and predicting rates of decline in moderate to severe AD, suggesting that certain analytes may offer stage-specific value in diagnosis, prognosis, or both. While low CSF Aβ42 levels are associated with future cognitive decline in non-demented subjects, the question can be raised as to whether this approach merely identifies patients with pre-symptomatic AD who are closest to the conversion from their current cognitive state to early AD. In our studies, longitudinal analyses centered around individual patients’ rates of decline identified analytes different from those selected by a conversion or stage-based approach. This raises the possibility that existing and future biomarker panels can potentially predict individual patients’ cognitive and functional decline over time, most likely through profiling the relative proportion of neuropathology, protective and detrimental inflammatory responses, and biological indicators of reserve. This type of biomarker profiling should represent a significant step forward from epidemiology-based prognostication in current clinical practice, and may be essential in selecting the appropriate patients for approved or experimental therapies. When combined with other clinical measures such as neuropsychological and atrophy analysis,[7, 59, 80] such MAP analysis may eventually serve as a virtual brain biopsy to derive multi-dimensional clinicopathologic data for each patient.
References
- 1.Aarsland D, Andersen K, Larsen JP, Lolk A, Kragh-Sorensen P. Prevalence and characteristics of dementia in Parkinson disease: an 8-year prospective study. Arch Neurol. 2003;60:387–92. doi: 10.1001/archneur.60.3.387. [DOI] [PubMed] [Google Scholar]
- 2.Abdi F, Quinn JF, Jankovic J, et al. Detection of biomarkers with a multiplex quantitative proteomic platform in cerebrospinal fluid of patients with neurodegenerative disorders. J Alzheimers Dis. 2006;9:293–348. doi: 10.3233/jad-2006-9309. [DOI] [PubMed] [Google Scholar]
- 3.Amonkar SD, Bertenshaw GP, Chen TH, et al. Development and preliminary evaluation of a multivariate index assay for ovarian cancer. PLoS One. 2009;4:e4599. doi: 10.1371/journal.pone.0004599. [DOI] [PMC free article] [PubMed] [Google Scholar]
- 4.Annunziato F, Cosmi L, Liotta F, Maggi E, Romagnani S. Type 17 T helper cells-origins, features and possible roles in rheumatic disease. Nat Rev Rheumatol. 2009;5:325–31. doi: 10.1038/nrrheum.2009.80. [DOI] [PubMed] [Google Scholar]
- 5.The National Institute on Aging, and Reagan Institute Working Group on Diagnostic Criteria for the Neuropathological Assessment of Alzheimer’s Disease. Consensus recommendations for the postmortem diagnosis of Alzheimer’s disease. Neurobiol Aging. 1997;18:S1–2. [PubMed] [Google Scholar]
- 6.APA. DSM-5: The Future of Psychaitric Diagnosis. 2010. [Google Scholar]
- 7.Apostolova LG, Hwang KS, Andrawis JP, et al. 3D PIB and CSF biomarker associations with hippocampal atrophy in ADNI subjects. Neurobiol Aging. 2010 doi: 10.1016/j.neurobiolaging.2010.05.003. [DOI] [PMC free article] [PubMed] [Google Scholar]
- 8.Bahl JM, Heegaard NH, Falkenhorst G, et al. The diagnostic efficiency of biomarkers in sporadic Creutzfeldt-Jakob disease compared to Alzheimer’s disease. Neurobiol Aging. 2009;30:1834–41. doi: 10.1016/j.neurobiolaging.2008.01.013. [DOI] [PubMed] [Google Scholar]
- 9.Bergmann L. The value of CSF-analysis in the diagnosis of MS. Acta Neurol Scand Suppl. 1965;13:559–61. doi: 10.1111/j.1600-0404.1965.tb01930.x. [DOI] [PubMed] [Google Scholar]
- 10.Bertenshaw GP, Yip P, Seshaiah P, et al. Multianalyte profiling of serum antigens and autoimmune and infectious disease molecules to identify biomarkers dysregulated in epithelial ovarian cancer. Cancer Epidemiol Biomarkers Prev. 2008;17:2872–81. doi: 10.1158/1055-9965.EPI-08-0464. [DOI] [PubMed] [Google Scholar]
- 11.Bian H, Van Swieten JC, Leight S, et al. CSF biomarkers in frontotemporal lobar degeneration with known pathology. Neurology. 2008;70:1827–35. doi: 10.1212/01.wnl.0000311445.21321.fc. [DOI] [PMC free article] [PubMed] [Google Scholar]
- 12.Bibl M, Mollenhauer B, Esselmann H, et al. CSF amyloid-beta-peptides in Alzheimer’s disease, dementia with Lewy bodies and Parkinson’s disease dementia. Brain. 2006;129:1177–87. doi: 10.1093/brain/awl063. [DOI] [PMC free article] [PubMed] [Google Scholar]
- 13.Brookmeyer R, Johnson E, Ziegler-Graham K, Arrighi HM. Forecasting the global burden of Alzheimer’s disease. Alzheimers Dement. 2007;3:186–91. doi: 10.1016/j.jalz.2007.04.381. [DOI] [PubMed] [Google Scholar]
- 14.Brown MP, Grundy WN, Lin D, et al. Knowledge-based analysis of microarray gene expression data by using support vector machines. Proc Natl Acad Sci U S A. 2000;97:262–7. doi: 10.1073/pnas.97.1.262. [DOI] [PMC free article] [PubMed] [Google Scholar]
- 15.Buerger K, Ewers M, Pirttila T, et al. CSF phosphorylated tau protein correlates with neocortical neurofibrillary pathology in Alzheimer’s disease. Brain. 2006;129:3035–41. doi: 10.1093/brain/awl269. [DOI] [PubMed] [Google Scholar]
- 16.Buerger K, Frisoni G, Uspenskaya O, et al. Validation of Alzheimer’s disease CSF and plasma biological markers: the multicentre reliability study of the pilot European Alzheimer’s Disease Neuroimaging Initiative (E-ADNI) Exp Gerontol. 2009;44:579–85. doi: 10.1016/j.exger.2009.06.003. [DOI] [PubMed] [Google Scholar]
- 17.Buter TC, van den Hout A, Matthews FE, Larsen JP, Brayne C, Aarsland D. Dementia and survival in Parkinson disease: a 12-year population study. Neurology. 2008;70:1017–22. doi: 10.1212/01.wnl.0000306632.43729.24. [DOI] [PubMed] [Google Scholar]
- 18.Cairns NJ, Bigio EH, Mackenzie IR, et al. Neuropathologic diagnostic and nosologic criteria for frontotemporal lobar degeneration: consensus of the Consortium for Frontotemporal Lobar Degeneration. Acta Neuropathol. 2007;114:5–22. doi: 10.1007/s00401-007-0237-2. [DOI] [PMC free article] [PubMed] [Google Scholar]
- 19.Castano EM, Roher AE, Esh CL, Kokjohn TA, Beach T. Comparative proteomics of cerebrospinal fluid in neuropathologically-confirmed Alzheimer’s disease and non-demented elderly subjects. Neurol Res. 2006;28:155–63. doi: 10.1179/016164106X98035. [DOI] [PubMed] [Google Scholar]
- 20.Chen-Plotkin AS, Geser F, Plotkin JB, et al. Variations in the progranulin gene affect global gene expression in frontotemporal lobar degeneration. Hum Mol Genet. 2008;17:1349–62. doi: 10.1093/hmg/ddn023. [DOI] [PMC free article] [PubMed] [Google Scholar]
- 21.Clark CM, Xie S, Chittams J, et al. Cerebrospinal fluid tau and beta-amyloid: how well do these biomarkers reflect autopsy-confirmed dementia diagnoses? Arch Neurol. 2003;60:1696–702. doi: 10.1001/archneur.60.12.1696. [DOI] [PubMed] [Google Scholar]
- 22.Clifford DB, Fagan AM, Holtzman DM, et al. CSF biomarkers of Alzheimer disease in HIV-associated neurologic disease. Neurology. 2009;73:1982–7. doi: 10.1212/WNL.0b013e3181c5b445. [DOI] [PMC free article] [PubMed] [Google Scholar]
- 23.Compta Y, Marti MJ, Ibarretxe-Bilbao N, et al. Cerebrospinal tau, phospho-tau, and beta-amyloid and neuropsychological functions in Parkinson’s disease. Mov Disord. 2009;24:2203–10. doi: 10.1002/mds.22594. [DOI] [PubMed] [Google Scholar]
- 24.Delaleu N, Immervoll H, Cornelius J, Jonsson R. Biomarker profiles in serum and saliva of experimental Sjogren’s syndrome: associations with specific autoimmune manifestations. Arthritis Res Ther. 2008;10:R22. doi: 10.1186/ar2375. [DOI] [PMC free article] [PubMed] [Google Scholar]
- 25.Ellis KA, Bush AI, Darby D, et al. The Australian Imaging, Biomarkers and Lifestyle (AIBL) study of aging: methodology and baseline characteristics of 1112 individuals recruited for a longitudinal study of Alzheimer’s disease. Int Psychogeriatr. 2009;21:672–87. doi: 10.1017/S1041610209009405. [DOI] [PubMed] [Google Scholar]
- 26.Engelborghs S, Sleegers K, Cras P, et al. No association of CSF biomarkers with APOEepsilon4, plaque and tangle burden in definite Alzheimer’s disease. Brain. 2007;130:2320–6. doi: 10.1093/brain/awm136. [DOI] [PubMed] [Google Scholar]
- 27.Fagan AM, Mintun MA, Shah AR, et al. Cerebrospinal fluid tau and ptau(181) increase with cortical amyloid deposition in cognitively normal individuals: implications for future clinical trials of Alzheimer’s disease. EMBO Mol Med. 2009;1:371–80. doi: 10.1002/emmm.200900048. [DOI] [PMC free article] [PubMed] [Google Scholar]
- 28.Fagan AM, Roe CM, Xiong C, Mintun MA, Morris JC, Holtzman DM. Cerebrospinal fluid tau/beta-amyloid(42) ratio as a prediction of cognitive decline in nondemented older adults. Arch Neurol. 2007;64:343–9. doi: 10.1001/archneur.64.3.noc60123. [DOI] [PubMed] [Google Scholar]
- 29.Finehout EJ, Franck Z, Choe LH, Relkin N, Lee KH. Cerebrospinal fluid proteomic biomarkers for Alzheimer’s disease. Ann Neurol. 2007;61:120–9. doi: 10.1002/ana.21038. [DOI] [PubMed] [Google Scholar]
- 30.Fleisher AS, Raman R, Siemers ER, et al. Phase 2 safety trial targeting amyloid beta production with a gamma-secretase inhibitor in Alzheimer disease. Arch Neurol. 2008;65:1031–8. doi: 10.1001/archneur.65.8.1031. [DOI] [PMC free article] [PubMed] [Google Scholar]
- 31.Forman MS, Farmer J, Johnson JK, et al. Frontotemporal dementia: clinicopathological correlations. Ann Neurol. 2006;59:952–62. doi: 10.1002/ana.20873. [DOI] [PMC free article] [PubMed] [Google Scholar]
- 32.Foulds P, McAuley E, Gibbons L, et al. TDP-43 protein in plasma may index TDP-43 brain pathology in Alzheimer’s disease and frontotemporal lobar degeneration. Acta Neuropathol. 2008;116:141–6. doi: 10.1007/s00401-008-0389-8. [DOI] [PMC free article] [PubMed] [Google Scholar]
- 33.Fujishiro H, Ferman TJ, Boeve BF, et al. Validation of the neuropathologic criteria of the third consortium for dementia with Lewy bodies for prospectively diagnosed cases. J Neuropathol Exp Neurol. 2008;67:649–56. doi: 10.1097/NEN.0b013e31817d7a1d. [DOI] [PMC free article] [PubMed] [Google Scholar]
- 34.Gisslen M, Krut J, Andreasson U, et al. Amyloid and tau cerebrospinal fluid biomarkers in HIV infection. BMC Neurol. 2009;9:63. doi: 10.1186/1471-2377-9-63. [DOI] [PMC free article] [PubMed] [Google Scholar]
- 35.Golub TR, Slonim DK, Tamayo P, et al. Molecular classification of cancer: class discovery and class prediction by gene expression monitoring. Science. 1999;286:531–7. doi: 10.1126/science.286.5439.531. [DOI] [PubMed] [Google Scholar]
- 36.Gray H. History of lumbar puncture (rachicentesis) Arch Neurol and Psychiatry. 1912;6:61–9. [Google Scholar]
- 37.Grossman M, Farmer J, Leight S, et al. Cerebrospinal fluid profile in frontotemporal dementia and Alzheimer’s disease. Ann Neurol. 2005;57:721–9. doi: 10.1002/ana.20477. [DOI] [PubMed] [Google Scholar]
- 38.Gurbel PA, Kreutz RP, Bliden KP, DiChiara J, Tantry US. Biomarker analysis by fluorokine multianalyte profiling distinguishes patients requiring intervention from patients with long-term quiescent coronary artery disease: a potential approach to identify atherosclerotic disease progression. Am Heart J. 2008;155:56–61. doi: 10.1016/j.ahj.2007.08.021. [DOI] [PubMed] [Google Scholar]
- 39.Gustafson DR, Skoog I, Rosengren L, Zetterberg H, Blennow K. Cerebrospinal fluid beta-amyloid 1–42 concentration may predict cognitive decline in older women. J Neurol Neurosurg Psychiatry. 2007;78:461–4. doi: 10.1136/jnnp.2006.100529. [DOI] [PMC free article] [PubMed] [Google Scholar]
- 40.Hely MA, Reid WG, Adena MA, Halliday GM, Morris JG. The Sydney multicenter study of Parkinson’s disease: the inevitability of dementia at 20 years. Mov Disord. 2008;23:837–44. doi: 10.1002/mds.21956. [DOI] [PubMed] [Google Scholar]
- 41.Hodges JR, Davies RR, Xuereb JH, et al. Clinicopathological correlates in frontotemporal dementia. Ann Neurol. 2004;56:399–406. doi: 10.1002/ana.20203. [DOI] [PubMed] [Google Scholar]
- 42.Hu WT, Chen-Plotkin A, Arnold SE, et al. Novel CSF biomarkers for Alzheimer’s disease and mild cognitive impairment. Acta Neuropathol. 2010;119:669–78. doi: 10.1007/s00401-010-0667-0. [DOI] [PMC free article] [PubMed] [Google Scholar]
- 43.Hu WT, Chen-Plotkin A, Grossman M, et al. Novel CSF biomarkers for frontotemporal lobar degenerations. Neurology. 2010 doi: 10.1212/WNL.0b013e318200d78d. in press. [DOI] [PMC free article] [PubMed] [Google Scholar]
- 44.Hu WT, Mandrekar JN, Parisi JE, et al. Clinical features of pathologic subtypes of behavioral--variant frontotemporal dementia. Arch Neurol. 2007;64:1611–6. doi: 10.1001/archneur.64.11.1611. [DOI] [PubMed] [Google Scholar]
- 45.Hu WT, McMillan C, Libon DJ, et al. Multi-modal predictors for Alzheimer’s disease in non-fluent primary progressive aphasia. Neurology. 2010 doi: 10.1212/WNL.0b013e3181ed9c52. in press. [DOI] [PMC free article] [PubMed] [Google Scholar]
- 46.Hu WT, Seelaar H, Josephs KA, et al. Survival profiles of patients with frontotemporal dementia and motor neuron disease. Arch Neurol. 2009;66:1359–64. doi: 10.1001/archneurol.2009.253. [DOI] [PMC free article] [PubMed] [Google Scholar]
- 47.Innogenetics. INNO-BIA AlzBio3.
- 48.Jack CR, Jr, Knopman DS, Jagust WJ, et al. Hypothetical model of dynamic biomarkers of the Alzheimer’s pathological cascade. Lancet Neurol. 2010;9:119–28. doi: 10.1016/S1474-4422(09)70299-6. [DOI] [PMC free article] [PubMed] [Google Scholar]
- 49.Kasuga K, Tokutake T, Ishikawa A, et al. Differential levels of alpha-synuclein, beta-amyloid42 and tau in CSF between patients with dementia with Lewy bodies and Alzheimer’s disease. J Neurol Neurosurg Psychiatry. 2010;81:608–10. doi: 10.1136/jnnp.2009.197483. [DOI] [PubMed] [Google Scholar]
- 50.Koster MP, Pennings JL, Imholz S, et al. Bead-based multiplexed immunoassays to identify new biomarkers in maternal serum to improve first trimester Down syndrome screening. Prenat Diagn. 2009;29:857–62. doi: 10.1002/pd.2294. [DOI] [PubMed] [Google Scholar]
- 51.Ladogana A, Sanchez-Juan P, Mitrova E, et al. Cerebrospinal fluid biomarkers in human genetic transmissible spongiform encephalopathies. J Neurol. 2009;256:1620–8. doi: 10.1007/s00415-009-5163-x. [DOI] [PMC free article] [PubMed] [Google Scholar]
- 52.Lewczuk P, Beck G, Ganslandt O, et al. International quality control survey of neurochemical dementia diagnostics. Neurosci Lett. 2006;409:1–4. doi: 10.1016/j.neulet.2006.07.009. [DOI] [PubMed] [Google Scholar]
- 53.Lippa CF, Duda JE, Grossman M, et al. DLB and PDD boundary issues: diagnosis, treatment, molecular pathology, and biomarkers. Neurology. 2007;68:812–9. doi: 10.1212/01.wnl.0000256715.13907.d3. [DOI] [PubMed] [Google Scholar]
- 54.Lui JK, Laws SM, Li QX, et al. Plasma Amyloid-beta as a Biomarker in Alzheimer’s Disease: The AIBL Study of Aging. J Alzheimers Dis. 2010 doi: 10.3233/JAD-2010-090249. [DOI] [PubMed] [Google Scholar]
- 55.Mattsson N, Zetterberg H, Hansson O, et al. CSF biomarkers and incipient Alzheimer disease in patients with mild cognitive impairment. Jama. 2009;302:385–93. doi: 10.1001/jama.2009.1064. [DOI] [PubMed] [Google Scholar]
- 56.Miller DJ, Wang Y, Kesidis G. Emergent unsupervised clustering paradigms with potential application to bioinformatics. Front Biosci. 2008;13:677–90. doi: 10.2741/2711. [DOI] [PubMed] [Google Scholar]
- 57.Mollenhauer B, Cullen V, Kahn I, et al. Direct quantification of CSF alpha-synuclein by ELISA and first cross-sectional study in patients with neurodegeneration. Exp Neurol. 2008;213:315–25. doi: 10.1016/j.expneurol.2008.06.004. [DOI] [PubMed] [Google Scholar]
- 58.Morris JC, Roe CM, Xiong C, et al. APOE predicts amyloid-beta but not tau Alzheimer pathology in cognitively normal aging. Ann Neurol. 2010;67:122–31. doi: 10.1002/ana.21843. [DOI] [PMC free article] [PubMed] [Google Scholar]
- 59.Nettiksimmons J, Harvey D, Brewer J, et al. Subtypes based on cerebrospinal fluid and magnetic resonance imaging markers in normal elderly predict cognitive decline. Neurobiol Aging. 2010 doi: 10.1016/j.neurobiolaging.2010.04.025. [DOI] [PMC free article] [PubMed] [Google Scholar]
- 60.Neumann M, Kwong LK, Lee EB, et al. Phosphorylation of S409/410 of TDP-43 is a consistent feature in all sporadic and familial forms of TDP-43 proteinopathies. Acta Neuropathol. 2009;117:137–49. doi: 10.1007/s00401-008-0477-9. [DOI] [PMC free article] [PubMed] [Google Scholar]
- 61.Ohrfelt A, Grognet P, Andreasen N, et al. Cerebrospinal fluid alpha-synuclein in neurodegenerative disorders-a marker of synapse loss? Neurosci Lett. 2009;450:332–5. doi: 10.1016/j.neulet.2008.11.015. [DOI] [PubMed] [Google Scholar]
- 62.Pang H, Zhao H. Building pathway clusters from Random Forests classification using class votes. BMC Bioinformatics. 2008;9:87. doi: 10.1186/1471-2105-9-87. [DOI] [PMC free article] [PubMed] [Google Scholar]
- 63.Pennings JL, Koster MP, Rodenburg W, Schielen PC, de Vries A. Discovery of novel serum biomarkers for prenatal Down syndrome screening by integrative data mining. PLoS One. 2009;4:e8010. doi: 10.1371/journal.pone.0008010. [DOI] [PMC free article] [PubMed] [Google Scholar]
- 64.Portelius E, Dean RA, Gustavsson MK, et al. A novel Abeta isoform pattern in CSF reflects gamma-secretase inhibition in Alzheimer disease. Alzheimers Res Ther. 2010;2:7. doi: 10.1186/alzrt30. [DOI] [PMC free article] [PubMed] [Google Scholar]
- 65.Ray S, Britschgi M, Herbert C, et al. Classification and prediction of clinical Alzheimer’s diagnosis based on plasma signaling proteins. Nat Med. 2007;13:1359–62. doi: 10.1038/nm1653. [DOI] [PubMed] [Google Scholar]
- 66.Reijn TS, Rikkert MO, van Geel WJ, de Jong D, Verbeek MM. Diagnostic accuracy of ELISA and xMAP technology for analysis of amyloid beta(42) and tau proteins. Clin Chem. 2007;53:859–65. doi: 10.1373/clinchem.2006.081679. [DOI] [PubMed] [Google Scholar]
- 67.Saeys Y, Inza I, Larranaga P. A review of feature selection techniques in bioinformatics. Bioinformatics. 2007;23:2507–17. doi: 10.1093/bioinformatics/btm344. [DOI] [PubMed] [Google Scholar]
- 68.Shaw LM, Korecka M, Clark CM, Lee VM, Trojanowski JQ. Biomarkers of neurodegeneration for diagnosis and monitoring therapeutics. Nat Rev Drug Discov. 2007;6:295–303. doi: 10.1038/nrd2176. [DOI] [PubMed] [Google Scholar]
- 69.Shaw LM, Vanderstichele H, Knapik-Czajka M, et al. Cerebrospinal fluid biomarker signature in Alzheimer’s disease neuroimaging initiative subjects. Ann Neurol. 2009;65:403–13. doi: 10.1002/ana.21610. [DOI] [PMC free article] [PubMed] [Google Scholar]
- 70.Siderowf A, Xie SX, Hurtig H, et al. CSF amyloid beta 1-42 predicts cognitive decline in Parkinson’s disease. Ann Neurol. 2010 doi: 10.1212/WNL.0b013e3181f39a78. in press. [DOI] [PMC free article] [PubMed] [Google Scholar]
- 71.Steinacker P, Hendrich C, Sperfeld AD, et al. TDP-43 in cerebrospinal fluid of patients with frontotemporal lobar degeneration and amyotrophic lateral sclerosis. Arch Neurol. 2008;65:1481–7. doi: 10.1001/archneur.65.11.1481. [DOI] [PMC free article] [PubMed] [Google Scholar]
- 72.Steinacker P, Mollenhauer B, Bibl M, et al. Heart fatty acid binding protein as a potential diagnostic marker for neurodegenerative diseases. Neurosci Lett. 2004;370:36–9. doi: 10.1016/j.neulet.2004.07.061. [DOI] [PubMed] [Google Scholar]
- 73.Stern Y, Marder K, Tang MX, Mayeux R. Antecedent clinical features associated with dementia in Parkinson’s disease. Neurology. 1993;43:1690–2. doi: 10.1212/wnl.43.9.1690. [DOI] [PubMed] [Google Scholar]
- 74.Stomrud E, Hansson O, Blennow K, Minthon L, Londos E. Cerebrospinal fluid biomarkers predict decline in subjective cognitive function over 3 years in healthy elderly. Dement Geriatr Cogn Disord. 2007;24:118–24. doi: 10.1159/000105017. [DOI] [PubMed] [Google Scholar]
- 75.Tibshirani R, Hastie T, Narasimhan B, Chu G. Diagnosis of multiple cancer types by shrunken centroids of gene expression. Proc Natl Acad Sci U S A. 2002;99:6567–72. doi: 10.1073/pnas.082099299. [DOI] [PMC free article] [PubMed] [Google Scholar]
- 76.Trojanowski JQ, Vandeerstichele H, Korecka M, et al. Update on the biomarker core of the Alzheimer’s Disease Neuroimaging Initiative subjects. Alzheimers Dement. 2010;6:230–8. doi: 10.1016/j.jalz.2010.03.008. [DOI] [PMC free article] [PubMed] [Google Scholar]
- 77.Uc EY, McDermott MP, Marder KS, et al. Incidence of and risk factors for cognitive impairment in an early Parkinson disease clinical trial cohort. Neurology. 2009;73:1469–77. doi: 10.1212/WNL.0b013e3181bf992f. [DOI] [PMC free article] [PubMed] [Google Scholar]
- 78.van Eersel J, Bi M, Ke YD, et al. Phosphorylation of soluble tau differs in Pick’s disease and Alzheimer’s disease brains. J Neural Transm. 2009;116:1243–51. doi: 10.1007/s00702-009-0293-y. [DOI] [PubMed] [Google Scholar]
- 79.Verwey NA, van der Flier WM, Blennow K, et al. A worldwide multicentre comparison of assays for cerebrospinal fluid biomarkers in Alzheimer’s disease. Ann Clin Biochem. 2009;46:235–40. doi: 10.1258/acb.2009.008232. [DOI] [PubMed] [Google Scholar]
- 80.Walhovd KB, Fjell AM, Brewer J, et al. Combining MR imaging, positron-emission tomography, and CSF biomarkers in the diagnosis and prognosis of Alzheimer disease. AJNR Am J Neuroradiol. 31:347–54. doi: 10.3174/ajnr.A1809. [DOI] [PMC free article] [PubMed] [Google Scholar]
- 81.Zhang H, Yu CY, Singer B. Cell and tumor classification using gene expression data: construction of forests. Proc Natl Acad Sci U S A. 2003;100:4168–72. doi: 10.1073/pnas.0230559100. [DOI] [PMC free article] [PubMed] [Google Scholar]
- 82.Zhang J, Sokal I, Peskind ER, et al. CSF multianalyte profile distinguishes Alzheimer and Parkinson diseases. Am J Clin Pathol. 2008;129:526–9. doi: 10.1309/W01Y0B808EMEH12L. [DOI] [PMC free article] [PubMed] [Google Scholar]