Abstract
Purpose
To compare PRESS and STEAM MR spectroscopy for assessment of liver fat in human subjects.
Materials and Methods
Single-voxel (20×20×20 mm) PRESS and STEAM spectra were obtained at 1.5T in 49 human subjects with known or suspected fatty liver disease. PRESS and STEAM sequences were obtained with fixed TR (1500 ms) and different TE (5 PRESS spectra between TE 30–70 ms, 5 STEAM spectra between TE 20–60 ms). Spectra were quantified and T2 and T2-corrected peak area were calculated by different techniques. The values were compared for PRESS and STEAM.
Results
Water T2 values from PRESS and STEAM were not significantly different (p =0.33). Fat peak T2s were 25–50% shorter on PRESS than on STEAM (p <0.02 for all comparisons) and there was no correlation between T2s of individual peaks. PRESS systematically overestimated the relative fat peak areas (by 7–263%) compared to STEAM (p <0.005 for all comparisons). The peak area given by PRESS was more dependent on the T2-correction technique than STEAM.
Conclusion
Measured liver fat depends on the MRS sequence used. Compared to STEAM, PRESS underestimates T2 values of fat, overestimates fat fraction, and provides a less consistent fat fraction estimate, probably due to J coupling effects.
Keywords: Liver Fat Quantification, Magnetic Resonance Spectroscopy, PRESS and STEAM, j-coupling
INTRODUCTION
Proton Magnetic Resonance Spectroscopy (1H MRS) is widely considered the most accurate non-invasive method to measure liver fat (1). It has been validated in phantoms, animals, and humans, and is performed clinically as well as in research (2–6). Its large-scale feasibility has been demonstrated in a prospective cohort study in which liver fat content was measured spectroscopically in 2,349 subjects (7).
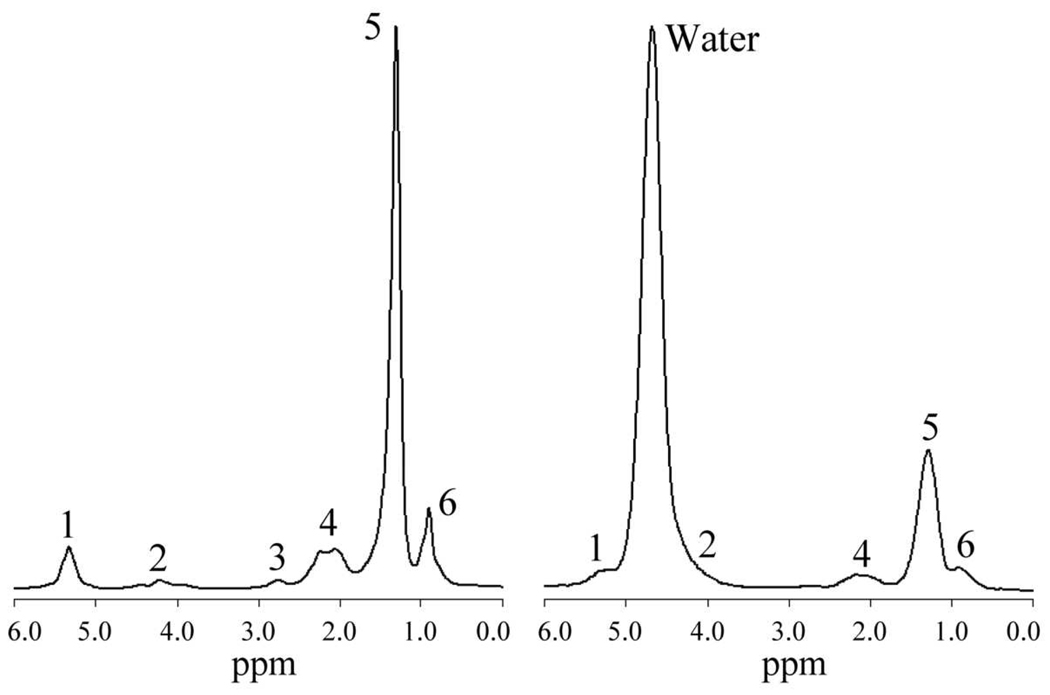
The two main 1H MRS sequences used to measure liver fat are PRESS (Point Resolved Spectroscopy) (8) and STEAM (Stimulated Echo Acquisition Mode) (9,10). Because the water and various fat peaks (Figure 1) have different T2 values, accurate fat quantification requires correction for T2 (2,3,5).
Figure 1.
1H MR spectra (STEAM, TE 20 ms) from an animal fat phantom (left) and in vivo from a human liver (right). The peak assignments are shown in Table 1. In human liver it is not possible to accurately delineate peaks 1 and 2 due to their proximity to the water peak, which is absent in the phantom; also, peak 3 (2.75 ppm) is generally not seen in vivo.
Both PRESS (11–14) and STEAM (15–17) sequences have served as gold standards for liver fat quantification in clinical studies, suggesting that both sequences are valid. This is only correct if the T2 and fat fraction measurements made by STEAM and PRESS are sufficiently similar. However, it is known from brain 1H MRS that PRESS and STEAM differ in their sensitivity to J coupling, causing these sequences to give different peak amplitudes for resonances that exhibit J coupling (18–22) and so provide different estimates of the peak T2 values. It is also known from the MR imaging literature that J coupling accelerates signal decay and reduces the apparent T2 value of fat (23–25). It would therefore be expected that PRESS and STEAM may give different results for liver fat quantification. However, to our knowledge, the effect of J coupling on liver fat signal decay assessed by MR spectroscopy has not previously been considered. Because all liver fat resonances exhibit J coupling (Table 1) (26,27) and because PRESS and STEAM have different sensitivity to J coupling, we hypothesized that T2 and fat fraction measurements made in liver by STEAM and PRESS would differ.
Table 1.
1H resonance assignments with chemical shifts and peak type for peaks visible in the typical animal fat spectrum.
| Peak | Location | Assignment | Peak Type |
|---|---|---|---|
| 1 | 5.30 ppm | -CH=CH- | Multiplet |
| 5.19 ppm | -CH-O-CO-R | Multiplet | |
| 2 | 4.20 ppm | -CH2-O-CO-R | Multiplet |
| 3 | 2.75 ppm | -CH=CH-CH2-CH=CH- | Multiplet |
| 4 | 2.20 ppm | -CO-CH2-CH2- | Multiplet |
| 2.02 ppm | -CH2-CH=CH-CH2- | Multiplet | |
| 5 | 1.60 ppm | -CO-CH2-CH2- | Multiplet |
| 1.30 ppm | -(CH2)n- | Multiplet | |
| 6 | 0.90 ppm | -(CH2)n-CH3 | Triplet |
This prospective study compares in human liver the T2 and fat fraction measurements made by PRESS and STEAM. Phantom studies were also carried out to determine if differences between PRESS and STEAM were consistent with J coupling effects.
MATERIALS AND METHODS
The study was IRB approved and HIPAA compliant. Subjects signed informed consent. Phantom spectra were acquired at 1.5 Tesla (Siemens Symphony scanner) and 3 Tesla (GE Signa scanner). In vivo spectra were obtained only at 1.5T. For both phantom and in vivo 1H MRS, a voxel was selected and shimmed after conventional imaging. The same voxel size, position, shim values, and repetition time were used for PRESS and STEAM acquisitions. Spectra were collected over a range of TEs from 30 to 70 ms for PRESS and from 20 to 60 ms for STEAM (STEAM allows a shorter minimum TE (28)). The TE range was chosen to match the expected T2s of fat and water peaks. The mixing time (TM) for the STEAM sequence was fixed at a minimum value of 10 ms to minimize J coupling effects.
A single experienced observer analyzed the spectra using the AMARES algorithm (29) included in the MRUI software package (30). This package can only fit Gaussians or Lorentzians, and the in vivo peaks will not be fully described by these functions. Thus, the 2.1, 1.3 and 0.9 ppm fat peaks were fitted with two Gaussian resonances and the water peak was fitted with three Gaussians. The T2-values of the spectral peaks and the T2-corrected peak areas were calculated by least-squares linear fitting of the log of the observed spectral peak areas versus TE. The data were also fitted non-linearly; non-linear fitting minimizes the difference between the observed peak areas and values given by theoretical monoexponential decay.
In Vivo STEAM vs PRESS
Forty-nine human subjects (15 adult males, 12 adult females, 16 pediatric males, and 6 pediatric females) with mean ages of 42 years (adult subjects) and 13 years (pediatric subjects) were recruited from parent clinical trials being conducted at our institution of participants with known or suspected non-alcoholic fatty liver disease. Of the 49 subjects, 16 had biopsy proven NAFLD, 19 had a family history of NAFLD, and 14 were overweight. No further information other than NAFLD status was available from the parent studies for subjects who underwent biopsy. The 49 enrolled subjects underwent research MR examinations of the liver between December 2006 and June 2007. A 20×20×20 mm voxel was selected that avoided the edge of the liver and major blood vessels. The same voxel was used for all acquisitions, with spectra being acquired consecutively. Following shimming during free breathing, spectra were collected with a single element of a torso array coil. Ten spectra (TR = 1500 ms) were collected as separate 15 sec breath-holds for each subject (at TE 30, 40, 50, 60 and 70 ms for PRESS, and TE 20, 30, 40, 50 and 60 ms for STEAM) using six signal averages and four pre-acquisition excitations. Typically, the fat signal is summed from 0.5 to 3 ppm and corrected for T2 relaxation assuming monoexponential decay to give the T2-corrected composite fat peak area (7). However, each resonance has its own T2 relaxation value, and it may not be valid to assume monoexponential decay for the composite peak. Thus, we also measured the T2 of the individual fat peaks. This allowed us to calculate the T2-corrected area of each peak separately and then sum the individual T2-corrected peak areas. The T2-corrected areas of the fat peaks were expressed as a fraction of the T2-corrected water peak area. We compared the T2 and T2-correct peak areas for PRESS and STEAM.
Phantom Experiment
The expected behavior for simple weakly coupled systems in a PRESS sequence with respect to TE can be easily modeled (20). The STEAM sequence has a more complex response to J coupling than the PRESS sequence since its three 90° pulses can create multiple quantum coherences, and is affected by changes in TM as well as TE (18,20). Fat peaks other than CH3 have a complex multiplet shape (Table 1), and the CH3 triplet at 0.9 ppm triplet is strongly coupled at in vivo field strengths, meaning its behavior deviates from the weakly coupled case (20). Given the complexity of the response of the J-coupled peaks to the PRESS and STEAM sequences, the behavior of the J-coupled fat peaks was examined using a phantom, rather than by simulation.
A 1-kilogram block of animal lard, heated until liquid, was used as a fat phantom. PRESS and STEAM spectra were acquired using a head coil at both 1.5T and 3T in a 20×20×20 mm voxel in the phantom center with 8 signal averages at TR 3500 ms every 5 ms, over the range of TEs. T2 values were measured for each fat peak individually. Additionally, high-resolution spectra were collected over the range of TEs at 3T in a 5×5×5 mm voxel selected to allow high-quality shimming; PRESS and STEAM spectra were acquired at TR 3500 with 128 signal averages every 10 ms across the range of TEs. The high-resolution spectra were examined qualitatively to observe the effect of J coupling.
Statistical Analysis
T2 values for water and fat (individual and composite) peaks produced by different methods (PRESS vs STEAM) were compared using paired t-tests.
T2-corrected fat peak areas produced by different methods (PRESS vs STEAM, sum of individual peaks vs composite peak and linear vs non-linear T2 correction) were plotted. Linear least-square fits of the data were calculated assuming the data went through the origin. Quality of fit was evaluated by the Pearson-r correlation coefficient. T-tests were calculated to see if the fit of the data deviated significantly from equality, which would indicate a systematic difference.
RESULTS
Human Subjects Studies
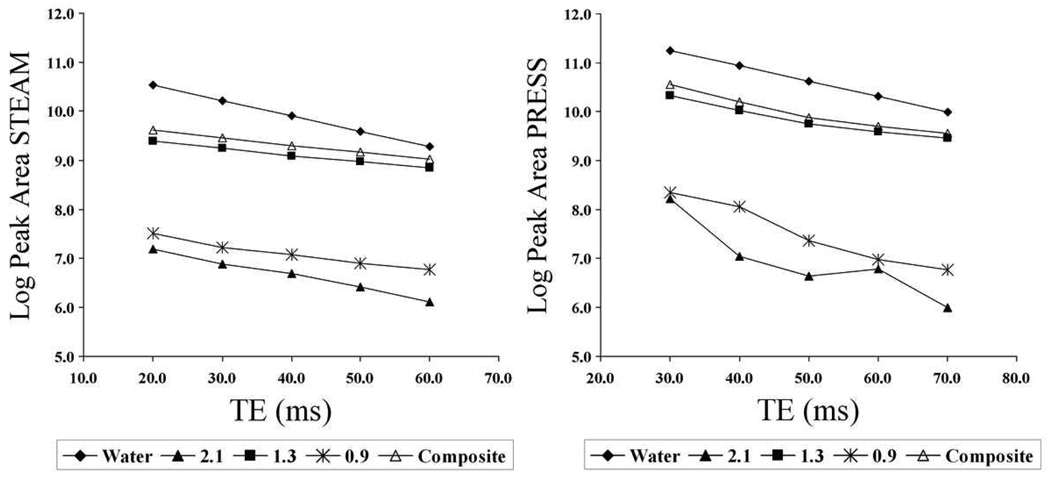
Figure 2 shows an example of the change in measured peak area with TE of the 1H MR spectra for PRESS and STEAM in human liver. Over the range of obtained TEs, signal decay was well described by a mono-exponential function. Minor deviation from exponential decay in the CH2 (2.1 ppm) and CH3 (0.9 ppm) peaks was attributed to noise.
Figure 2.
The change in log peak area with TE in 1H MR spectra for STEAM (left) and PRESS (right) in the liver of a 40-year old male with significant fat accumulation. Signal decay for the peak areas is more rapid for PRESS than for STEAM.
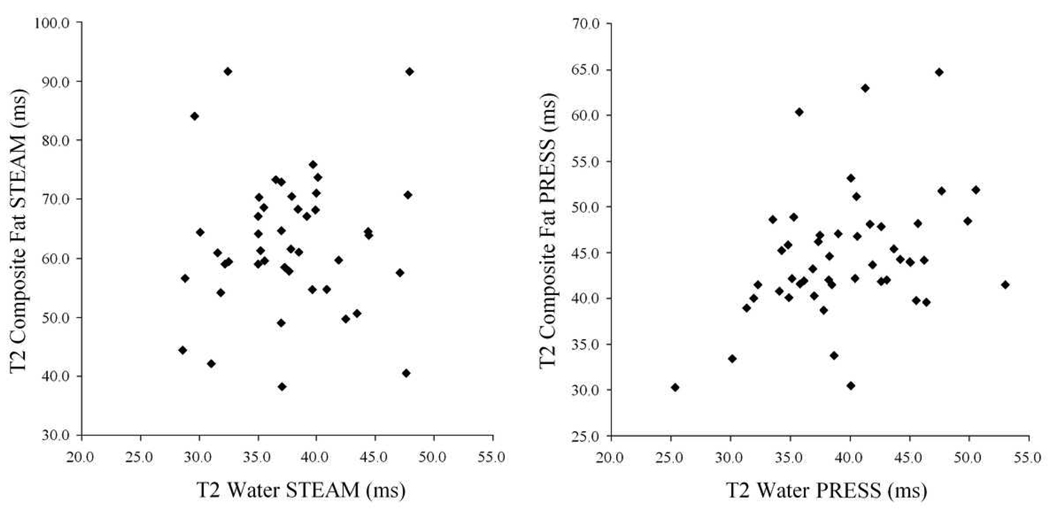
Table 2 summarizes the T2 values for water and fat peaks in human liver. The water T2 values from PRESS and STEAM were not significantly different (p = 0.33), whereas all fat peak T2s were shorter on PRESS than on STEAM (p < 0.02 for all comparisons). The range of observed T2 values was large for all analyzed peaks. The T2 values of water did not correlate with the T2 values of the composite fat peak (r2 =0.006 for STEAM; r2 =0.134 for PRESS; Figure 3) or with the T2 values of any of the individual fat peaks (r2 =0.005 to 0.200 for STEAM; r2 = 0.000 to 0.174 for PRESS; figure not shown). Moreover, the individual fat peaks did not correlate with other individual fat peaks (r2 =0.001 to 0.026 for STEAM; r2 =0.027 to 0.147 for PRESS; figures not shown).
Table 2.
Comparison of the mean T2s (in ms) of the water and fat peaks in human liver in vivo as given by STEAM and PRESS (n = 49)
| Peak | STEAM | PRESS | p |
|---|---|---|---|
| Water | 35.2 (22.4–44.1) | 36.8 (25.3–45.1) | 0.33 |
| CH2 (2.1 ppm) | 39.2 (23.0–76.1) | 20.3 (8.5–31.6) | <0.001 |
| CH2 (1.3 ppm) | 75.5 (37.0–106.2) | 57.1 (36.4–83.2) | < 0.02 |
| CH3 (0.9 ppm) | 45.0 (27.7–78.6) | 18.2 (10.8–23.7) | <0.001 |
| Composite Fat* | 64.0 (35.1–92.7) | 43.9 (30.3–62.9) | <0.001 |
Note: To ensure enough signal to measure fat T2, only subjects with CH2 (1.3) / Water > 10% were analyzed (n = 20). Ranges are in parentheses.
Composite Fat is the sum of the uncorrected fat peaks in the range 0.5 – 3 ppm.
Figure 3.
T2 of the composite fat peak compared to T2 of water for STEAM (left) and PRESS (right) (n=49). Both sequences show a large range of T2s for both fat and water. There is no correlation between water and fat T2.
As shown in Figure 4, the T2-corrected fat peak areas given by PRESS and STEAM in human subjects were correlated, but the estimated fat peak areas were consistently greater on PRESS than on STEAM. The differences between PRESS and STEAM were 7% for the CH2 (1.3 ppm) peak (r2 = 0.971, p < 0.005), 75% for the CH2 (2.1 ppm) peak (r2 = 0.837, p < 0.0001), 263% for the CH3 (0.9 ppm) peak (r2 = 0.404, p < 0.0001), 25% for the composite fat peak (r2 = 0.986, p < 0.0001), and 62% for the sum of the individual fat peaks (r2 = 0.965, p < 0.0001, figure not shown).
Figure 4.
Peak area ratio of signals from fat to water given by PRESS compared to that given by STEAM (n = 49) for A – CH2 (1.3 ppm), B – CH2 (2.1 ppm), C – CH3 (0.9 ppm) and D – composite fat. For all the peaks, PRESS overestimates peak area with respect to STEAM. This overestimate appears systematic particularly in the CH2 (1.3 ppm) and composite fat peaks. The dashed line indicates unity.
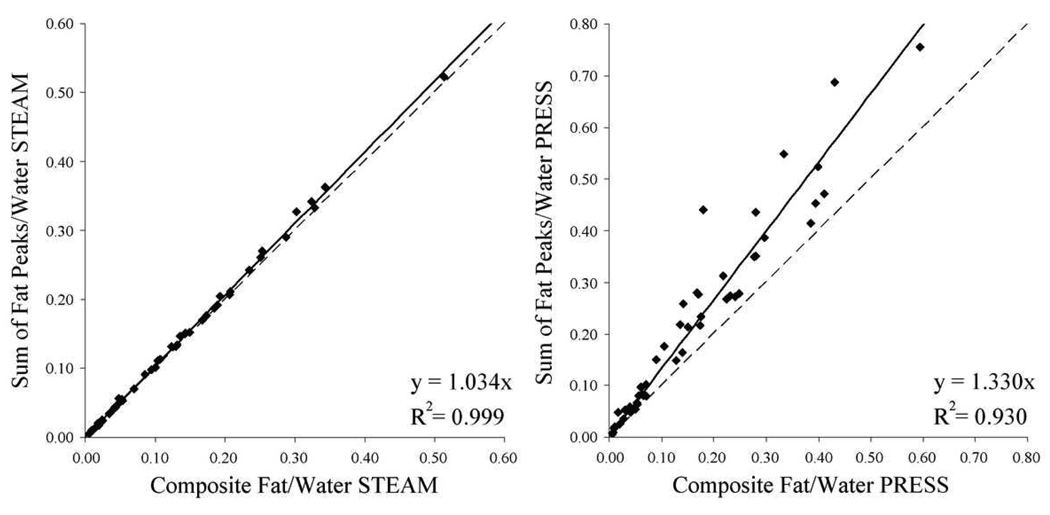
Figure 5 compares the sum of the T2-corrected areas of individual fat peaks with the T2-corrected composite fat peak. For STEAM, there was a strong linear correlation between the two values, with the sum of individual peaks giving a peak area value 3.4% greater than that given by the composite peak (r2 = 0.999, p < 0.0001). The PRESS sequence showed greater variability, with the sum of individual peaks giving a peak area value 33% greater than that given by the composite peak (r2 = 0.930, p < 0.0001).
Figure 5.
Comparison of the peak area ratio of “total” fat (0.5–3 ppm) to water treating the fat peaks in this region individually and as a single composite fat peak for STEAM (left) and PRESS (right). While for STEAM the two estimates disagree by 3.4%, for PRESS there is a 33% disagreement between the two values. The dashed line indicates unity.
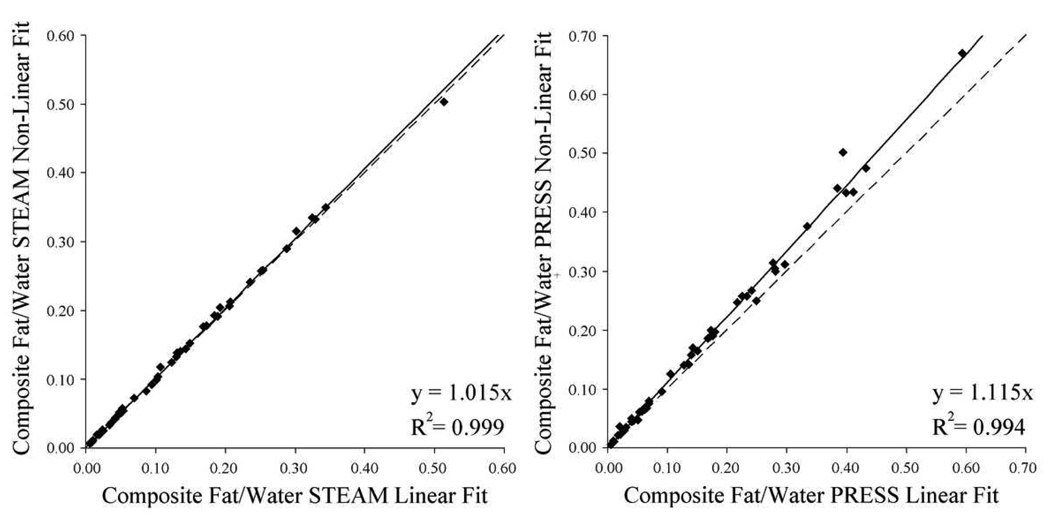
Figure 6 shows the peak area of the composite peak given by linear and non-linear calculation of the peak area. For both sequences, the results produced by these analyses were strongly correlated. Although linear and non-linear fits were different for both PRESS and STEAM, the difference was smaller for STEAM (1.5%, r2 = 0.999, p < 0.03) than for PRESS (11.5%, r2 = 0.994, p < 0.0001).
Figure 6.
Peak area ratio of composite fat to water given by linear fitting of TE data compared to that given by non-linear fitting for STEAM (left) and PRESS (right) (n=49). Whereas the values given by STEAM are in close agreement, PRESS gives non-linear fitting values 11% higher than linear fitting.
Phantom Studies
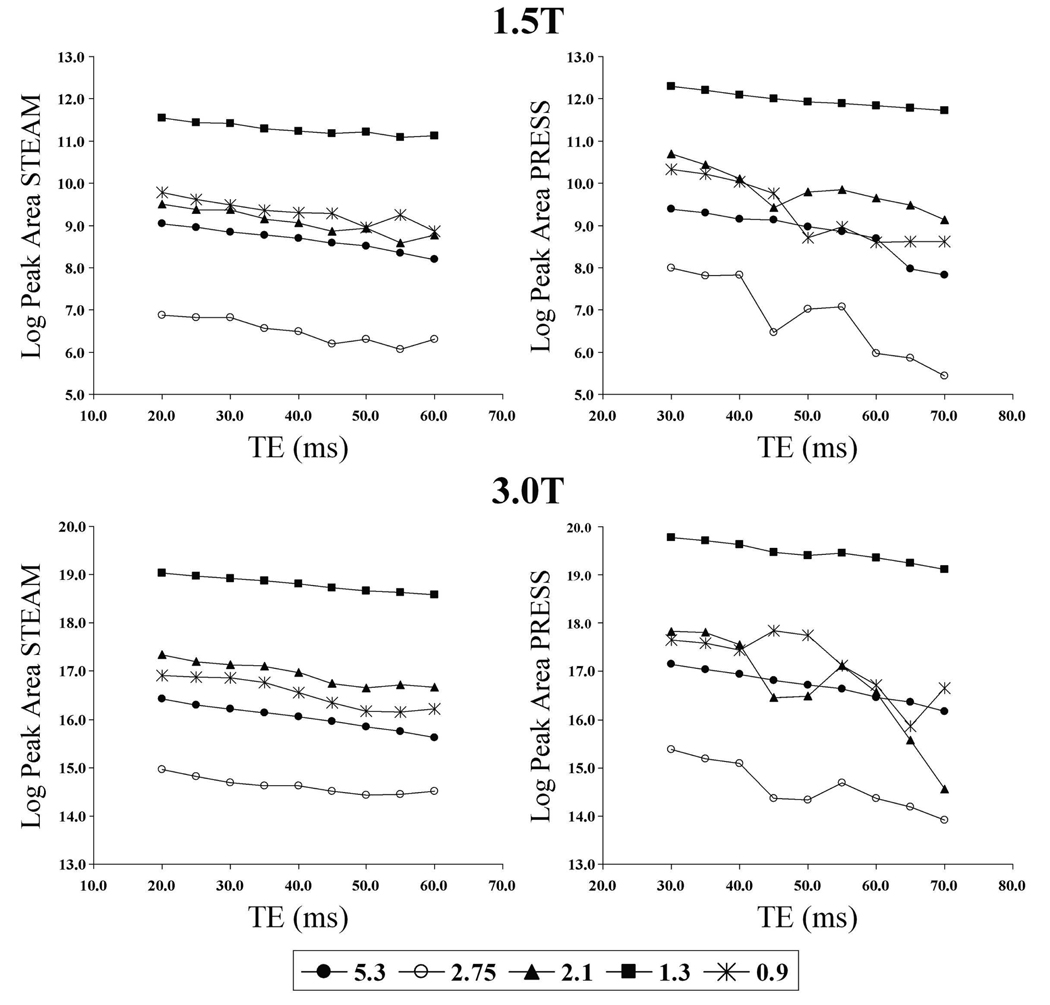
Figure 7 shows the behavior of the peaks in the 1H MR spectra of the animal fat phantom for the different TEs for PRESS and STEAM at both 1.5T and 3T. For all spectroscopically evident peaks, the STEAM sequence showed the expected exponential decay. For the PRESS sequence, the peaks at 2.1 ppm and 0.9 ppm showed behavior deviating from the expected exponential decay. For all the peaks, the apparent T2 values estimated from PRESS were shorter than those from STEAM (Table 3).
Figure 7.
The change in log peak area with TE for the fat peaks in the animal fat spectrum for the STEAM sequence (left) and the PRESS sequence (right) at 1.5T (top) and 3T (bottom). While the straight lines for the STEAM graph indicate exponential decay, the peaks at 2.1 and 0.9 ppm for the PRESS graph show non-exponential decay.
Table 3.
Comparison of the T2s of the fat peaks in the animal fat phantom given by STEAM and PRESS.
| 1.5 T | 3.0 T | |||
|---|---|---|---|---|
| Peak | STEAM T2 (ms) | PRESS T2 (ms) | STEAM T2 (ms) | PRESS T2 (ms) |
| CH (5.3 ppm) | 50.4 | 26.2 | 52.1 | 44.6 |
| CH2 (2.75 ppm) | 50.6 | 15.7 | 62.2 | 32.6 |
| CH2 (2.1 ppm) | 45.8 | 31.1 | 54.6 | 16.2 |
| CH2 (1.3 ppm) | 90.2 | 71.4 | 84.9 | 66.4 |
| CH3 (0.9 ppm) | 50.3 | 19.6 | 44.6 | 28.1 |
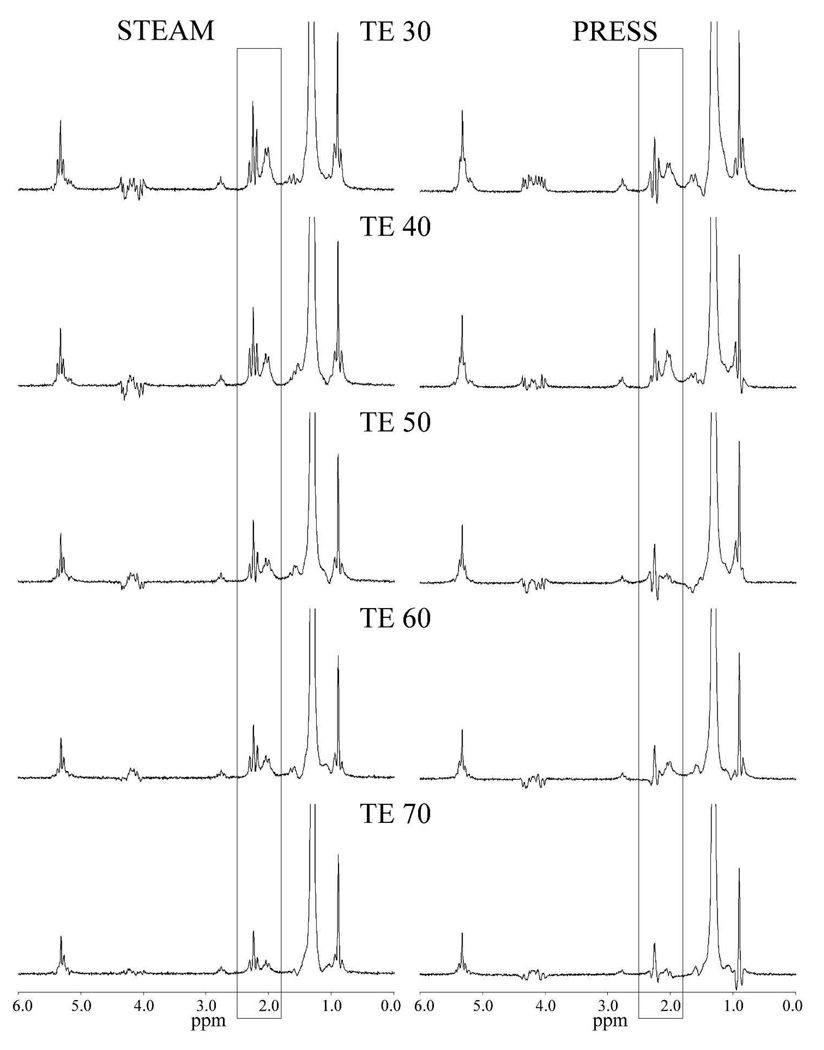
Figure 8 compares high-resolution animal fat phantom spectra given by PRESS with those given by STEAM. The different responses to J coupling in PRESS and STEAM are particularly evident in the peaks with make up the 2.1 ppm peak in vivo. Here, all the peaks are clearly visible on STEAM at all TEs, but in PRESS, many of the peaks are absent or negative. Examining the CH3 triplet at 0.9 ppm, the relative intensity of the central peak is similar for both PRESS and STEAM. This suggests the shorter effective T2 in vivo is produced by the J-coupled induced phase change in the side peaks. For STEAM, phase changes introduced by J coupling are less evident but still apparent, particularly in the strongly coupled AB spin system at 4.2 ppm.
Figure 8.
Comparison of high-resolution animal spectra of an animal fat phantom for STEAM (left) and PRESS (right) for TEs from 30 to 70 ms. As can be seen in the 1.8 – 2.5 ppm region (indicated), non-exponential decay from J coupling causes the peaks to disappear or to become negative as TE increases, whereas all the peaks remain positive in STEAM.
DISCUSSION
These results show that choice of MR spectroscopy sequence affects the estimation of liver fat. In vivo, over the TE range examined, T2 values of fat given by PRESS are shorter than those from STEAM, whereas the T2 values for water are similar, causing PRESS to give a higher estimate of fat than STEAM. In the phantom, the 2.1 ppm and 0.9 ppm fat peaks show non-exponential decay on PRESS but not STEAM; all fat peaks had shorter T2s on PRESS than on STEAM. The non-exponential decay is not as evident in human subjects, probably because of the lower signal-to-noise inherent in the in vivo spectra.
The higher fat peak area given by PRESS, compared to STEAM, appears systematic. For the composite peak, the magnitude of the difference between PRESS and STEAM depends upon whether the composite peak is treated as a single peak or as a sum of individual peaks, and whether it is fitted linearly or non-linearly. For PRESS the dependence on the method used to calculate the fat fraction means a single set of data can potentially give different values. In contrast fat fraction estimates obtained by STEAM are similar for all methods examined. Thus for STEAM, analysis of a single set of data produces a consistent fat fraction value.
The magnitude of the difference between PRESS and STEAM depends on the range of TEs at which measurements are taken and not just on the manner in which the peaks in the region 0.5–3 ppm are treated. Had STEAM been acquired over a larger TE range, or with a longer minimum TE, the effects of J coupling would be more pronounced (19). Equally, if PRESS could be collected with a shorter minimum TE, and over a shorter TE range, the effect of J coupling may be less pronounced. The dependence of the fat fraction on the choice of sequence and the acquisition parameters suggests that in longitudinal studies, standardization of technique is imperative.
As shown in the phantom, over the TE range examined, STEAM appears less affected by J coupling than PRESS, and consequently is less prone to T2 underestimation and fat peak area overestimation. Based on the high-resolution phantom spectra, phase changes introduced by J coupling in PRESS are expected to reduce the observed T2 in vivo. If the J coupling of the fat peaks is known accurately, the effect of J coupling could be modeled and corrected. However, this may be impractical as the coupling behavior of fat is complex, will differ depending on the type of fat, and most peaks at in vivo field strengths are strongly coupled (20).
The reduction of T2 due to J coupling has been recognized in MR imaging when comparing spin-echo (SE) with fast spin-echo (FSE) imaging. If the inter-echo spacing in the FSE sequence is short, the effects of J coupling are reduced. However, in SE imaging the J coupling has time to evolve, causing the apparent T2 of fat to be reduced. Thus the signal intensity of adipose tissue is diminished in SE imaging compared to FSE imaging (23–25).
Because water and the fat peaks have different T2 values (2,3,5), transverse relaxation may cause errors in fat fraction quantification. To correct for T2 relaxation, some investigators collect a single spectrum at one TE and then correct for transverse relaxation by applying population-derived average fat and water T2 values, assuming that the variability of T2 values in the population is not large enough to introduce errors in the T2-corrected fat peak area. Our data suggest that applying average fat and water values may be inadequate, as the range of observed T2 values is large, and there is poor correlation between the T2 values of the various peaks. These observations suggest that a better approach is to obtain spectra at multiple TEs and measure and correct for T2 relaxation individually in each subject.
If the acquisition of spectra at multiple TEs is impractical and spectra must be collected at a single TE, the spectra should be collected at minimum TE to minimize error due to T2 variability. This suggests the use of STEAM, as STEAM can obtain spectra at shorter echo times than PRESS (28). STEAM generated T2 values should be used to correct for T2 decay in single TE spectra, as T2 values generated from PRESS will be underestimated, resulting in overestimation of liver fat level.
It has been shown in brain 1H MRS that while PRESS is relatively insensitive to patient motion, motion-induced phase dispersion in STEAM reduces the peak area of brain metabolites (31–33). Thus in vivo motion affects PRESS differently from STEAM. However, as all peaks are affected and as fat peaks are referenced to the water peak, this effect is likely to be small. Further, our phantom observations, in which motion is absent, matched those made in vivo. As the patient was shimmed during free breathing, patient motion will also reduce the quality of the shim. However this effect should affect PRESS and STEAM equally.
The prime focus of this study was the comparison of the different liver fat quantification values produced by PRESS and STEAM. Detailed numerical analysis of the response of coupled spins systems to PRESS and STEAM has been carried out elsewhere and thus is not reiterated here (18–22). The effect of volume shift effect on PRESS also has not been considered here, as it is assumed the bandwidth of the RF pulse is large enough to make this effect minimal.
One limitation of this study was that the high-resolution phantom spectra were obtained at 3T but clinical data was obtained at only 1.5T. This was primarily due to logistical issues. However, the non-high-resolution phantom spectroscopy showed similar behavior at 1.5T and 3T suggesting that it acceptable to use the 3T phantom data to understand the in vivo 1.5T behavior.
While this study shows that, over the TE range examined, STEAM produces more consistent and theoretically more accurate results than PRESS, it does not show that the estimate produced by STEAM is correct. As shown in the high-resolution spectra, both PRESS and STEAM are affected by J coupling, though the effect appears greater for PRESS than STEAM. As none of the subjects had recent liver biopsies, histological comparison was unavailable.
Further, as the data was collected at TR 1500, the water peak was not fully recovered (3) leading to a slight overestimation of the fat-water peak area ratio. However, this will affect PRESS and STEAM equally and hence will not introduce bias into our results. By limiting the range of TE examined to that appropriate for measurement for liver water and fat proton signals, we did not observe bi-exponential decay as reported by other groups (34). At longer TEs, for both PRESS and STEAM, J coupling effects are accentuated leading to more complex decay behavior.
In conclusion, the estimate of liver fat depends on the 1H MRS sequence used to collect the data, with PRESS giving consistently higher estimates of liver fat with respect to STEAM, possibly due to stronger J coupling effects on the PRESS sequence. STEAM is less sensitive to J coupling and gives a more consistent and theoretically more accurate estimate. T2 values for water and fat are highly variable. Measurement of and correction for T2 values for individual patients may be necessary for accurate fat quantification, and the application of average population-derived T2 values to individual patients may be inadequate. MR spectroscopy is increasingly used to determine liver lipids or as gold standard for imaging-based fat sequences of the liver. The lack of agreement between values given by PRESS and STEAM suggests that use of MR spectroscopy as a reference standard is problematic without consideration of T2 and J coupling effects.
Acknowledgments
This work was performed as an ancillary study (#AS009) of the Nonalcoholic Steatohepatitis Clinical Research Network (NASH CRN). The NASH CRN is supported by the National Institute of Diabetes and Digestive and Kidney Diseases (NIDDK) (UCSD #1U01DK061734, Data Coordinating Center #5U01DK061730) and the National Institute of Child Health and Human Development (NICHD).
This work was funded in part by grants from the National Institutes of Health including R01 DK71486 from the National Institute of Diabetes and Digestive and Kidney Diseases, P60 MD00220 for the San Diego EXPORT Center from the National Center of Minority Health and Health Disparities, and M01 RR000827 from the National Center for Research Resources for the General Clinical Research Center at UCSD.
REFERENCES
- 1.Charatcharoenwitthaya P, Lindor KD. Role of Radiologic Modalities in the Management of Non-alcoholic Steatohepatitis. Clin Liver Dis. 2007;11:37–54. doi: 10.1016/j.cld.2007.02.014. [DOI] [PubMed] [Google Scholar]
- 2.Longo R, Ricci C, Masutti F, et al. Fatty infiltration of the liver. Quantification by 1H localized magnetic resonance spectroscopy and comparison with computed tomography. Invest Radiol. 1993;28:297–302. [PubMed] [Google Scholar]
- 3.Thomsen C, Becker U, Winkler K, Christoffersen P, Jensen M, Henriksen O. Quantification of liver fat using magnetic resonance spectroscopy. Magn Reson Imaging. 1994;12:487–495. doi: 10.1016/0730-725x(94)92543-7. [DOI] [PubMed] [Google Scholar]
- 4.Longo R, Pollesello P, Ricci C, et al. Proton MR spectroscopy in quantitative in vivo determination of fat content in human liver steatosis. J Magn Reson Imaging. 1995;5:281–285. doi: 10.1002/jmri.1880050311. [DOI] [PubMed] [Google Scholar]
- 5.Szczepaniak LS, Babcock EE, Schick F, et al. Measurement of intracellular triglyceride stores by 1H spectroscopy: validation in vivo. Am J Physiol. 1999;276:E977–E989. doi: 10.1152/ajpendo.1999.276.5.E977. [DOI] [PubMed] [Google Scholar]
- 6.Schwimmer JB, Middleton MS, Deutsch R, Lavine JE. A phase 2 clinical trial of metformin as a treatment for non-diabetic paediatric non-alcoholic steatohepatitis. Aliment Pharmacol Ther. 2005;21:871–879. doi: 10.1111/j.1365-2036.2005.02420.x. [DOI] [PubMed] [Google Scholar]
- 7.Szczepaniak LS, Nurenberg P, Leonard D, et al. Magnetic resonance spectroscopy to measure hepatic triglyceride content: prevalence of hepatic steatosis in the general population. Am J Physiol Endocrinol Metab. 2005;288:E462–E468. doi: 10.1152/ajpendo.00064.2004. [DOI] [PubMed] [Google Scholar]
- 8.Bottomley PA. Spatial localization in NMR spectroscopy in vivo. Ann NY Acad Sci. 1987;508:333–348. doi: 10.1111/j.1749-6632.1987.tb32915.x. [DOI] [PubMed] [Google Scholar]
- 9.Granot J. Selected volume excitation using stimulated echoes (VEST): applications to spatially localized spectroscopy and imaging. J Magn Reson. 1986;70:488–492. [Google Scholar]
- 10.Frahm J, Merboldt K-D, Hänicke W. Localized proton spectroscopy using stimulated echoes. J Magn Reson. 1987;72:502–508. doi: 10.1002/mrm.1910170113. [DOI] [PubMed] [Google Scholar]
- 11.Kotronen A, Seppälä-Lindroos A, Bergholm R, Yki-Järvinen H. Tissue specificity of insulin resistance in humans: fat in the liver rather than muscle is associated with features of the metabolic syndrome. Diabetologia. 2008;51:130–138. doi: 10.1007/s00125-007-0867-x. [DOI] [PubMed] [Google Scholar]
- 12.Perseghin G, Lattuada G, De Cobelli F, et al. Increased mediastinal fat and impaired left ventricular energy metabolism in young men with newly found fatty liver. Hepatology. 2008;47:51–58. doi: 10.1002/hep.21983. [DOI] [PubMed] [Google Scholar]
- 13.Hadigan C, Liebau J, Andersen R, Holalkere NS, Sahani DV. Magnetic resonance spectroscopy of hepatic lipid content and associated risk factors in HIV infection. J Acquir Immune Defic Syndr. 2007;46:312–317. doi: 10.1097/QAI.0b013e3181568cc2. [DOI] [PubMed] [Google Scholar]
- 14.Thomas EL, Potter E, Tosi I, et al. Pioglitazone added to conventional lipid-lowering treatment in familial combined hyperlipidaemia improves parameters of metabolic control: relation to liver, muscle and regional body fat content. Atherosclerosis. 2007;195:e181–e190. doi: 10.1016/j.atherosclerosis.2007.03.043. [DOI] [PubMed] [Google Scholar]
- 15.Cree MG, Newcomer BR, Read LK, et al. Plasma triglycerides are not related to tissue lipids and insulin sensitivity in elderly following PPAR-alpha agonist treatment. Mech Ageing Dev. 2007;128:558–565. doi: 10.1016/j.mad.2007.08.001. [DOI] [PMC free article] [PubMed] [Google Scholar]
- 16.Kim H, Taksali SE, Dufour S, et al. Comparative MR study of hepatic fat quantification using single-voxel proton spectroscopy, two-point dixon and three-point IDEAL. Magn Reson Med. 2008;59:521–527. doi: 10.1002/mrm.21561. [DOI] [PMC free article] [PubMed] [Google Scholar]
- 17.Hwang JH, Stein DT, Barzilai N, et al. Increased intrahepatic triglyceride is associated with peripheral insulin resistance: in vivo MR imaging and spectroscopy studies. Am J Physiol Endocrinol Metab. 2007;293:E1663–E1669. doi: 10.1152/ajpendo.00590.2006. [DOI] [PubMed] [Google Scholar]
- 18.Ernst T, Hennig J. Coupling effects in volume selective 1H spectroscopy of major brain metabolites. Magn Reson Med. 1991;21:82–96. doi: 10.1002/mrm.1910210111. [DOI] [PubMed] [Google Scholar]
- 19.Thompson RB, Allen PS. Response of metabolites with coupled spins to the STEAM sequence. Magn Reson Med. 2001;45:955–965. doi: 10.1002/mrm.1128. [DOI] [PubMed] [Google Scholar]
- 20.De Graff RA, Rothman DL. In Vivo Detection and Quantification of Scalar Coupled 1H NMR Resonances. Concepts in Magnetic Resonance. 2001;13:32–76. [Google Scholar]
- 21.Kim H, Thompson RB, Hanstock CC, Allen PS. Variability of metabolite yield using STEAM or PRESS sequences in vivo at 3.0 T, illustrated with myo-inositol. Magn Reson Med. 2005;53:760–769. doi: 10.1002/mrm.20434. [DOI] [PubMed] [Google Scholar]
- 22.Maudsley AA, Govindaraju V, Young K, et al. Numerical simulation of PRESS localized MR spectroscopy. J Magn Reson. 2005;173:54–63. doi: 10.1016/j.jmr.2004.11.018. [DOI] [PubMed] [Google Scholar]
- 23.Hardy PA, Henkelman RM, Bishop JE, Poon CS, Plewes DB. Why fat is bright in RARE and fast spin-echo imaging. J Magn Reson Imaging. 1992;2:533–540. doi: 10.1002/jmri.1880020511. [DOI] [PubMed] [Google Scholar]
- 24.Stables LA, Kennan RP, Anderson AW, Constable RT, Gore JC. Analysis of J coupling-induced fat suppression in DIET imaging. J Magn Reson. 1999;136:143–151. doi: 10.1006/jmre.1998.1628. [DOI] [PubMed] [Google Scholar]
- 25.Stables LA, Kennan RP, Anderson AW, Gore JC. Density matrix simulations of the effects of J coupling in spin echo and fast spin echo imaging. J Magn Reson. 1999;140:305–314. doi: 10.1006/jmre.1998.1655. [DOI] [PubMed] [Google Scholar]
- 26.Fauhl C, Reniero, Guillou C. 1H NMR as a tool for the analysis of mixtures of virgin olive oil with oils of different botanical origin. Mag Res Chem. 2000;38:436–443. [Google Scholar]
- 27.Oostendorp M, Engelke UF, Willemsen MA, Wevers RA. Diagnosing Inborn Errors of Lipid Metabolism with Proton Nuclear Magnetic Resonance Spectroscopy. Clin Chem. 2006;52:1395–1405. doi: 10.1373/clinchem.2006.069112. [DOI] [PubMed] [Google Scholar]
- 28.Keevil SF. Spatial localization in nuclear magnetic resonance spectroscopy. Phys Med Biol. 2006;51:R579–R636. doi: 10.1088/0031-9155/51/16/R01. [DOI] [PubMed] [Google Scholar]
- 29.Vanhamme L, van den Boogaart A, Van Huffel S. Improved method for accurate and efficient quantification of MRS data with use of prior knowledge. J Magn Reson. 1997;129:35–43. doi: 10.1006/jmre.1997.1244. [DOI] [PubMed] [Google Scholar]
- 30.Naressi A, Couturier C, Devos JM, et al. Java-based graphical user interface for the MRUI quantitation package. MAGMA. 2001;12:141–152. doi: 10.1007/BF02668096. [DOI] [PubMed] [Google Scholar]
- 31.Felblinger J, Kreis R, Boesch C. Effects of physiologic motion of the human brain upon quantitative 1H-MRS: analysis and correction by retro-gating. NMR Biomed. 1998;11:107–114. doi: 10.1002/(sici)1099-1492(199805)11:3<107::aid-nbm525>3.0.co;2-i. [DOI] [PubMed] [Google Scholar]
- 32.Pattany PM, Khamis IH, Bowen BC, et al. Effects of physiologic human brain motion on proton spectroscopy: quantitative analysis and correction with cardiac gating. Am J Neuroradiol. 2002;23:225–230. [PMC free article] [PubMed] [Google Scholar]
- 33.Pattany PM, Massand MG, Bowen BC, Quencer RM. Quantitative analysis of the effects of physiologic brain motion on point-resolved spectroscopy. Am J Neuroradiol. 2006;27:1070–1073. [PMC free article] [PubMed] [Google Scholar]
- 34.Deslauriers R, Somorjai RL, Geoffrion Y, Kroft T, Smith IC, Saunders JK. 1H and 13C NMR studies of tissue from normal and diseased mice. Analysis of T1 and T2 relaxation profiles of triglycerides in liver. NMR Biomed. 1988;1:32–43. doi: 10.1002/nbm.1940010107. [DOI] [PubMed] [Google Scholar]


