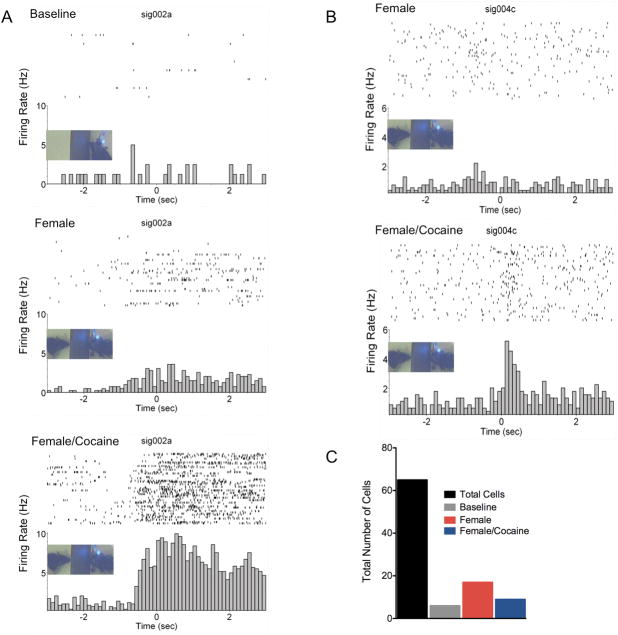
Figure 2.
Perievent time histograms and overlying raster plots for two representative excitatory neuronal responses in mPFC. All plots have a bin width of 100 ms. The 0 second mark aligns spikes around the nosepoke event. Data presented as spikes second−1 (Hz). A) Activity of a cell during nosepoke behavior during a baseline, presentation of a sexually receptive female and re-exposure to the female following cocaine administration. B) Activity of a cell that fired during nosepoking behavior in the presence of a sexually receptive female, but only after administration of cocaine. C) Summary of the proportions of total cells sampled and those categorized as responding during baseline and receptive female presentations.

