

Abstract
Acyl-coenzyme A:cholesterol acyltransferase 1 (ACAT1) is a membrane bound enzyme utilizing long-chain fatty acyl-coenzyme A and cholesterol to form cholesteryl esters and coenzyme A. Previously, we had expressed tagged human ACAT1 (hACAT1) in CHO cells and purified it to homogeneity; however, only a sparse amount of purified protein could be obtained. Here we report that the hACAT1 expression level in H293 cells is 18-fold higher than that in CHO cells. We have developed a milder purification procedure to purify the enzyme to homogeneity. The abundance of the purified protein enabled us to conduct difference intrinsic fluorescence spectroscopy to study the binding between the enzyme and its substrates in CHAPS/phospholipid mixed micelles. The results show that oleoyl CoA binds to ACAT1 with Kd=1.9 μM, and elicits significant structural changes of the protein as manifested by the significantly positive changes in its fluorescence spectrum; stearoyl CoA elicits a similar spectrum change with much lower in magnitude. Previously, kinetic studies had shown that cholesterol is an efficient substrate and an allosteric activator of ACAT1, while its diastereomer epicholesterol is neither a substrate nor an activator. Here we show that both cholesterol and epicholesterol induce positive changes in the ACAT1 fluorescence spectrum; however, the magnitude of spectrum changes induced by cholesterol is much larger than epicholesterol. These results show that stereospecificity, governed by the 3beta-OH moiety in steroid ring A, plays an important role in the binding of cholesterol to ACAT1.
Acyl-coenzyme A:cholesterol acyltransferase utilizes long-chain fatty acyl-coenzyme A and cholesterol as its substrates, producing cholesteryl esters and coenzyme A as its products. In mammals, there are two ACAT genes that encode two similar but different proteins, ACAT1 (1) and ACAT2 (2), (3), (4). Tissue distribution studies show that ACAT1 is ubiquitously expressed, while ACAT2 is mainly expressed in intestinal enterocytes and in hepatocytes, as reviewed in (5). Both ACAT1 and ACAT2 are potential drug targets for therapeutic intervention of dyslipidemia and atherosclerosis (6), (7). ACAT1, ACAT2 and its close homolog diacylglycerol ayltransferase 1 (8) are founding members of the membrane bound acyltransferase (MBOAT) superfamily (9). The MBOATs are fatty acyltransferases with multiple transmembrane domains (TMD), and with an invariant histidine (His) embedded in a long stretch of hydrophobic residues. There are more than a dozen MBOAT members that includes grehlin acyltransferase (10), (11) and certain lysophospholipid acyltransferases (12), (13)).
ACAT1 is a resident enzyme in the ER (14), (15), (16); the enzyme is homotetrameric (17) and contains 9 TMDs, with the active site His located within TMD #7 (18). The recombinant human ACAT1 (hACAT1) expressed in Chinese hamster ovary (CHO) cells has been solubilized in zwitterionic detergent CHAPS and purified several thousand-fold to homogeneity (19). With the purified enzyme, kinetic studies showed that the cholesterol substrate saturation curves, assayed either in mixed micelles or in reconstituted vesicles was sigmoidal, while the oleoyl-coenzyme A substrate saturation curve was hyperbolic, suggesting that ACAT1 is an allosteric enzyme activated by its own substrate cholesterol (19). Upon activation by cholesterol, the enzyme becomes promiscuous, and is able to accommodate a variety of sterols with 3-beta OH at ring A as its substrates (20), (21). A major drawback of the CHO cell expression system for purifying ACAT1 is that, only a low quantity of ACAT1 protein could be obtained (19). The sparse amount of purified protein available has hampered the research progress of ACAT1 structure- function analysis. We have sought to increase hACAT1 yield by using various other expression systems that include E. Coli, yeast, and the baculovirus-infected insect cells, but were unsuccessful. In the current work, we report that hACAT1 can be expressed in H293 cells at levels much higher levels than that in the CHO cells. We next developed an efficient purification procedure to purify the recombinant hACAT1 from H293 cells to homogeneity. The improved expression and purification procedure enabled us to obtain enough purified protein to demonstrate that hACAT1 is a highly fluorescent protein. We have exploited this feature by performing binding studies between hACAT1 and its substrates.
EXPERIMENTAL PROCEDURES
Materials
The rabbit polyclonal antibodies (DM10, DM102) against the N-terminal fragment (1-131) of human ACAT1 were described previously (14). Anti-FLAG M2 antibody, anti-FLAG M2 affinity gel, the 3x Flag peptide, CHAPS, taurocholate, oleoyl CoA, stearoyl CoA, egg PC, cholesteryl oleate, cholesterol, fatty acid-free bovine serum albumin, and protease inhibitor cocktails were all from Sigma. Ni-NTA His-Bind Resin came from Novagen. Fugene 6 was from Roche. The software program PRISM 5 was from GraphPad. [3H] cholesterol came from Perkin Elmer. [3H] oleoyl-coenzyme A was synthesized as described (22).
Cell culture
The HEK293S cell line was kindly provided by Dr. Philip Reeves (23). Cells were grown as monolayers in DMEM supplemented with 10% new born serum (NBS) at 37° in a 5% CO2 incubator.
Construction of plasmid HisACAT1/Flag and its expression in H293 cells
To aid in enzyme purification, a Flag octapeptide (DYKDDDDK, 1012 dalton) was inserted at the C terminus of His ACAT1 cDNA (18), which contains a fragment of 6-histidine (His) tag and the enterokinase cleavage recognition sequence (35 a.a. and 4057 dalton) inserted at the N terminus of human ACAT1 (19). This fragment (HisACAT1/Flag) was then ligated into the mammalian expression vector pAG3-Zeo (24), using the BamH I and Apa I cloning sites. This plasmid was transfected into HEK293S, individual stable clones were isolated by selecting cells resistant to zeocin at 400 μg/ml.
Purification of the HisACAT1/Flag protein
HEK293s stably expressing HisACAT1/Flag were seeded in 55 of 145 mm dishes for 2–3 days until the cells reached at confluency. Cells were rinsed 2x with PBS, and harvested by directly solublilizing the cells with Buffer A (1M KCl, 2.5% CHAPS in 50 mM KH2PO4 buffer at pH 7.8; 1 ml/dish). The detergent solubilized cell extracts were subject to 100,000g spin for 1 h at 4°; the solubilized enzyme preparation was loaded onto a 20-ml size His.Bind resin. The column was washed by using 4-column volumes of 20 mM imidazole in Buffer B (0.5 M KCl, 0.5% CHAPS in 50 mM KH2PO4 buffer at pH 7.8). The fusion protein was eluted off the column by using 2 column volumes of 500 mM imidazole in Buffer B. The eluate was then applied to a 5-ml FLAG M2 affinity gel and allowed to flow by gravity. After extensive buffer washes using Buffer B, the HisACAT1/Flag fusion protein was eluted off the column by three column volumes of 100 μg/ml FLAG peptide in Buffer B. The purified fusion protein could be stored at −80° for at least 6 months without detectable loss in enzyme activity.
ACAT enzyme assay
To monitor enzyme activity during enzyme purification, the enzyme solubilized in the detergent CHAPS was assayed in preformed taurocholate/cholesterol/phosphatidyl choline (PC)-mixed micelles as described previously (25), with a final concentration of taurocholate at 9.3 mM, PC at 11.2 mM, and cholesterol at 1.6 mM. The amount of mixed micelle solution was used to dilute the detergent presented in the enzyme preparation, so the final CHAPS/PC molar ratio was less than 0.4. The fatty acyl-CoA substrate saturation curves and cholesterol substrate saturation curves were performed under the same conditions as described previously (25).
Intrinsic Fluorescence measurement
Fluorescence measurements were generated by using an ISS PC1 photo counting fluorescence spectrophotometer (model 90095). This instrument has continuously reproducible slits ranging from 0.4 nm to 32 nm bandpass. The excitation slit width we set was at 2 nm. The wavelength for excitation was set at 295 nm in order to minimize the contribution of tyrosine residues to the fluorescence. Purified HisACAT1/Flag was concentrated by using 30K Amicon centrifugal filters such that final concentration of the protein was 100–200 ng/μl (1.5 to 3 μM), and stored at −80° till usage. Unless stated otherwise, the fluorescence measurements were performed at pH 7.8 with 50 mM potassium phosphate, 0.5 M KCl, and 8.13 mM CHAPS. Sterol (cholesterol, epicholesterol, coprostanol, and epicoprostanol) was prepared as CHAPS:PC:sterol-mixed micelles (with CHAPS at 8.13 mM, PC at 4 mM, and with varying concentrations of sterols as indicated), and stored at 20° in the dark till usage. The fatty acyl CoAs were dissolved in 20 mM sodium acetate at pH 6.4 as a 2 mM stock and stored at −80° till usage. Before the experiment started, all reagents were kept on ice in the dark. To begin the experiment, 50 μl of mixed micelles without or with sterols were added into a Hellma microcuvette (Type 105.251-QS) with 3-mm light path. 25 μl of ACAT1 protein (in 8.13 mM CHAPS and 0.5 M KCl) was then added and rapidly mixed. Fluorescence was monitored within 15 s of adding the enzyme. The sample compartment of the instrument was maintained at 20°. The fluorescence emission spectrum was scanned in 2 min between 310 to 410 nm. The differences in fluorescence intensity at 10 intervals within 325 nm to 335 nm were averaged in order to calculate the ΔF value between the ligated protein vs that of the unligated protein.
Gel electrophoresis and staining
Samples were run on 8% SDS-PAGE as described previously (25). The gels were stained with SilverQuest Silver Staining Kit from Invitrogen.
RESULTS
Expression and Purification of recombinant hACAT1 (HisACAT1/Flag) in H293 cells
We transfected the H293 cells with the mammalian expression vector pAG3 that contained the hACAT1 tagged with 6His at the N-terminal and Flag at the C-terminus (designated as HisACAT1/Flag) as the insert. Various clones that stably express the recombinant protein were then isolated (see Materials and Methods). Western blotting was used to monitor the hACAT1 protein expression level. The results show that the tagged hACAT1, with an apparent molecular weight of 56 kDa in SDS-PAGE, can be amply expressed in H293 cells (Fig. 1A; rightmost two lanes). The expression level of the hisACAT1/Flag shown in Fig. 1A is representative of several stable clones independently isolated from H293 cells. H293 cell is a human cell line and expresses (untagged) hACAT1 endogenously (Fig. 1A; the fifth and sixth lanes from the left), with an apparent molecular weight of 50 kDa. The endogenous hACAT1 could also be detected in the H293 cells that stably express HisACAT1/FLAG, especially when larger amount of cellular protein (50 μg) was employed in the Western analysis (Fig. 1A; last lane from the left). Other results described in Fig. 1A show that the clones His ACAT1 (the first two lanes), and the (untagged) hACAT1 (third and fourth lanes) stably expressed in CHO cells exhibit an apparent MW of 56 kDa or 50 kDa respectively as expected (19). In a separate experiment, we monitored the ACAT1 expression levels in CHO cells or in H293 cells by using antibodies against ACAT1 (Fig. 1B; top panel) or using antibodies against Flag (Fig. 1B; bottom panel). The results show that the HisACAT1/Flag can also be detected by the Flag antibodies as a broad, 56 kDa protein band. Based on the average of several experiments, we estimate that in H293 cells, the HisACAT1/Flag is expressed at protein levels approximately 20 times as high as the endogenous hACAT1. We had previously reported that relative high protein expression level of HisACAT1 could be achieved by using recombinant baculovirus infection of SF9 cells (26) or H5 cells (27). Here we performed Western blotting and compared the relative ACAT1 protein expression levels in baculovirus infected H5 cells vs that in the H293 cells stably or transiently expressing the HisACAT1/Flag plasmid. The results (Fig. 1C) show that the His ACAT1 expression levels in baculovirus infected H5 cells and the H293 cells stably expressing the HisACAT1/Flag are comparable (Lanes 3, 4 vs Lanes 7, 8). Additional results showed that in H293 cells, the HisACAT1/Flag expression level is higher in the stable clone than in the cells that are transiently transfected with the HisACAT1/Flag plasmid (Fig. 1C; Lanes 7, 8 vs Lanes 9, 10).
Fig. 1.

Comparison of the tagged (HisACAT1 or HisACAT1/Flag) or the untagged (hACAT1) human ACAT1 protein levels in various expression systems by Western blotting. A & B. CHO cells vs H293 cells. C. CHO cells, baculovirus infected insect H5 cells, or H293 cells.
We next compared the ACAT specific enzyme activity expressed in CHO cells vs that in the H293 cells, by using cell homogenates solubilized in the detergent CHAPS as the enzyme source. The results (Table 1) show that the enzyme activity of a stable clone of H293 cells expressing HisACAT1/Flag is about 9–10 times higher than that of a stable clone of CHO cells either expressing hACAT1 or expressing HisACAT1. The result also shows that the endogenous ACAT activity in the nontransfected H293 cells is less than 5% that of the stable clone expressing HisACAT1/Flag.
TABLE 1.
| Source | ACAT Specific Activity (pmole/min/mg) |
|---|---|
| AC29 | 0.4 |
| HEK293 | 37.2 |
| hACAT1 in CHO | 131.6 |
| HisACAT1 in CHO | 116.5 |
| HisACAT1/Flag in HEK293 | 1199 |
The cell extracts were solubilized in 1M KCl and 2.5% CHAPS and assayed in cholesterol/PC/taurocholate mixed micelles.
Encouraged by the results described above, we used the monolayers of H293 cells stably expressing HisACAT1/Flag as the source to purify the enzyme. The purification procedure (described in detail in Materials and Methods) is a modification of the procedure previously described (19). The major difference occurs at the last purification step. Previously, we had employed the monoclonal antibody against hACAT1 as the affinity probe for column chromatography, and eluted the ACAT1 off the column by using a buffer at pH 3–3.5. To avoid using the acidic pH condition which may cause partial enzyme denaturation, we re-designed the recombinant hACAT1 construct by placing the Flag tag at the C-terminal of hACAT1, and employed the monoclonal antibody against Flag as the affinity probe in the second column chromatography step. In this manner, the enzyme could be eluted off the column by using an eluting buffer that contains the Flag peptide at neutral pH. Table 2 summarizes the results of two representative experiments. The total recovery in enzyme units is approximately 7%. The purity of the recombinant hACAT1 is essentially homogeneous, as judged by SDS-PAGE and stained with silver (Fig. 2).
TABLE 2.
| Recovery of ACAT enzyme activity during purification | |
|---|---|
| Whole cell extract | 100% |
| Solubilized enzyme | 97 |
| Nickel column chromatography | 21 |
| Flag column chromatography | 32 |
| Total recovery | 7 |
| Total ACAT unit (nmole/min) | 118 |
| Total ACAT1 protein recovered | 250 μg |
55 of 145 cm2 dishes of H293 cells stably expressing HisACAT1/Flag were employed as the starting material.
Fig. 2.
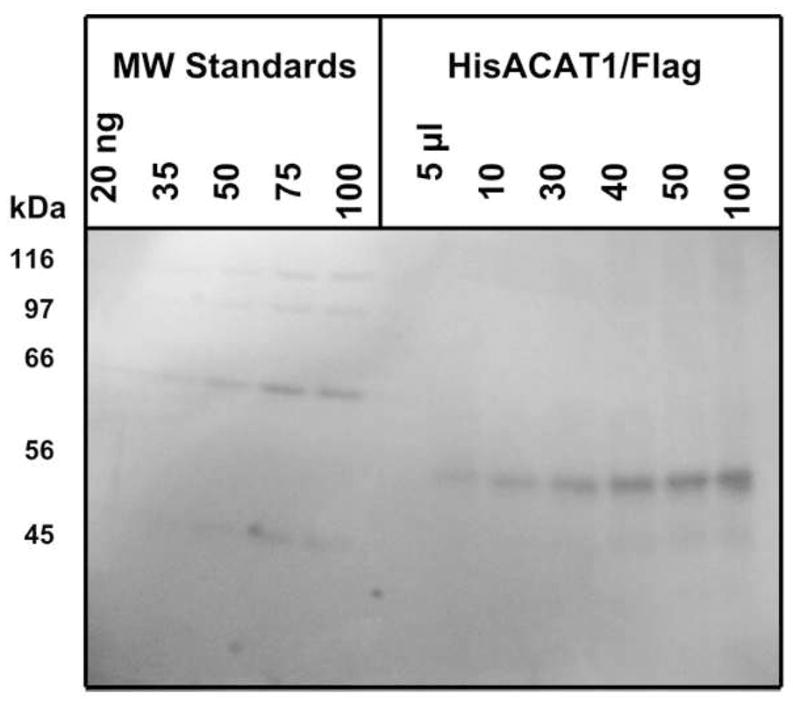
Assessment of the purity of HisACAT1/Flag protein by SDS-PAGE and silver staining. Left lanes contained increasing amount of molecular weight standards (from Sigma); right lanes contained increasing amounts of HisACAT1/Flag at the end of the purification procedure.
Intrinsic Fluorescence of hACAT1
hACAT1 contains 550 amino acids; 15 of them are tryptophan (W) and 29 as tyrosine residues. To avoid the fluorescence contributed by tyrosine, we set the excitation at 295 nm, and monitored the emission of fluorescence from 310–410 nm. Fig. 3A shows the fluorescence emission spectrum of the purified hACAT1 dispersed in 0.5% CHAPS. The spectrum is characterized by a single peak centered at 330 nm, due to tryptophan fluorescence of the protein. We tested the effects of pH on ACAT1 fluorescence; the result showed that the fluorescence intensities of the protein gradually increased when the pH values increased from 6 to 9; however, when the pH value increased from 9 to 10, a 24% decrease in fluorescence intensity occurred (Fig. 3A). We noted that quenching of the protein fluorescence signal occurs gradually. When measuring samples at 20° in the dark and at various pHs as indicated (from 6–10), approximately 10% of the signal is lost in 15 min (Fig. 3B), presumably due to photo-bleaching of the protein fluorescence. We also tested the effect of KCl on ACAT1 fluorescence. The result showed that KCl added at 0.25 M or higher concentrations significantly increased the fluorescence intensities of the protein; at 1 M KCl, the intensity was 2.2 fold higher than the value in the absence of KCl (Fig. 3C). This observation correlates well with our previous observation that KCl added at 0.5 to 1 M concentration increases the enzyme activity of the detergent solubilized ACAT1 (19). Under conditions without or with high KCl, the fluorescence signal gradually decreases, with 8% loss in 5 min and 12 % in 15 min. (Fig. 3D). To minimize the quenching in fluorescence intensity, the fluorescence spectrum of the protein was taken rapidly (within 10–15 s) after the protein was added to the cuvette that already contains the substrate (as described in the Methods section).
Fig. 3.
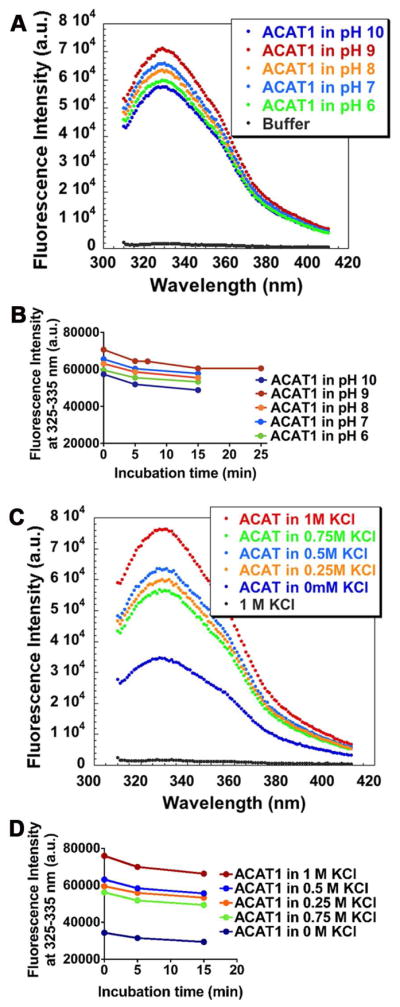
The effects of pH and KCl on intrinsic fluorescence of HisACAT1/Flag. A. The effects of varying pH of buffer from 6 to 10 as indicated. Buffers used: 50 mM citrate for buffer 6; 50 mM phosphate for pH 7 and 8, glycine/NaOH for pH 9 and 10. B. The stabilities of HisACAT1/Flag fluorescence intensity at various pH conditions. C. The effects of varying KCl concentrations as indicated. Buffer of pH 7.8 was employed. The background fluorescence of buffers alone (shown at the bottom) is essentially negligible. D. The stabilities of HisACAT1/Flag fluorescence intensity at various KCl concentrations. The pH was at 7.8.
Changes in intrinsic Fluorescence of hACAT1 upon binding to fatty acyl-coenzyme A or upon binding to sterol
Prior to conducting binding experiments, we first conducted steady-state enzyme kinetic experiments, using purified HisACAT1/Flag as the enzyme source, and either oleoyl (18:1) CoA or stearoyl (18:0) CoA as the variable substrate, at constant, saturating level of cholesterol in the CHAPS/PC mixed micelles. The result (Fig. 4A) showed that the Km for oleoyl CoA is 1.3 μM, and 6.4 μM for stearoyl CoA; the Vmax value for oleoyl CoA is 2.4 fold higher than for stearoyl CoA. These results confirm and extend previous studies (28), demonstrating that ACAT1 prefers oleoyl CoA to stearoyl CoA as the substrate. We next conducted binding studies by monitoring the effect of increasing concentrations of oleoyl CoA on the intrinsic fluorescence of HisACAT1/Flag. The result (Fig. 4B) shows that while the peak of the spectrum remained unaltered, the peak height is increased by approximately 32%, with respect to the unliganded ACAT1 protein. Parallel experiment showed that stearoyl CoA added at increasing concentrations also caused increases in the intrinsic fluorescence of HisACAT1/Flag. However, the maximal change in the peak of the spectrum is much smaller (5% with respect to the unliganded protein). These results (Fig. 4C) showed that the oleoyl CoA induced fluorescence change is specific and saturable. We analyzed the data in Fig. 4C for a simple bimolecular dissociation equilibrium using the Prism program. The results show that the dissociation constant for oleoyl CoA is 1.9 μM. The changes caused by stearoyl CoA were too small to derive a reliable dissociation constant.
Fig. 4.

Substrate saturation and binding studies of fatty acyl-CoAs with HisACAT1/Flag as the enzyme source. A. Oleoly CoA and stearoyl CoA substrate saturation curves. Results are representative of two separate experiments. The curves are plotted as hyperbolic. B. A representative intrinsic fluorescence spectra of hACAT1 in response to increasing concentrations of oleoyl CoA (abbreviated as OA). C. Binding curves of oleoyl CoA and stearoyl CoA as monitored by changes in intrinsic fluorescence of HisACAT1/Flag. Results are the composite of 2 separate experiments; the curves are plotted by using the one site-specific binding program. The Prism software program was used for curve plottings.
We had previously conducted steady state kinetic studies and demonstrated that cholesterol is as an efficient substrate as well as an efficient activator, while epicholesterol (which contains the OH moiety at 3 alpha) or enantiomeric cholesterol (which is the mirror image of cholesterol), is neither a substrate nor an activator for ACAT1 (21). Here we used the purified HisACAT1/Flag as the enzyme source and conducted cholesterol substrate saturation curve, by varying the cholesterol concentration from 5 to 1600 μM, with oleoyl CoA concentration kept at 70 μM. The result showed that the shape of the cholesterol saturation curve is sigmoidal, confirming our previous study when the hACAT1 without the Flag tag was used as the enzyme source (19). We next performed the binding experiment, by monitoring the effect of increasing concentrations of cholesterol, from 10 to 600 μM, on the intrinsic fluorescence of HisACAT1/Flag. The results (Fig. 5B) show that the peak height is positively altered by cholesterol in a concentration dependent manner, reaching up to 35% with respect to unliganded ACAT1 protein. We estimate that the cholesterol concentration that causes half maximal spectral change is 35 μM. We conducted a parallel experiment by using epicholesterol as the ligand, and showed that epicholesterol at similar concentrations examined (from 0.5 to 500 μM) also caused a positive change in the peak height of the spectrum. However, the maximal changes in the peaks of the spectrum caused by epicholesterol, especially at higher sterol concentrations, are much smaller than those caused by cholesterol. Similar to the result obtained when stearoyl CoA was tested as the ligand, the changes caused by epicholesterol were too small to derive a reliable binding curve. We next compared the changes in the intrinsic fluorescence of ACAT1 caused by cholesterol, epicholesterol, coprostanol, or epicoprostanol as the ligand. The result (Figure 6) showed that at 5 μM or 500 μM, the change caused by cholesterol is much larger than the changes caused by either one of the other 3 sterols.
Fig. 5.
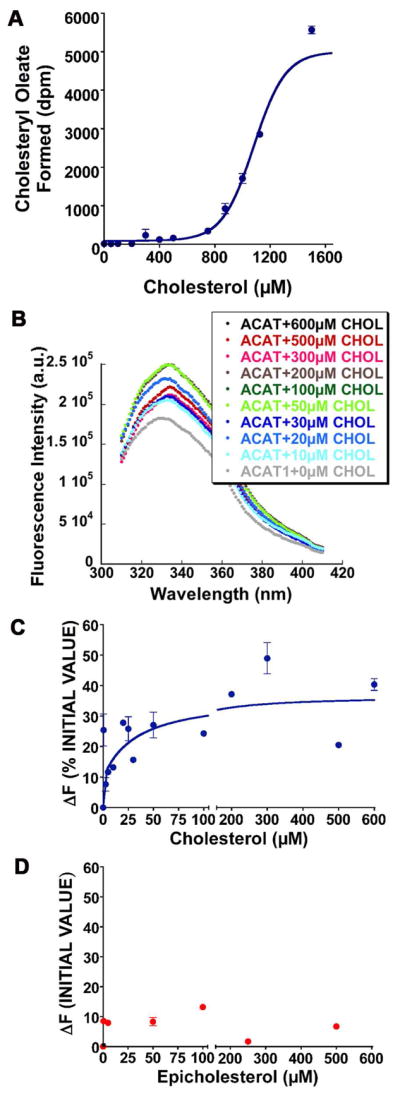
Substrate saturation and binding studies of sterols with HisACAT1/Flag as the enzyme source. A. Cholesterol substrate saturation curve. The cholesterol concentrations varied from 5 to 1600 μM, with oleoyl CoA concentration kept at 70 μM. The curve is plotted as sigmoidal. B. A representative intrinsic fluorescence spectra of HisACAT1/Flag in response to increasing concentrations of cholesterol (CHOL). C. Binding curve of cholesterol as monitored by changes in intrinsic fluorescence of hACAT1; the cholesterol concentrations varied from 0.5 to 600 μM. Results are composite of 5 separate experiments. The curves are plotted by using the two sites-specific binding program. D. Binding curve of epicholesterol as monitored by changes in intrinsic fluorescence of HisACAT1/Flag. The epicholesterol concentration varied from 0.5 to 500 μM. Results are the composite of 2 separate experiments. The curves are plotted by using the one site-specific binding program. The Prism software program was used for curve plottings.
Fig. 6.

% changes in intrinsic fluorescence of ACAT by adding various sterols. Experiment was conducted as described in Fig. 5c, d. Values were averages of duplicates with deviations less than 10% of the mean.
DISCUSSION
ACAT1 and several of its homologs in the MBOAT family are potential drug targets for treating various diseases, and it is important to carry out structure- function analysis of these enzymes. In the current work, we report the purification of hACAT1 expressed in H293 cells. Based on average of 9 experiments, we obtained 200+/− 40 μg pure hACAT1 protein with 120+/− 20 nmol/min enzyme units, from 55 of 145 cm2 dishes of H293 cells that stably express HisACAT1/Flag. Previously, we purified hACAT1 from the same number of dishes of CHO cells stably expressing the HisACAT1 to homogeneity with 4.8 nmol/min enzyme units (19). The current method thus represents more than 20-fold gain in enzyme units than the previous method. His hACAT1 expressed in baculovirus infected H5 cells could also be purified to homogeneity (27). However, the overall recovery of enzyme activity was only approximately 1%; the large loss in activity occurred because the majority of the enzyme activity failed to be bound to the nickel column (results not shown). In both the CHO cell and the H293 cell expression systems, the total yield in enzyme unit at the end of the purification procedure is approximately 7%. In the current work, we attached a Flag tag at the C-terminal of hACAT1, and used the Flag peptide dissolved in buffer at neutral pH to elute the ACAT1 off the affinity column; this elution condition is much milder than the one employed previously (19).
The expression and purification system reported here provided us with enough pure ACAT1 protein to conduct binding studies between the enzyme and fatty acyl-CoAs by using difference intrinsic fluorescence spectroscopy. The results show that oleoyl coA binds to ACAT1 with high affinity. The dissociation constant for oleoyl CoA is 1.9 μM. The Kd for oleoyl CoA is similar to its apparent Km (1.3 μM), suggesting that the enzyme binds to oleoyl CoA and reaches equilibrium relatively rapidly, while catalysis occurs relatively slow and constitutes the rate-limiting step. The changes in stearoyl CoA observed were too small to derive a reliable dissociation constant. The Vmax for these two substrates differed by 2.4 fold. These results suggest that upon binding to oleoyl CoA, large structural change(s) within the ACAT1 occur to increase the catalytic efficiency of the enzyme.
We also showed that cholesterol caused significant positive changes in the ACAT1 fluorescence spectrum in a concentration dependent manner. Parallel experiments show that the other three cholesterol analogs epicholesterol, coprostanol, and epicoprostanol also elicit positive spectrum changes in ACAT1; but the magnitude of changes induced by either one of these analogs is much smaller than cholesterol. Cholesterol and epicholesterol share the same steroid ring structure and the same iso-octyl side chain at ring D, but differ at the orientation of the 3-OH moiety at ring A. Coprostanol contains the steroid rings A and ring B in the trans configuration (instead of a cis- configuration as in cholesterol). Epicoprostanol differs from coprostanol at the orientation of the 3-OH moiety at ring A. Cholesterol and epicholesterol interact with membrane phospholipids biophysically and affect membrane properties in very similar manners (29), (30). Coprostanol also interacts with membrane phospholipids, but in a manner different from that of cholesterol (30). In biological membranes, cholesterol, but not epicholesterol, can directly binds to a variety of membrane proteins in a stereospecific manner to affect their functions (29), (31), (32), (33), (34). Consistent with this concept, our current results suggest that sterol binding to ACAT1 occurs in two different modes. The first is an indirect one, mediated through its binding to phospholipids, which in turn interacts with the transmembrane domains of ACAT1. The second one involves the direct binding of sterol to certain residues in ACAT1; the direct binding is governed at least in part by the 3beta-OH moiety in ring A. The overall change of the ACAT1 fluorescence spectrum caused by cholesterol may be the composite of alteration caused by cholesterol’s ability to bind to ACAT1 directly, and the alteration caused by cholesterol’s ability to interact with phospholipid to affect ACAT1 structural property indirectly. The direct, stereospecific interaction between cholesterol and ACAT1 causes significant structural changes of the enzyme. In the future, simultaneously monitoring the effects of various sterols in altering the physical properties of the micelles vs their effects in altering structural changes of ACAT1 can further test the validity of this interpretation.
ACAT1 contains 9 transmembrane domains (TMDs) (18). Site-specific mutagenesis and disulfide cross-linking experiments suggested that several residues (F453, A457, H460, and F479), located within TMD7 or TMD8 respectively played critical roles in maintaining ACAT1 enzyme activity (35). In the future, the procedures described here will be employed to test whether any of these residues is involved in binding to cholesterol and/or to oleoyl CoA. Presently among the MBOAT enzyme family, ACAT1 is the only one that has been purified to homogeneity. The new information described in our current work may be applicable to study other MBOAT members in general.
Acknowledgments
We thank Dr. Gustav E. Lienhard for careful reading of the manuscript. We thank Dean R. Madden, and Larry C. Myers at Dartmouth Medical School and members of the Chang laboratory for helpful discussions during the course of this work. We thank Oneil N. Gardner for participating in the enzyme purification work as an intern of the SURF program.
ABBREVIATIONS
- ACAT
acyl coenzyme A: cholesterol acyltransferase
- CHO
Chinese hamster ovary
- CoA
coenzyme A
- CHAPS
3-[(3 Cholamidopropyl)dimethylammonio]-1-propanesulfonate
- PC
phosphatidyl choline
- TMD
transmembrane domain
- His
histidine
- KCl
potassium chloride
Footnotes
This work is supported by an NIH grant RO1 HL60306 to TYC and CCYC, and an NIH grant RO1 GM069818 to HNH.
References
- 1.Chang CC, Huh HY, Cadigan KM, Chang TY. Molecular cloning and functional expression of human acyl-coenzyme A:cholesterol acyltransferase cDNA in mutant Chinese hamster ovary cells. J Biol Chem. 1993;268:20747–20755. [PubMed] [Google Scholar]
- 2.Cases S, Novak S, Zheng YW, Myers HM, Lear SR, Sande E, Welch CB, Lusis AJ, Spencer TA, Krause BR, Erickson SK, Farese RV., Jr ACAT-2, a second mammalian acyl-CoA:cholesterol acyltransferase. Its cloning, expression, and characterization. J Biol Chem. 1998;273:26755–26764. doi: 10.1074/jbc.273.41.26755. [DOI] [PubMed] [Google Scholar]
- 3.Anderson RA, Joyce C, Davis M, Reagan JW, Clark M, Shelness GS, Rudel LL. Identification of a form of acyl-CoA:cholesterol acyltransferase specific to liver and intestine in nonhuman primates. J Biol Chem. 1998;273:26747–26754. doi: 10.1074/jbc.273.41.26747. [DOI] [PubMed] [Google Scholar]
- 4.Oelkers P, Behari A, Cromley D, Billheimer JT, Sturley SL. Characterization of two human genes encoding acyl coenzyme A: cholesterol acyltransferase-related enzymes. J Biol Chem. 1998;273:26765–26771. doi: 10.1074/jbc.273.41.26765. [DOI] [PubMed] [Google Scholar]
- 5.Chang TY, Li BL, Chang CC, Urano Y. Acyl-coenzyme A:cholesterol acyltransferases. Am J of Physiol. 2009;297:E1–9. doi: 10.1152/ajpendo.90926.2008. [DOI] [PMC free article] [PubMed] [Google Scholar]
- 6.Das A, Davis MA, Tomoda H, Omura S, Rudel LL. Identification of the interaction site within acyl-CoA:cholesterol acyltransferase 2 for the isoform-specific inhibitor pyripyropene A. J Biol Chem. 2008;283:10453–10460. doi: 10.1074/jbc.M709460200. [DOI] [PMC free article] [PubMed] [Google Scholar]
- 7.Ikenoya M, Yoshinaka Y, Kobayashi H, Kawamine K, Shibuya K, Sato F, Sawanobori K, Watanabe T, Miyazaki A. A selective ACAT-1 inhibitor, K-604, suppresses fatty streak lesions in fat-fed hamsters without affecting plasma cholesterol levels. Atherosclerosis. 2007;191:290–297. doi: 10.1016/j.atherosclerosis.2006.05.048. [DOI] [PubMed] [Google Scholar]
- 8.Cases S, Smith SJ, Zheng YW, Myers HM, Lear SR, Sande E, Novak S, Collins C, Welch CB, Lusis AJ, Erickson SK, Farese RV., Jr Identification of a gene encoding an acyl CoA:diacylglycerol acyltransferase, a key enzyme in triacylglycerol synthesis. Proc Natl Acad Sci USA. 1998;95:13018–13023. doi: 10.1073/pnas.95.22.13018. [DOI] [PMC free article] [PubMed] [Google Scholar]
- 9.Hofmann K. A superfamily of membrane-bound O-acyltransferases with implications for Wnt signaling. Trends Biochem Sci. 2000;25:111–112. doi: 10.1016/s0968-0004(99)01539-x. [DOI] [PubMed] [Google Scholar]
- 10.Yang J, Brown MS, Liang G, Grishin NV, Goldstein JL. Identification of the acyltransferase that octanoylates ghrelin, an appetite-stimulating peptide hormone. Cell. 2008;132:387–396. doi: 10.1016/j.cell.2008.01.017. [DOI] [PubMed] [Google Scholar]
- 11.Gutierrez JA, Solenberg PJ, Perkins DR, Willency JA, Knierman MD, Jin Z, Witcher DR, Luo S, Onyia JE, Hale JE. Ghrelin octanoylation mediated by an orphan lipid transferase. Proc Natl Acad Sci USA. 2008;105:6320–6325. doi: 10.1073/pnas.0800708105. [DOI] [PMC free article] [PubMed] [Google Scholar]
- 12.Riekhof WR, Wu J, Jones JL, Voelker DR. Identification and characterization of the major lysophosphatidylethanolamine acyltransferase in Saccharomyces cerevisiae. J Biol Chem. 2007;282:28344–28352. doi: 10.1074/jbc.M705256200. [DOI] [PubMed] [Google Scholar]
- 13.Shindou H, Shimizu T. Acyl-CoA:lysophospholipid acyltransferases. J Biol Chem. 2009;284:1–5. doi: 10.1074/jbc.R800046200. [DOI] [PubMed] [Google Scholar]
- 14.Chang CCY, Chen J, Thomas MA, Cheng D, Del Priore VA, Newton RS, Pape ME, Chang TY. Regulation and immunolocalization of acyl-coenzyme A: cholesterol acyltransferase in mammalian cells as studied with specific antibodies. J Biol Chem. 1995;270:29532–29540. doi: 10.1074/jbc.270.49.29532. [DOI] [PubMed] [Google Scholar]
- 15.Sakashita N, Miyazaki A, Takeya M, Horiuchi S, Chang cCY, Chang TY, Takahashi K. Localization of human acyl-coenzyme A:cholesterol acyltransferase-1 in macrophages and in various tissues. Am J Pathol. 2000;156:227–236. doi: 10.1016/S0002-9440(10)64723-2. [DOI] [PMC free article] [PubMed] [Google Scholar]
- 16.Khelef N, Soe TT, Quehenberger O, Beatini N, Tabas I, Maxfield FR. Enrichment of acyl coenzyme A:cholesterol O-acyltransferase near trans-golgi network and endocytic recycling compartment. Arterioscler Thromb Vasc Biol. 2000;20:1769–1776. doi: 10.1161/01.atv.20.7.1769. [DOI] [PubMed] [Google Scholar]
- 17.Yu C, Chen J, Lin S, Liu J, Chang CC, Chang TY. Human acyl-CoA:cholesterol acyltransferase-1 is a homotetrameric enzyme in intact cells and in vitro. J Biol Chem. 1999;274:36139–36145. doi: 10.1074/jbc.274.51.36139. [DOI] [PubMed] [Google Scholar]
- 18.Guo ZY, Lin S, Heinen JA, Chang CC, Chang TY. The active site His-460 of human acyl-coenzyme A:cholesterol acyltransferase 1 resides in a hitherto undisclosed transmembrane domain. J Biol Chem. 2005;280:37814–37826. doi: 10.1074/jbc.M508384200. [DOI] [PubMed] [Google Scholar]
- 19.Chang CCY, Lee CYG, Chang ET, Cruz JC, Levesque MC, Chang TY. Recombinant human acyl-CoA:cholesterol acyltransferase 1 (ACAT1) purified to essential homogeneity utilizes cholesterol in mixed micelles or vesicles in a highly cooperative manner. J Biol Chem. 1998;273:35132–35141. doi: 10.1074/jbc.273.52.35132. [DOI] [PubMed] [Google Scholar]
- 20.Zhang Y, Yu C, Liu J, Spencer TA, Chang CC, Chang TY. Cholesterol is superior to 7-ketocholesterol or 7 alpha-hydroxycholesterol as an allosteric activator for acyl-coenzyme A:cholesterol acyltransferase 1. J Biol Chem. 2003;278:11642–11647. doi: 10.1074/jbc.M211559200. [DOI] [PubMed] [Google Scholar]
- 21.Liu J, Chang CC, Westover EJ, Covey DF, Chang TY. Investigating the allosterism of Acyl Coenzyme A: cholesterol acyltransferase (ACAT) by using various sterols: In vitro and intact cell studies. Biochem J. 2005;391:389–397. doi: 10.1042/BJ20050428. [DOI] [PMC free article] [PubMed] [Google Scholar]
- 22.Bishop JE, Hajra AK. A method for the chemical synthesis of 14C-labeled fatty acylcoenzyme A’s of high specific activity. Anal Biochem. 1980;106:344–350. doi: 10.1016/0003-2697(80)90531-x. [DOI] [PubMed] [Google Scholar]
- 23.Reeves PJ, Kim JM, Khorana HG. Structure and function in rhodopsin: a tetracycline-inducible system in stable mammalian cell lines for high-level expression of opsin mutants. Proc Natl Acad Sci USA. 2002;99:13413–13418. doi: 10.1073/pnas.212519199. [DOI] [PMC free article] [PubMed] [Google Scholar]
- 24.Ikeuchi T, Dolios G, Kim SH, Wang R, Sisodia SS. Familial Alzheimer disease-linked presenilin 1 variants enhance production of both Abeta 1-40 and Abeta 1-42 peptides that are only partially sensitive to a potent aspartyl protease transition state inhibitor of “gamma-secretase”. J Biol Chem. 2003;278:7010–7018. doi: 10.1074/jbc.M209252200. [DOI] [PubMed] [Google Scholar]
- 25.Chang CC, Lee CY, Chang ET, Cruz JC, Levesque MC, Chang TY. Recombinant acyl-CoA:cholesterol acyltransferase-1 (ACAT-1) purified to essential homogeneity utilizes cholesterol in mixed micelles or in vesicles in a highly cooperative manner. J Biol Chem. 1998;273:35132–35141. doi: 10.1074/jbc.273.52.35132. [DOI] [PubMed] [Google Scholar]
- 26.Cheng D, Chang CC, Qu X, Chang TY. Activation of acyl-coenzyme A:cholesterol acyltransferase by cholesterol or by oxysterol in a cell-free system. J Biol Chem. 1995;270:685–695. doi: 10.1074/jbc.270.2.685. [DOI] [PubMed] [Google Scholar]
- 27.Yu C, Zhang Y, Lu X, Chen J, Chang CC, Chang TY. Role of the N-terminal hydrophilic domain of acyl-coenzyme A:cholesterol acyltransferase 1 on the enzyme’s quaternary structure and catalytic efficiency. Biochemistry. 2002;41:3762–3769. doi: 10.1021/bi0120188. [DOI] [PubMed] [Google Scholar]
- 28.Seo T, Oelkers PM, Giattina MR, Worgall TS, Sturley SL, Deckelbaum RJ. Differential modulation of ACAT1 and ACAT2 transcription and activity by long chain free fatty acids in cultured cells. Biochemistry. 2001;40:4756–4762. doi: 10.1021/bi0022947. [DOI] [PubMed] [Google Scholar]
- 29.Gimpl G, Burger K, Fahrenholz F. Cholesterol as modulator of receptor function. Biochemistry. 1997;36:10959–10974. doi: 10.1021/bi963138w. [DOI] [PubMed] [Google Scholar]
- 30.Xu X, London E. The effect of sterol structure on membrane lipid domains reveals how cholesterol can induce lipid domain formation. Biochemistry. 2000;39:843–849. doi: 10.1021/bi992543v. [DOI] [PubMed] [Google Scholar]
- 31.Romanenko VG, Rothblat GH, Levitan I. Modulation of endothelial inward-rectifier K+ current by optical isomers of cholesterol. Biophysical journal. 2002;83:3211–3222. doi: 10.1016/S0006-3495(02)75323-X. [DOI] [PMC free article] [PubMed] [Google Scholar]
- 32.Simons K, Ikonen E. How cells handle cholesterol. Science. 2000;290:1721–1726. doi: 10.1126/science.290.5497.1721. [DOI] [PubMed] [Google Scholar]
- 33.Westover EJ, Covey DF. The enantiomer of cholesterol. J Membr Biol. 2004;202:61–72. doi: 10.1007/s00232-004-0714-7. [DOI] [PubMed] [Google Scholar]
- 34.Gimpl G. Cholesterol-protein interaction: methods and cholesterol reporter molecules. Sub-cellular biochemistry. 2010;51:1–45. doi: 10.1007/978-90-481-8622-8_1. [DOI] [PubMed] [Google Scholar]
- 35.Guo ZY, Chang CC, Chang TY. Functionality of the seventh and eighth transmembrane domains of acyl-coenzyme A:cholesterol acyltransferase 1. Biochemistry. 2007;46:10063–10071. doi: 10.1021/bi7011367. [DOI] [PubMed] [Google Scholar]