

Abstract
Purpose
Phosphorylated histone H2AX (γH2AX) serves as a biomarker for formation of DNA double-strand break repair complexes. A quantitative pharmacodynamic immunofluorescence assay for γH2AX was developed, validated, and tested in human tumor xenograft models using clinically relevant procedures.
Experimental Design
The γH2AX immunofluorescence assay employs a novel data quantitation and image processing algorithm to determine the extent of nuclear-specific γH2AX staining in tumor needle biopsies and hair follicles collected from mice bearing topotecan-responsive A375 xenografts. Following method validation with the topoisomerase I (Top1) inhibitor topotecan, the assay was used to compare pharmacodynamic properties of three structurally related indenoisoquinoline Top1 inhibitors.
Results
γH2AX response to topotecan was quantified over a 60-fold dose range (0.016–1.0 times the murine single-dose maximum tolerated dose), and significant pharmacodynamic response was measured at the mouse equivalent of the 1.5 mg/m2 clinical dose as well as the lowest dose tested. Responses were within a time window amenable for biopsy collection in clinical trials. These studies enabled characterization of dose and time responses for three indenoisoquinolines, resulting in selection of two for clinical evaluation. γH2AX response to Top1 inhibitors in hair follicles was also observable above a minimal dose threshold.
Conclusions
Our γH2AX assay is sufficiently accurate and sensitive to quantify γH2AX in tumor samples and will be used in correlative studies of two indenoisoquinolines in a phase I clinical trial at the National Cancer Institute. Data suggest that hair follicles may potentially serve as a surrogate tissue to evaluate tumor γH2AX response to Top1 inhibitors.
Keywords: γH2AX, pharmacodynamics, validated assay, indenoisoquinolines, topotecan
Introduction
A validated pharmacodynamic assay is a fundamental component of early-phase proof-of-concept clinical trials of molecularly targeted agents where a pharmacodynamic endpoint serves as a study objective (1–3). Assay results can inform and expedite drug development decisions if the assay is sufficiently accurate, sensitive, and precise to result in statistical significance for changes in the pharmacodynamic target that are biologically significant (1, 4). An initiative of the National Cancer Institute’s (NCI) Division of Cancer Treatment and Diagnosis is to develop and validate “clinically ready” pharmacodynamic assays well in advance of first-in-human clinical studies to select the most promising new drugs for further evaluation1.
Validation of clinical biomarker assays in preclinical models replicates the sample collection, handling, and analytical procedures that will be employed in the clinical setting to ensure that reproducible results can be obtained by different laboratories. Variability attributable to the inherent molecular and histologic heterogeneity of each sample can be determined in preclinical tumor models to establish both whether target modulation is measurable and the extent to which a drug must modulate that target to demonstrate significant activity (5, 6). Method validation also ensures that the biopsy samples provided by patients for research purposes are handled according to the highest standards to allow meaningful analysis; this is especially important in phase 0 trials where pharmacologically active but non-therapeutic doses of an agent are administered to a small numbers of patients (6). Our first validated pharmacodynamic assay, an immunoassay for poly (ADP-ribose) (PAR), successfully demonstrated proof-of-concept in a phase 0 clinical trial measuring pharmacodynamic response to the PAR polymerase inhibitor ABT-888 in patients with cancer (4, 7). Our second validated method, measuring nuclear γH2AX levels in patient circulating tumor cells following chemotherapeutic treatment, was recently published and is being used in correlative studies in phase I trials at the NCI (8, 9). This study provided evidence of the specificity of the γH2AX response following treatment with traditional DNA-damaging chemotherapeutic agents such as topotecan and temozolomide versus anti-proliferation drugs that do not induce DNA damage (e.g., rapamycin).
Phosphorylation of histone H2AX (γH2AX) at serine 139 is one of the earliest markers for DNA double-strand breaks, and signal levels directly correlate with the number of breaks formed (10, 11). Thus, γH2AX has been suggested as a potential pharmacodynamic biomarker for assessing the activity of chemotherapeutic agents that inhibit double-strand break repair (12, 13). Treating cells with inhibitors of topoisomerase I (Top1), an enzyme involved in the relaxation of supercoiled DNA during replication and transcription, stabilizes the normally transient DNA-Top1 cleavage complex resulting in the formation of double-strand breaks at replication forks and transcription sites (11, 14, 15). The generation of γH2AX foci following drug treatment has been shown, in vitro, to begin within 1 hour of double-strand break formation at levels proportional to the number of breaks formed (16–19).
Although the literature on γH2AX as a metric for double-strand breaks induced by ionizing radiation is extensive (20, 21), less is known about the utility of γH2AX as a marker for monitoring chemotherapy-induced DNA damage. Banuelos and colleagues performed a feasibility study to monitor changes in γH2AX foci formation using an immunofluorescence-based assay on paraffin-embedded biopsies from patients with cervical cancer treated with cisplatin and ionizing radiation (22). Their study provided evidence that assaying γH2AX within the first few days after treatment is important to eliminate loss of signal once DNA repair begins and tumor-infiltrating normal cells begin to populate the tumor. Recent immunofluorescence-based γH2AX studies report fluorescent signal intensity in tissue sections; however, this approach can be problematic due to variable levels of background fluorescence (13, 23). Variability of intensity measurements can also arise during sample preparation, where section thickness and overlapping nuclei within tissue sections can affect fluorescence intensity. The γH2AX immunofluorescence assay described here uses mean intensity background autofluorescence to set signal intensity as a yes/no proposition, reducing overall background interference and measurement variance. Total positive nuclei are then quantified to yield a numeric estimate of the biomarker response.
Method validation for this study was performed using both positive and negative control tissues and a calibrator panel of topotecan-responsive xenograft biopsies to standardize assay performance across different clinical research sites while providing a measure of assay performance over time for quality control. In addition, tumor needle biopsies and tissue samples were collected and handled following standard operating procedures established for the clinical PAR immunoassay (7). The assay was then used to compare three non-camptothecin indenoisoquinoline Top1 inhibitors; previous in vitro studies indicate that these agents produce more persistent DNA-Top1 cleavage complexes than camptothecin or topotecan and have activity in camptothecin-resistant cell lines and the A375 human melanoma xenograft model (15, 18, 24, 25). Finally, skin biopsies in mice were collected following topotecan and indenoisoquinoline treatment to evaluate the potential use of hair follicles as surrogate tissues for measuring γH2AX response.
Materials and Methods
Cell lines and animal models
Cell lines and animal models used for method development, optimization, and validation are detailed in the Supplementary Data.
Drug administration
Topotecan (NSC 609699) was obtained through the NCI’s Developmental Therapeutics Program, and the indenoisoquinolines NSCs 724998, 725776, and 706744 were initially synthesized by Dr. Mark Cushman, Purdue University (26) and provided by the Developmental Therapeutics Program Repository, NCI. Detailed drug administration information can be found in the Supplementary Data.
Method optimization and validation
Sample collection and handling conditions were optimized to match the specimen handling conditions that could be met in the clinical setting at both the NCI Clinical Center and associated extramural NCI sites. The biopsy method employed was optimized to preserve protein phosphorylation status and tissue morphology, and has been successfully employed in several NCI clinical trials (24, 27). Methods from biopsy processing through paraffin embedding were developed to balance tissue morphology and fluorescence staining specificity. Details on method optimization and validation are detailed in the Supplementary Data.
Tumor biopsy and skin snip collection and slide preparation
Biopsies were performed as previously described (7). Details for biopsy and skin snip collection, fixation, and slide preparation are detailed in the Supplementary Data.
Antibody detection of γH2AX
The Certificate of Analysis for the biotinylated γH2AX monoclonal antibody JBW301 (Millipore Corp.) included Western blot data demonstrating its specificity. Prior to acceptance for use, JBW301 specificity was validated, and performance of specific lots of antibody was screened by Western blot and on calibrator slides as detailed in the Supplementary Data. Biotinylated γH2AX antibody binding was detected using Alexa-Fluor 488-labeled streptavidin (Invitrogen) and processed in a Bond-max™ Autostainer (Leica Microsystems). Detailed information on Bond-max™ Autostainer staining protocols including antibody dilutions, and antigen retrieval steps can be found in the Supplementary Data. Prolong Gold containing 4'-6-diamidino-2-phenylindole (DAPI; Molecular Probes) was then placed on the sections, and slides were cover slipped and allowed to dry for at least 1 hour in the dark before viewing. The adapted methodology for use on clinical samples is set forth in a standard operating procedure to be posted on the DCTD Web site2.
γH2AX assay instrumentation and image selection, capture, and quantitation
Assay instrumentation, image capture, quantitation, and quality control for both xenograft tumor biopsies and hair follicles are detailed in the Supplementary Data.
Calibrators and controls
Selection and preparation of calibrator and control slide panels are detailed in the Supplementary Data.
Statistical analysis
Regression analysis, Student’s t test, ANOVA, and descriptive statistics were performed with Microsoft Excel. ANOVA analysis was calculated with the significance level (alpha) set at 0.05 (confidence level = 95%) for a two-tailed test. P values up to 0.10, for these small group sizes, were reported in the tables. P values ≥ 0.10 were reported as not significant (NS).
Results
Assay instrumentation and image selection
The image acquisition software and procedure was initiated after the field selection process. Fields for acquisition were selected in phase contrast or in the DAPI (blue) channel. Criteria were evidence of good tissue morphology and nuclear integrity, and specifically excluded necrotic areas. Background fluorescence variation effects on assay measurements were controlled by the design of a macro that allowed dynamic scripting of the image capture criteria, and was incorporated into the Image-Pro Plus control program (see Supplementary Data). The dynamic range of intensity was established using γH2AX-negative areas on tissue section slides to calibrate the camera settings and match a pre-determined signal level on the light-response curve (background autofluorescence). Background was independently determined for each slide; this method allowed all slides to be examined against the same background fluorescence intensity. Selection of the γH2AX-positive response threshold was based on multiple computer-based analyses of vehicle-treated xenograft biopsies. This approach converts imaged nuclei (location of the specific γH2AX signal) into positive or negative events. Computer software was then used to score the biopsy images for percent nuclear area positive (%NAP). Quantitative characterization and estimated imprecision using this image analysis method are described in the Supplementary Data and Supplementary Table S2.
Controls and calibrator panel
Specificity of the biotinylated γH2AX monoclonal antibody, JBW301, was confirmed in each specimen run using murine testis and small intestine as positive and negative controls, respectively (28, 29). Murine testes serves as a positive control for the assay because of the presence of γH2AX at DNA double-strand breaks generated during meiotic recombination in the spermatocytes (30). Control and calibrator tissues were run on the same slides, and all tissues were subjected to the same probe antibody and reporter dye concentrations and incubation conditions. Few or no γH2AX-positive cells were detected in untreated small intestine (positive cells, when present, were restricted to the base of the crypts), whereas high numbers of γH2AX-positive cells were detected within the testis (Fig. 1A, upper panels). As expected, γH2AX-positive cells were observed within the intestinal crypts of mice 2 hours after a single dose of 0.32 MTD topotecan (Fig. 1A, lower left panel). The γH2AX level in the negative control tissue was set as the lower limit of detection (LLD) for the assay.
Fig. 1.
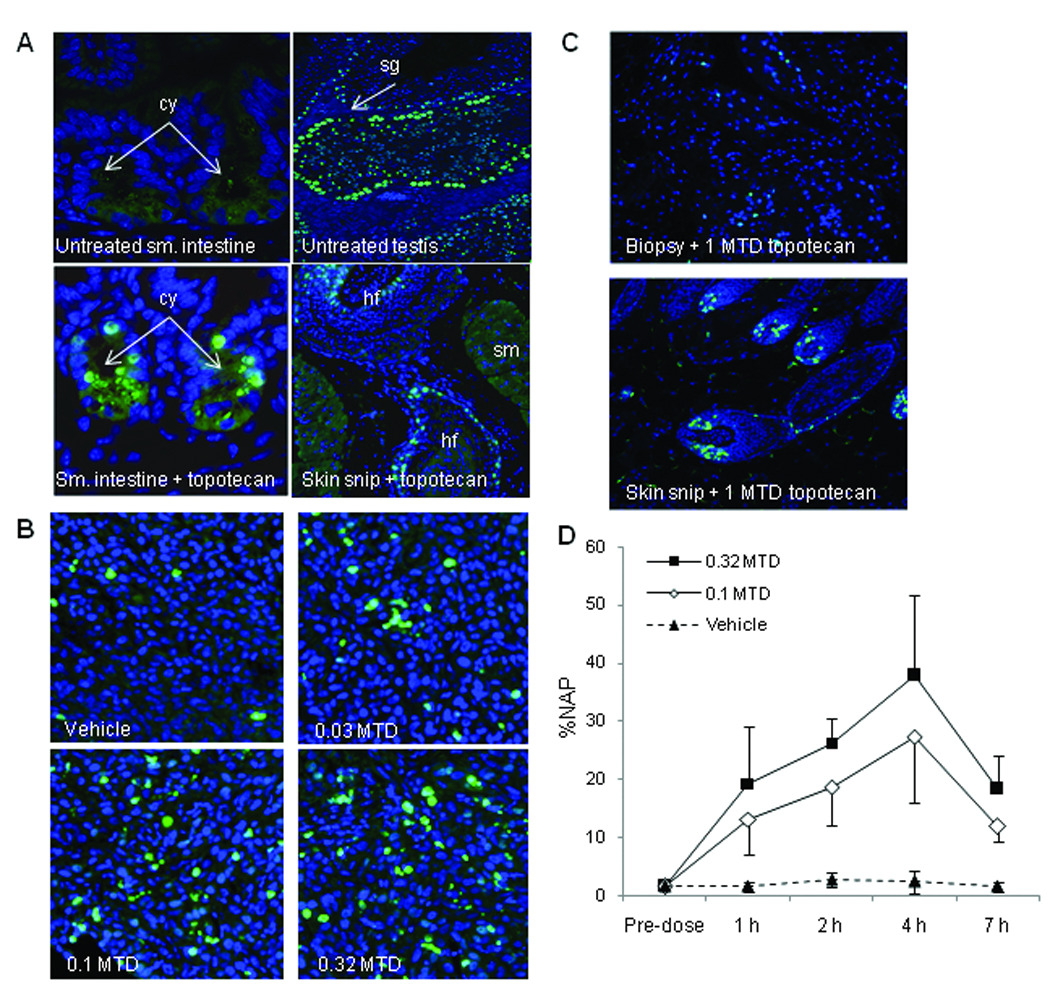
Induction of γH2AX in topotecan-responsive and non-responsive xenograft tumor biopsies and hair follicles from mice treated with topotecan. A. Assay specificity for γH2AX immunostaining of untreated mouse small intestine (negative control), untreated mouse testis (positive control), and mouse small intestine 2 hours after treatment with 0.32 MTD topotecan. The lower right panel is a representative section of γH2AX staining in hair follicles isolated from skin snip samples taken 2 hours after treatment with 0.32 MTD topotecan. Magnification, ×400. B. γH2AX-stained topotecan-responsive A375 xenograft biopsy samples 2 hours post-treatment with vehicle, 0.03, 0.1, and 0.32 MTD topotecan. Magnification, ×400. C. γH2AX staining in non-responsive SK-MEL-28 xenograft biopsy (upper) and hair follicle (lower) samples from the same animal 5 hours post-treatment with 1 MTD topotecan. Magnification, ×200. D. Mean percent nuclear area positive for γH2AX (%NAP) in A375 xenograft biopsies from mice treated with vehicle control or 0.1 or 0.32 MTD topotecan collected 1, 2, 4, and 7 hours post-dose; four mice per cohort. The mean %NAP for all topotecan-treated groups was statistically different from vehicle with a significance level of P ≤ 0.001, as determined by Student’s t test. MTD, maximum tolerated dose; cy, small intestine crypts; sg, spermatagonia; hf, hair follicle; sm, smooth muscle.
Biomarker Performance Modeling
Fitness for the intended purpose of γH2AX as a biomarker to measure DNA double-strand break damage induced by chemotherapy agents was established by determining the minimum change in γH2AX levels that could be measured after treatment with a known effective drug. Topotecan was selected to model biomarker performance because the drug produces DNA double-strand breaks by targeting the same Top1 molecule as the indenoisoquinolines. An additional consideration was that the NCI’s Biological Testing Branch has had extensive experience with topotecan and topotecan-responsive and non-responsive tumor models. Inspection of slides from topotecan-responsive A375 xenograft biopsies collected 1, 2, 4, and 7 hours after single-dose treatment with 0.03, 0.1, and 0.32 MTD topotecan revealed a dose-dependent γH2AX response (Fig. 1B; 2-hour time point shown), and served as the foundation for development of the quantitative method. In contrast, biopsies from non-responsive SK-MEL-28 xenografts displayed a minimal γH2AX response at 2 and 5 hours following single-dose treatment with 1 MTD topotecan (15 mg/kg), while hair follicles from the same mouse showed a strong γH2AX response (Fig. 1C, 5-hour time point shown); lower doses had no effect in SK-MEL-28 xenografts (data not shown).
Optimal sample collection time for peak γH2AX response was determined in mice with A375 xenografts treated with a single dose of 0.1 or 0.32 MTD topotecan. Biopsy samples were collected 1, 2, 4, and 7 hours after treatment (Fig. 1D). Maximal γH2AX response was evident at the 4-hour sampling time, after which the γH2AX response decreased, likely due to cell death or resolution of double-strand breaks. At all post-dose time points, the mean %NAP in A375 xenografts of topotecan-treated mice was significantly different statistically from that of vehicle control.
Inter-laboratory reproducibility
Two laboratories, the National Clinical Target Validation Laboratory (NCTVL; NCI, National Institutes of Health) and the Pathology/Histotechnology Laboratory (PHL; NCI-Frederick), performed the γH2AX immunofluorescence staining procedure on 75 matched xenograft slides (3–4 specimens/slide) to determine inter-laboratory slide processing, image acquisition, and analysis precision. The matched slides included A375 xenografts from mice treated with vehicle, 0.1 MTD topotecan, 0.32 MTD topotecan, and a range of indenoisoquinoline drugs and doses. Each laboratory stained and imaged a set of slides; slides were then exchanged and imaged at the alternate site. Image analyses and quantitation to determine the %NAP γH2AX from both sets of slides were performed by both laboratories; regression analysis of the data demonstrated a high degree of correlation between the sites (R2=0.939; Fig. 2).
Fig. 2.
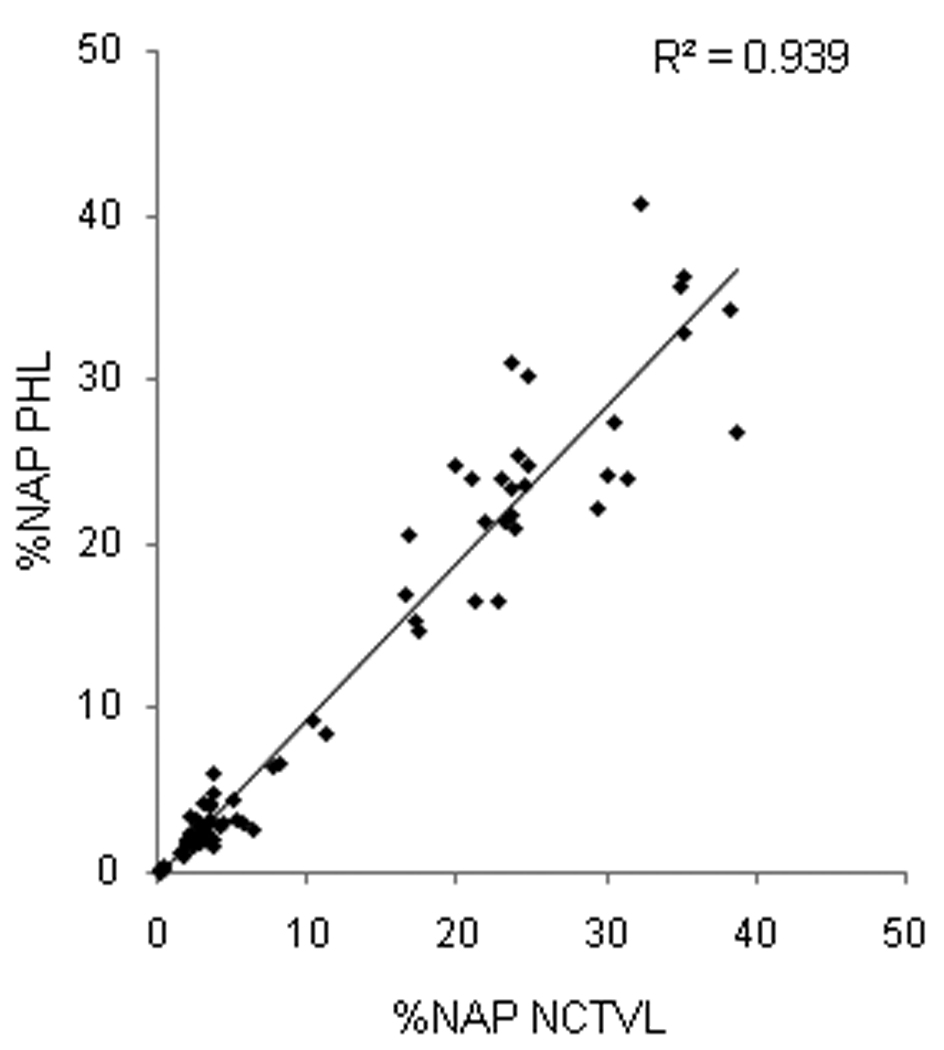
Inter-laboratory method validation. Comparison of 75 duplicate slides processed for γH2AX immunofluorescence at two independent laboratories, NCTVL and PHL. Image quantitation and analysis were run by both laboratories independently, and percent nuclear area positive for γH2AX (%NAP) values were compared across sites.
Efficacy of indenoisoquinolines in suppressing A375 xenograft growth
Tumor growth inhibition efficacy of NSC 724998 compared to topotecan was tested in dose escalation studies. Both a log cell kill and a delay in tumor growth, as determined by changes in median tumor volume, were observed with increasing dose (Table 1 and Fig. 3A). When administered on a QDx5 schedule, a 12 mg/kg dose of NSC 724998 (estimated to be half the QDx5 MTD in mice), was effective by both log cell kill and delayed growth metrics. The 16 mg/kg cohort of mice, treated for two QDx5 cycles (17 days’ rest between cycles), resulted in a 259% growth delay; however, the overall log cell kill was lower than that obtained on a single cycle at the next lower dose. The apparent discrepancy was likely due to the method of calculation of the two parameters. In addition, the second cycle of drug administration likely altered the calculated results compared to the other treatment groups. These results were indicative of xenograft cell escape from drug-growth inhibition between treatment cycles; nonetheless, tumor regression was observed. Additional experiments with topotecan-resistant HT-29 xenografts resulted in no significant growth inhibition with either 24 mg/kg NSC 724998 or topotecan at the equivalent 4.7 mg/kg dose level administered QDx5 (data not shown). Regression analysis of γH2AX %NAP response 4 hours after drug administration on day 5 of cycle 1 compared to tumor volume 23 days after first drug administration yielded an R2 value of 0.867 (Fig. 3B). The group median tumor volume 23 days after QDx5 treatment with NSC 724998 at the 16 mg/kg dose level and for the 4.7 mg/kg topotecan dose level was lower than the tumor volume at staging, indicating tumor shrinkage. Experimental logistics resulted in biomarker and efficacy experiments being run in parallel on matching lots of test compounds and vehicles (i.e., biomarker response and growth inhibition were tested independently).
Table 1.
Antitumor activity of NSC 724998 and topotecan in A375 xenografts.
| Number of Mice* |
Drug- related deaths† |
Maximum % Mean Body Weight Loss (day) |
Tumor Growth Inhibition | |||||
|---|---|---|---|---|---|---|---|---|
| Optimal % T/C (day) |
Delay % (T- C)/C |
Net Log Cell Kill |
||||||
| Vehicle | 16 | 0 | 0.9 | (12) | ||||
| NSC 724998 | ||||||||
| 16 mg/kg QDx5‡ | 8 | 0 | 7.2 | (12) | 1 | (19) | 259 | 0.8 |
| 12 mg/kg QDx5 | 8 | 0 | 7.1 | (12) | 3 | (19) | 116 | 1.4 |
| 8 mg/kg QDx5 | 8 | 0 | 3.6 | (12) | 12 | (15) | 68 | 0.6 |
| 4 mg/kg QDx5 | 8 | 0 | 3.2 | (12) | 36 | (15) | 28 | −0.1 |
| Topotecan | ||||||||
| 4.7 mg/kg QDx5 | 8 | 2 | 28.4 | (15) | 3 | (15) | 143 | 1.8 |
| 1.5 mg/kg QDx5 | 8 | 0 | 6.4 | (12) | 13 | (15) | 54 | 0.3 |
No mice were tumor free by study day 70.
A death is considered treatment-related if the animal dies within 15 days of the last treatment and either the tumor weight is less than the lethal burden in the control mice, or its net body weight loss at death is 20% greater than the mean net weight change in the control animals at death or sacrifice.
NSC 724998 16 mg/kg treatment group was treated 2 cycles, QDx5 with a 17 day rest between treatments, all other groups were treated for one cycle.
Abbreviations: QDx5, treated for 5 sequential days at designated dose; T, treated group; C, control group.
Fig. 3.
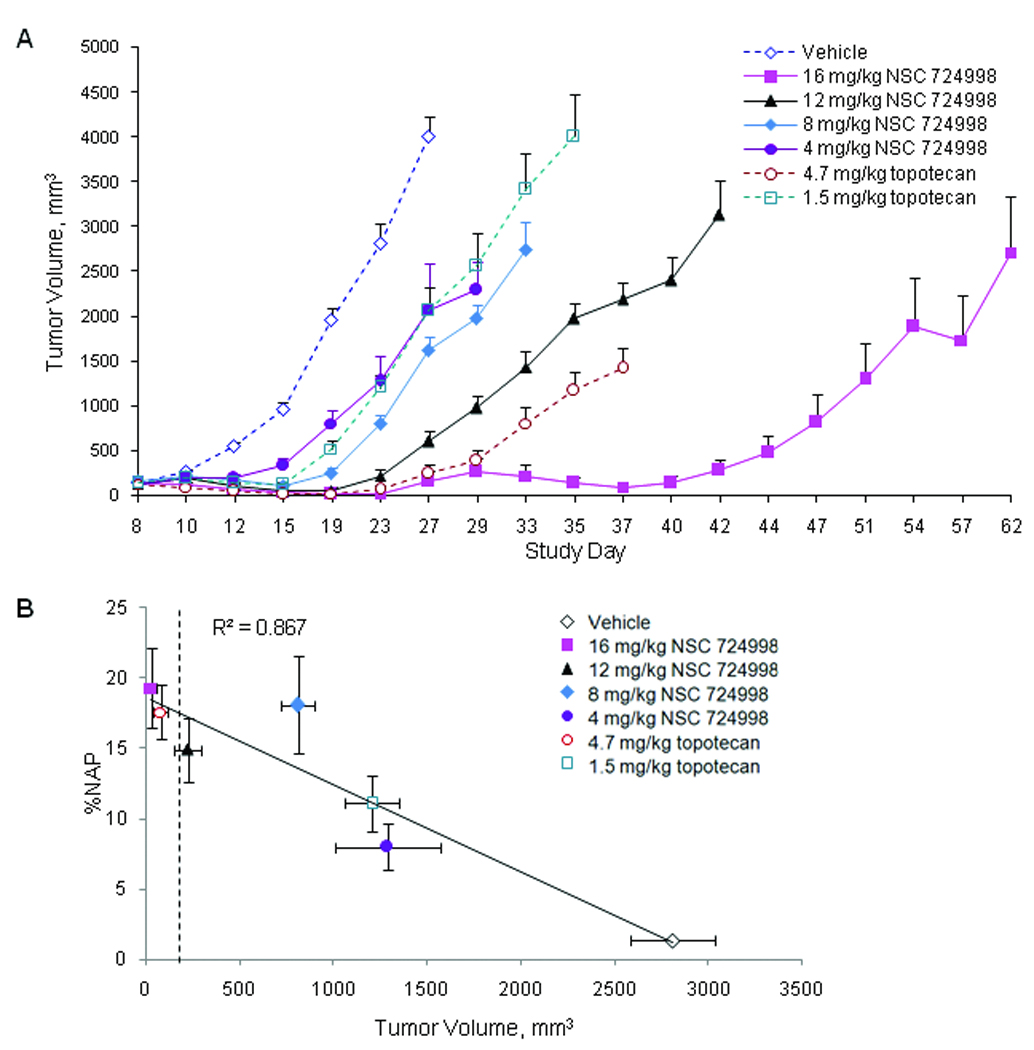
Tumor growth delay is observed following treatment with increasing doses of NSC 724988 or topotecan. Mice with A375 tumor xenografts were treated with topotecan (1.5 or 4.7 mg/kg) or NSC 724998 (4, 8, or 12 mg/kg) for one cycle administered once daily for 5 days (QDx5) or with NSC 724998 (16 mg/kg) treated for two QDx5 cycles (17 days’ rest between cycles). A. Xenograft tumor volume was measured throughout the study period. Data points represent median ± SEM; 8 mice per treatment group and 16 mice per control group. B. Regression analysis of percent γH2AX nuclear area positive (%NAP) measurements 4 hours post-dose day 5 of cycle 1 compared to tumor volumes on day 23 of cycle 1. Average tumor volume at staging was 200 mm3; dashed vertical line. Data points represent median ± SEM; 4 mice per treatment group and 8 mice per control group
γH2AX immunofluorescence assay application: indenoisoquinolines
Induction of γH2AX foci formation by the three indenoisoquinolines (NSCs 724998, 725776, and 706744) and topotecan was compared over a range of doses in the A375 xenograft model to assist in selection of which indenoisoquinoline(s) to move forward to clinical studies. The previously described controls and calibrator panels were used to verify γH2AX response. ANOVA analysis of γH2AX response to NSC 724998 showed a significant response in xenograft biopsies collected 2 hours post-dose over a 0.05 to 1 MTD dose range compared with vehicle (P ≤ 0.05; Table 2). At 2 hours post-dose, γH2AX response following NSC 725776 treatment was statistically significant for 3 of the 4 dose levels tested (0.05, 0.33, and 1 MTD) compared with vehicle (P ≤ 0.05; Table 2). NSC 706744 was the only indenoisoquinoline not to induce a measurable γH2AX dose-response curve and lacked a growth inhibitory response in A375 xenografts (data not shown). NSC 706744 was not pursued in further studies. Although the data for NSCs 724998 and 725776 showed a positive correlation between γH2AX response and indenoisoquinoline dose at 2 hours post-dose (data not shown), in general, γH2AX response was not statistically different between dose levels. However, all dosing groups were statistically significantly different from vehicle controls (Table 2). Intra-group variability of response resulted in overlapping statistical ranges in adjacent dosage levels. For both drugs, within-treatment-group heterogeneity in γH2AX response was thought to affect the significance level.
Table 2.
Inter-group statistical differences in γH2AX response in A375 xenograft biopsies collected 2 h post-dose
| NSC 724998* | Vehicle | 0.05 MTD | 0.1 MTD | 0.33 MTD | 1 MTD |
|---|---|---|---|---|---|
| Vehicle | – | – | – | – | – |
| 0.05 MTD | 0.026 | – | – | – | – |
| 0.1 MTD | 0.017 | NS | – | – | – |
| 0.33 MTD | 0.001 | NS | NS | – | – |
| 1 MTD | 0.034 | 0.0381 | NS | 0.090 | – |
| NSC 725776* | Vehicle | 0.05 MTD | 0.1 MTD | 0.33 MTD | 1 MTD |
| Vehicle | – | – | – | – | – |
| 0.05 MTD | 0.010 | – | – | – | – |
| 0.1 MTD | 0.103 | NS | – | – | – |
| 0.33 MTD | 0.002 | NS | NS | – | – |
| 1 MTD | 0.034 | NS | 0.038 | NS | – |
Four mice per group. NOTE: One-way ANOVA, with the significance level (alpha) set at 0.05, 2-sided, was used to determine P values for statistical differences across treatment groups. P values were calculated using pair-wise comparisons of γH2AX response to identify specific inter-group response differences. P values ≤ 0.10 were reported due to the small group sizes. P values > 0.10 are reported as NS.
Abbreviations: MTD, maximum tolerated dose; NS, not significant.
To clarify the dose and time effect of NSC 724998 on γH2AX biomarker induction, xenograft-bearing mice were treated with doses ranging from 0.16 to 0.67 MTD NSC 724998 and biopsies were collected at 1, 2, 4, and 7 hours post-dose (Fig. 4). Though a small γH2AX signal was observed at the 2-hour time point, the high degree of intra-group heterogeneity precluded significance. However, a significant drug response compared with vehicle was seen for all doses of NSC 724998 at 4 and 7 hours post-dose. γH2AX levels between dose levels and sampling times overlapped at the 4 and 7 hour time points and were not significantly different from each other, mirroring results obtained in growth inhibition experiments (Fig. 3A).
Fig. 4.
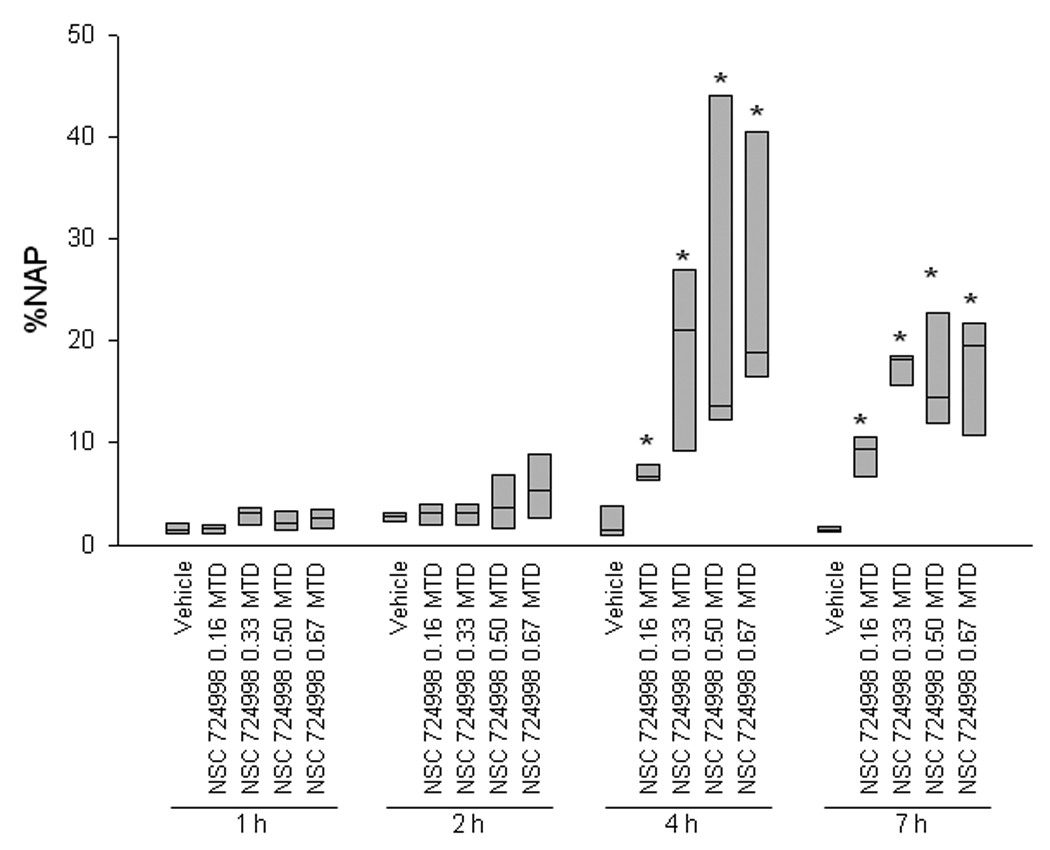
A significant γH2AX response was observed compared with vehicle control at all doses of NSC 724998 in A375 xenograft tumor biopsies collected 4 and 7 hours post-treatment. Box plots indicate the interquartile range and median percent nuclear area positive for γH2AX (%NAP) for three to five mice per dose group per time point. Biopsies were collected 1, 2, 4, and 7 hours following a single dose of 0.16 to 0.67 MTD NSC 724998 or vehicle control. Asterisks (*) indicate treatment cohort mean was statistically different from vehicle mean at same time point with a significance level of P < 0.05 as determined by Student’s t test. MTD, maximum tolerated dose.
Hair follicle surrogate tissue analysis
Hair follicles in skin samples collected from mice bearing A375 xenografts had γH2AX-positive nuclei 2 hours after single-dose topotecan treatment at doses ranging from 0.016 to 1 MTD (Fig. 1A, lower right panel; 0.32 MTD shown). Vehicle-treated animals had an average of 3 γH2AX-positive nuclei per follicle (Supplementary Fig. S1A). The minimal clinical cut-off for γH2AX response to drug treatment was set at four standard deviations above the average vehicle response, or 10 γH2AX-positive nuclei per follicle. When topotecan was administered at 0.32 MTD, a significant γH2AX response compared with vehicle was seen in hair follicles at 1, 2, and 4 hours post-treatment, with the peak response at 2 hours (Supplementary Fig. S1A). Decreasing the dose of topotecan to 0.1 MTD resulted in a peak γH2AX response at 4 hours (Supplementary Fig. S1B). At 4 hours post-treatment, 0.016 to 1 MTD topotecan yielded γH2AX-positive follicles, with all dose levels statistically distinguishable from vehicle (data not shown).
γH2AX response in hair follicles after indenoisoquinoline treatment was determined for skin snip samples collected 1, 2, 4, and 7 hours after single-dose administration of NSC 724998 (0.16, 0.33, 0.50, and 0.67 MTD), NSC 725776 (0.67 and 1 MTD), or vehicle. When 0.33 MTD and higher doses of NSC 724998 were used, mean peak γH2AX response was observed at 4 hours post-dose and was statistically different from vehicle (Supplementary Fig. S1B and Supplementary Table S1). As with the xenograft biopsy analysis, no statistically significant differences were seen between doses at 4 and 7 hours due to individual mouse response heterogeneity, although the signal strength trended downward at the later time points. γH2AX response was also significantly different statistically from vehicle at 4 hours post-dose for both of the NSC 725776 doses tested (Supplementary Fig. S1C).
Validated assay performance
Performance of the validated assay includes a calibrator/control slide, which includes positive and negative control samples as well as vehicle, low, and high calibrator samples for quality control. Based on the %NAP observed in xenograft samples treated with topotecan and the indenoisoquinolines, a 4-hour sampling time was chosen for the calibrator panel to best match potential clinical sampling times. The lower limit of quantification (LLQ) for the assay was set as the mean %NAP in vehicle-treated A375 xenograft samples, and the negative control specimen was employed as an assay zero. A calibrator panel was established that comprised biopsies collected 4 hours post-dose from mice bearing A375 xenografts treated with vehicle and single-dose 0.1 MTD and 0.32 MTD topotecan (labeled Calibrator 1, 2, and 3, respectively; Supplementary Fig. S2). The acceptable ranges for the γH2AX signal on the calibrator sections were established as follows: Calibrator 1 less than 2.5% NAP with staining restricted to the nucleus, Calibrator 2 between 7.5% and 15% NAP, and Calibrator 3 between 15% and 25% NAP.
Further assay validation for quality control included that the %NAP of the negative control sample be less than the vehicle calibrator and that the positive control sample be intensely stained (> 15% NAP). Two sets of calibrator/control slides are run with each set of clinical samples; assay quality control requires that there be at least three analyzable fields, in aggregate, across the two calibrator/control slides at each calibrator level. For clinical specimens, all three images from each section must be analyzable by immunofluorescence or a second set of tissue sections from the specimens will be stained and analyzed. The %NAP for each sample will be established as the average of the separate quantified images per section.
Discussion
We developed an immunofluorescence-based assay to measure γH2AX response after Top1 inhibitor treatment. The assay uses control and calibrator tissues and was tested using clinically relevant needle biopsy collection and handling procedures (4, 7). The background fluorescence–induced variability and non-uniformity of nuclear volume within tissue sections, common problems in many assays measuring immunofluorescence, were mitigated with a novel data quantitation and image processing algorithm. Evaluation parameters included specificity of response, amplitude of response measured as fraction of tumor cell nuclei or hair follicle cells positive, timing of response after treatment, and correlation of biomarker response to the biologically effective dose of the Top1 inhibitor topotecan and NSC 724998. After establishing that all of these marker characteristics were consistent with the expected effects of topotecan, we validated the assay for detection of double-strand breaks caused by topotecan administered over a 60-fold dose range (0.016–1.0 MTD) in both topotecan-sensitive and -insensitive human cancer cell-line xenografts and in normal murine testes and small intestine. The assay was then used to measure γH2AX response to three structurally related indenoisoquinoline inhibitors of Top1, NSCs 724998, 725776, and 706774.
It has previously been shown that indenoisoquinolines have activity in camptothecin-resistant cell lines, are chemically more stable than camptothecin, overcome drug efflux-related multidrug-resistance, and produce DNA breaks resistant to reversal of the trapped DNA-Top1 cleavage complex (24, 25, 31–33). Despite considerable intra-group heterogeneity in γH2AX response in A375 xenografts after indenoisoquinoline treatment, a response that was significantly different statistically from vehicle was detected for NSCs 724998 and 725776. Notably, γH2AX response was significant compared with vehicle at all doses of NSCs 724998 tested at 4 hours post-dose. This response persisted at 7 hours post-dose. These findings, in conjunction with additional preclinical data, supported selection of NSCs 724998 and 725776 for clinical evaluation (25). The observation that a significant γH2AX response compared with vehicle could readily be measured in xenografts by 4 hours after drug administration also informed the design of the phase I indenoisoquinolines trial being conducted at the NCI.
It is well established that γH2AX formation occurs in response to DNA double-strand breaks, and apoptosis generates double-strand breaks; the γH2AX assay outlined in this paper cannot separate these two processes. The literature on γH2AX as a marker for DNA double-strand breaks induced by ionizing radiation is extensive; however, less is known about the utility of γH2AX as a marker for monitoring chemotherapy-induced DNA damage. When Rogakou and colleagues used ionizing radiation as a source of double-strand break damage and apoptosis, maximum γH2AX response was estimated to be 9 to 30 minutes post-exposure (10), which is significantly less than the time course observed in our studies. In contrast, the same group reported that γH2AX started to accumulate 1.5 hours after anti-Fas and TRAIL were used to induce apoptosis in vitro, corresponding to the appearance of DNA double-strand breaks (34, 35). Our interpretation of the difference in γH2AX response between our observed drug response and previously published radiation-treated animal models is the difference in the timing of DNA damage. Ionizing radiation results in immediate double-strand break damage. For chemotherapeutic agents, injected as well as oral, there is a time lag between their administration and arrival at the tissue being sampled. In addition, for those agents that act by interfering with DNA metabolism, time is needed for the inhibition and subsequent repair to occur, with most of the double-strand breaks forming during the attempted repair of the breaks themselves. Our ability to determine drug dose response within groups with statistical significance required collecting and testing tumor biopsies no sooner than 4 hours post-dose, which would appear to be a very early time point for detecting apoptosis considering the biodistribution of the compound that must take place in the test animal.
Our use of γH2AX as a pharmacodynamic biomarker also raises the question of quantifying the number of DNA double-strand break repair complexes and using that information to predict cell death in response to drug treatment. It has been reported that cancer cell lines have a wide variation in the number of γH2AX foci per nucleus in the absence of radiation or drug treatment, and these cells continue to grow and divide (36, 37). The question of whether an increase in the fraction of γH2AX-positive cells reflects an increase in cell death remains to be further explored (35), although data presented here point in that direction (Fig. 3B). We are currently validating an apoptosis-specific assay and plan to use it to develop a multiplex immunofluorescence assay for simultaneous measurement of DNA damage and apoptotic markers on the same specimens.
There was significant within-treatment group variability for both biomarker levels (tumor and hair follicle) and tumor growth inhibition. We suspect that the within-group variability in response to exposure to topotecan and indenoisoquinolines in xenografts may, in part, be related to variable intratumoral levels of Top1 (38–41). A number of tumor cell lines respond to Top1 inhibitors by selective S-phase arrest during DNA replication, and γH2AX formation in response to these treatments is restricted to replicating cells (19, 42, 43). In addition, it has been reported in the FOCUS trial that response to irinotecan is a function of Top1 levels in the tumor at the start of treatment (40). It is reasonable to suggest that the reduction in Top1 levels during and after Top1 inhibitor treatment can result in decreased drug response on the next treatment cycle. We have recently analytically validated an ELISA-based total Top1 assay in tissues (41) and are interested in confirming the FOCUS trial results as well as documenting the effect of repeat Top1 inhibitor treatment on biomarker and xenograft growth response. The Top1 assay is being used as a correlative study in clinical trials at the NCI. We have also reported, using that assay, that there is significant variability in the amount of Top1 in xenografts from different mice, and that topotecan-sensitive xenografts express higher levels of Top1 protein than topotecan-resistant xenografts (38).
The within-treatment group heterogeneity of γH2AX response measured in our preclinical model also suggests there might be similar variability in patient samples. To address this, the assay was designed to score γH2AX response based on the γH2AX background level above the patient’s pre-treatment biopsy sample background, with normalization to sample autofluorescence. Although it was not feasible to perform repeat sampling in the mouse model, the assay quantitation described here should allow each patient’s pre-dose sample to serve as a baseline readout and each sample to serve as its own control to offset inter- and intra-sample molecular and histologic heterogeneity. In addition, a calibrator panel and positive and negative control samples will be run during each clinical assay to ensure that quality control standards are met. It is expected that these quality control procedures will allow more accurate detection of a γH2AX response when applied to patient samples.
Use of hair follicles as a surrogate tissue for drug response was also examined, and data presented here suggest that γH2AX can be successfully measured in hair follicles following treatment in mouse models, albeit at higher doses of indenoisoquinolines and topotecan than required for response in xenografts. Hair follicle cells have long been recognized as a possible surrogate tissue for testing drug efficacy in patients undergoing chemotherapy; epithelial in origin, as are 80% of cancers, they can be obtained by noninvasive or minimally invasive procedures (44, 45). Hair follicle cells are among the most rapidly proliferating cells in the body and are therefore sensitive to agents that damage DNA. Other studies have demonstrated that antibody-based protein detection methods are effective in hair follicle cells (46, 47). One obvious limitation of our model is that decreased concentrations of the drugs across the surface area of the skin may result in higher doses being required to observe an effect in hair follicles. In addition, hair follicles are not abundant in athymic nude mice; additional studies are underway in rats and dogs to evaluate hair follicles as surrogate tissues. Because it was challenging to process individual hairs with intact follicles and sheaths on our automated tissue processing system, skin snips were collected to preserve the entire follicle. We identified the optimal clinical sampling time by determining that the mean number of nuclei per hair follicle positive for γH2AX in the A375 xenograft mice peaked 4 hours after treatment with topotecan and NSCs 724998 and 725776. Vehicle-treated animals generally had up to 5 positive nuclei per follicle (mean 3 positive nuclei per follicle), so the minimal cut-off for “positive” drug effect for clinical samples was set at 10 γH2AX-positive nuclei per follicle, or four standard deviations above the average vehicle response. A higher cut-off was selected due to the lack of published data regarding the amount of variability to be expected in specimens from patients with cancer, and may be adjusted after clinical trials with the indenoisoquinolines. Correlating γH2AX dose-response to Top1 inhibitors in hair follicles and tumor biopsies in clinical trials will establish the value of hair follicles as minimally invasive surrogates for drug effect in future trials of this class of drug.
Finally, a correlation between the γH2AX biomarker and effects on tumor growth was established at comparable dose levels in parallel experiments. However, the correlation of biomarker response to compound effect on tumor growth is fundamentally limited by the requirement for multiple administrations of any of the Top1 inhibitors we investigated to achieve xenograft growth suppression. In contrast, elevated γH2AX levels were observed within a few hours of a single administration of the compound. This rapid response to a single dose is a critical consideration in selecting a biomarker for use in the clinical population, where often only a single post-treatment biopsy is allowed.
In conclusion, γH2AX is a sensitive biomarker for monitoring the pharmacodynamics of anti-cancer therapeutics that damage DNA, and its measurement could lead to enhanced monitoring of chemotherapeutic effects in the clinic. Evaluation of γH2AX response in tumor biopsies or hair follicles allows for monitoring of pharmacodynamic effects in patients over the course of drug treatment. We anticipate that the use of this pharmacodynamic assay will inform clinical drug development decisions and promote the examination of surrogate tissues to evaluate the biochemical effects of Top1 inhibitors.
Statement of Translational Relevance
Optimal clinical development of a molecularly targeted agent requires the incorporation of validated pharmacodynamic assays to establish drug activity on target. This paper details the development and validation of a quantitative immunofluorescence assay for phosphorylated histone H2AX (γH2AX) as a biomarker for topoisomerase I (Top1) inhibitor activity. The assay was qualified in human tumor xenograft models using clinically relevant procedures and will be used in a phase I clinical trial conducted at the National Cancer Institute to evaluate the extent to which structurally similar indenoisoquinoline Top1 inhibitors activate γH2AX. In conjunction with toxicity and pharmacokinetic data, the pharmacodynamic results obtained will inform subsequent clinical development decisions. The γH2AX assay was also optimized to explore use of minimally invasive skin biopsies as surrogates for tumor biopsies; these studies will also be evaluated clinically and could have important implications for monitoring patients’ pharmacodynamic responses to chemotherapy with agents that damage DNA.
Supplementary Material
Acknowledgments
We thank Miriam Anver and Olga Sedelnikova for helpful discussions and advice; Gina Uhlenbrauck and Marion Hartley for writing and editing support; and Kelly Dougherty, Carrie Bonomi, John Carter, Suzanne Borgel, and Ray Divelbiss for assistance with tissue culture and tumor generation and passage.
This project has been funded in whole or in part with federal funds from the National Cancer Institute, National Institutes of Health, under Contract N01-CO-12400. The content of this publication does not necessarily reflect the views or policies of the Department of Health and Human Services, nor does mention of trade names, commercial products, or organizations imply endorsement by the U.S. Government. This research was supported [in part] by the Developmental Therapeutics Program in the Division of Cancer Treatment and Diagnosis of the National Cancer Institute.
Footnotes
References
- 1.Kummar S, Kinders R, Rubinstein L, et al. Compressing drug development timelines in oncology using phase '0' trials. Nat Rev Cancer. 2007;7:131–139. doi: 10.1038/nrc2066. [DOI] [PubMed] [Google Scholar]
- 2.Workman P, Aboagye EO, Chung Y-L, et al. Minimally invasive pharmacokinetic and pharmacodynamic technologies in hypothesis-testing clinical trials of innovative therapies. J Natl Cancer Inst. 2006;98:580–598. doi: 10.1093/jnci/djj162. [DOI] [PubMed] [Google Scholar]
- 3.Kelloff GJ, Bast RC, Jr, Coffey DS, et al. Biomarkers, surrogate end points, and the acceleration of drug development for cancer prevention and treatment: an update prologue. Clin Cancer Res. 2004;10:3881–3884. doi: 10.1158/1078-0432.CCR-03-0783. [DOI] [PubMed] [Google Scholar]
- 4.Kummar S, Kinders R, Gutierrez ME, et al. Phase 0 clinical trial of the poly (ADP-ribose) polymerase inhibitor ABT-888 in patients with advanced malignancies. J Clin Oncol. 2009;27:2705–2711. doi: 10.1200/JCO.2008.19.7681. [DOI] [PMC free article] [PubMed] [Google Scholar]
- 5.Betensky RA, Louis DN, Gregory Cairncross J. Influence of unrecognized molecular heterogeneity on randomized clinical trials. J Clin Oncol. 2002;20:2495–2499. doi: 10.1200/JCO.2002.06.140. [DOI] [PubMed] [Google Scholar]
- 6.Murgo AJ, Kummar S, Rubinstein L, et al. Designing phase 0 cancer clinical trials. Clin Cancer Res. 2008;14:3675–3682. doi: 10.1158/1078-0432.CCR-07-4560. [DOI] [PMC free article] [PubMed] [Google Scholar]
- 7.Kinders RJ, Hollingshead M, Khin S, et al. Preclinical modeling of a phase 0 clinical trial: qualification of a pharmacodynamic assay of poly (ADP-ribose) polymerase in tumor biopsies of mouse xenografts. Clin Cancer Res. 2008;14:6877–6885. doi: 10.1158/1078-0432.CCR-08-0214. [DOI] [PMC free article] [PubMed] [Google Scholar]
- 8.Wang LH, Pfister TD, Parchment RE, et al. Monitoring drug-induced gammaH2AX as a pharmacodynamic biomarker in individual circulating tumor cells. Clin Cancer Res. 2010;16:1073–1084. doi: 10.1158/1078-0432.CCR-09-2799. [DOI] [PMC free article] [PubMed] [Google Scholar]
- 9.Kinders R, Wang L, Kummar S, et al. Use of Circulating Tumor Cells to Monitor Pharmacodynamic Responses of Patients in Early Stage Clinical Trials. AACR Annual Meeting. 2010 Abstract LB286. [Google Scholar]
- 10.Rogakou EP, Pilch DR, Orr AH, Ivanova VS, Bonner WM. DNA double-stranded breaks induce histone H2AX phosphorylation on serine 139. J Biol Chem. 1998;273:5858–5868. doi: 10.1074/jbc.273.10.5858. [DOI] [PubMed] [Google Scholar]
- 11.Paull TT, Rogakou EP, Yamazaki V, Kirchgessner CU, Gellert M, Bonner WM. A critical role for histone H2AX in recruitment of repair factors to nuclear foci after DNA damage. Curr Biol. 2000;10:886–895. doi: 10.1016/s0960-9822(00)00610-2. [DOI] [PubMed] [Google Scholar]
- 12.Sedelnikova OA, Bonner WM. γH2AX in cancer cells: a potential biomarker for cancer diagnostics, prediction and recurrence. Cell Cycle. 2006;5:2909–2913. doi: 10.4161/cc.5.24.3569. [DOI] [PubMed] [Google Scholar]
- 13.Bonner WM, Redon CE, Dickey JS, et al. γH2AX and cancer. Nat Rev Cancer. 2008;8:957–967. doi: 10.1038/nrc2523. [DOI] [PMC free article] [PubMed] [Google Scholar]
- 14.Fernandez-Capetillo O, Lee A, Nussenzweig M, Nussenzweig A. H2AX: the histone guardian of the genome. DNA Repair (Amst) 2004;3:959–967. doi: 10.1016/j.dnarep.2004.03.024. [DOI] [PubMed] [Google Scholar]
- 15.Pommier Y. Topoisomerase I inhibitors: camptothecins and beyond. Nat Rev Cancer. 2006;6:789–802. doi: 10.1038/nrc1977. [DOI] [PubMed] [Google Scholar]
- 16.Rogakou EP, Boon C, Redon C, Bonner WM. Megabase chromatin domains involved in DNA double-strand breaks in vivo. J Cell Biol. 1999;146:905–916. doi: 10.1083/jcb.146.5.905. [DOI] [PMC free article] [PubMed] [Google Scholar]
- 17.Sedelnikova OA, Rogakou EP, Panyutin IG, Bonner WM. Quantitative detection of 125IdU-induced DNA double-strand breaks with γ-H2AX antibody. Radiat Res. 2002;158:486–492. doi: 10.1667/0033-7587(2002)158[0486:qdoiid]2.0.co;2. [DOI] [PubMed] [Google Scholar]
- 18.Antony S, Agama KK, Miao ZH, et al. Novel indenoisoquinolines NSC 725776 and NSC 724998 produce persistent topoisomerase I cleavage complexes and overcome multidrug resistance. Cancer Res. 2007;67:10397–10405. doi: 10.1158/0008-5472.CAN-07-0938. [DOI] [PubMed] [Google Scholar]
- 19.Furuta T, Takemura H, Liao ZY, et al. Phosphorylation of histone H2AX and activation of Mre11, Rad50, and Nbs1 in response to replication-dependent DNA double-strand breaks induced by mammalian DNA topoisomerase I cleavage complexes. J Biol Chem. 2003;278:20303–20312. doi: 10.1074/jbc.M300198200. [DOI] [PubMed] [Google Scholar]
- 20.Kao J, Milano MT, Javaheri A, et al. gamma-H2AX as a therapeutic target for improving the efficacy of radiation therapy. Curr Cancer Drug Targets. 2006;6:197–205. doi: 10.2174/156800906776842957. [DOI] [PubMed] [Google Scholar]
- 21.Kuo LJ, Yang LX. Gamma-H2AX - a novel biomarker for DNA double-strand breaks. In Vivo. 2008;22:305–309. [PubMed] [Google Scholar]
- 22.Banuelos CA, Banath JP, Kim J-Y, Aquino-Parsons C, Olive PL. GammaH2AX expression in tumors exposed to cisplatin and fractionated irradiation. Clin Cancer Res. 2009;15:3344–3353. doi: 10.1158/1078-0432.CCR-08-3114. [DOI] [PubMed] [Google Scholar]
- 23.Nakamura A, Sedelnikova OA, Redon C, et al. Techniques for gamma-H2AX detection. Methods Enzymol. 2006;409:236–250. doi: 10.1016/S0076-6879(05)09014-2. [DOI] [PubMed] [Google Scholar]
- 24.Hollingshead MG, Borgel SD, Carter J, et al. Evidence of in vivo efficacy for the indenoisoquinolones linked with pharmacodynamic markers for γH2AX; AACR-NCI-EORTC International Conference; 2007. Abstract 1020. [Google Scholar]
- 25.Pommier Y, Cushman M. The indenoisoquinoline noncamptothecin topoisomerase I inhibitors: update and perspectives. Mol Cancer Ther. 2009;8:1008–1014. doi: 10.1158/1535-7163.MCT-08-0706. [DOI] [PMC free article] [PubMed] [Google Scholar]
- 26.Nagarajan M, Xiao X, Antony S, Kohlhagen G, Pommier Y, Cushman M. Design, synthesis, and biological evaluation of indenoisoquinoline topoisomerase I inhibitors featuring polyamine side chains on the lactam nitrogen. J Med Chem. 2003;46:5712–5724. doi: 10.1021/jm030313f. [DOI] [PubMed] [Google Scholar]
- 27.Baker AF, Dragovich T, Ihle NT, Williams R, Fenoglio-Preiser C, Powis G. Stability of phosphoprotein as a biological marker of tumor signaling. Clin Cancer Res. 2005;11:4338–4340. doi: 10.1158/1078-0432.CCR-05-0422. [DOI] [PubMed] [Google Scholar]
- 28.Hamer G, Roepers-Gajadien HL, van Duyn-Goedhart A, et al. DNA double-strand breaks and gamma-H2AX signaling in the testis. Biol Reprod. 2003;68:628–634. doi: 10.1095/biolreprod.102.008672. [DOI] [PubMed] [Google Scholar]
- 29.Yoshida K, Yoshida SH, Shimoda C, Morita T. Expression and radiation-induced phosphorylation of histone H2AX in mammalian cells. J Radiat Res (Tokyo) 2003;44:47–51. doi: 10.1269/jrr.44.47. [DOI] [PubMed] [Google Scholar]
- 30.Mahadevaiah SK, Turner JM, Baudat F, et al. Recombinational DNA double-strand breaks in mice precede synapsis. Nat Genet. 2001;27:271–276. doi: 10.1038/85830. [DOI] [PubMed] [Google Scholar]
- 31.Antony S, Kohlhagen G, Agama K, et al. Cellular topoisomerase I inhibition and antiproliferative activity by MJ-III-65 (NSC 706744), an indenoisoquinoline topoisomerase I poison. Mol Pharmacol. 2005;67:523–530. doi: 10.1124/mol.104.003889. [DOI] [PubMed] [Google Scholar]
- 32.Kohlhagen G, Paull KD, Cushman M, Nagafuji P, Pommier Y. Protein-linked DNA strand breaks induced by NSC 314622, a novel noncamptothecin topoisomerase I poison. Mol Pharmacol. 1998;54:50–58. doi: 10.1124/mol.54.1.50. [DOI] [PubMed] [Google Scholar]
- 33.Meng LH, Liao ZY, Pommier Y. Non-camptothecin DNA topoisomerase I inhibitors in cancer therapy. Curr Top Med Chem. 2003;3:305–320. doi: 10.2174/1568026033452546. [DOI] [PubMed] [Google Scholar]
- 34.Rogakou EP, Nieves-Neira W, Boon C, Pommier Y, Bonner WM. Initiation of DNA fragmentation during apoptosis induces phosphorylation of H2AX histone at serine 139. J Biol Chem. 2000;275:9390–9395. doi: 10.1074/jbc.275.13.9390. [DOI] [PubMed] [Google Scholar]
- 35.Solier S, Pommier Y. The apoptotic ring: a novel entity with phosphorylated histones H2AX and H2B and activated DNA damage response kinases. Cell Cycle. 2009;8:1853–1859. doi: 10.4161/cc.8.12.8865. [DOI] [PubMed] [Google Scholar]
- 36.MacPhail SH, Banath JP, Yu Y, Chu E, Olive PL. Cell cycle-dependent expression of phosphorylated histone H2AX: reduced expression in unirradiated but not X-irradiated G1-phase cells. Radiat Res. 2003;159:759–767. doi: 10.1667/rr3003. [DOI] [PubMed] [Google Scholar]
- 37.Huang X, Tanaka T, Kurose A, Traganos F, Darzynkiewicz Z. Constitutive histone H2AX phosphorylation on Ser-139 in cells untreated by genotoxic agents is cell-cycle phase specific and attenuated by scavenging reactive oxygen species. Int J Oncol. 2006;29:495–501. [PubMed] [Google Scholar]
- 38.Pfister TD, Reinhold WC, Agama K, et al. Topoisomerase I levels in the NCI-60 cancer cell line panel determined by validated ELISA and microarray analysis and correlation with indenoisoquinoline sensitivity. Mol Cancer Ther. 2009;8:1878–1884. doi: 10.1158/1535-7163.MCT-09-0016. [DOI] [PMC free article] [PubMed] [Google Scholar]
- 39.Pfister T, Khin S, Hollingshead M, et al. Development and preclinical modeling of a topoisomerase I pharmacodynamic immunoassay for use in clinical trials. AACR Meeting Abstracts. 2008:B23. [Google Scholar]
- 40.Braun MS, Richman SD, Quirke P, et al. Predictive biomarkers of chemotherapy efficacy in colorectal cancer: results from the UK MRC FOCUS trial. J Clin Oncol. 2008;26:2690–2698. doi: 10.1200/JCO.2007.15.5580. [DOI] [PubMed] [Google Scholar]
- 41.Pfister T, Khin S, Agama K, Hollingshead M, Sooryakumar D, Pommier Y. A novel validated quantitative pharmacodynamic topoisomerase I covalent-complex immunoassay. EORTC Meeting Abstracts. 2009 [Google Scholar]
- 42.Huang X, Okafuji M, Traganos F, Luther E, Holden E, Darzynkiewicz Z. Assessment of histone H2AX phosphorylation induced by DNA topoisomerase I and II inhibitors topotecan and mitoxantrone and by the DNA cross-linking agent cisplatin. Cytometry A. 2004;58:99–110. doi: 10.1002/cyto.a.20018. [DOI] [PubMed] [Google Scholar]
- 43.Kurose A, Tanaka T, Huang X, et al. Assessment of ATM phosphorylation on Ser-1981 induced by DNA topoisomerase I and II inhibitors in relation to Ser-139-histone H2AX phosphorylation, cell cycle phase, and apoptosis. Cytometry A. 2005;68:1–9. doi: 10.1002/cyto.a.20186. [DOI] [PubMed] [Google Scholar]
- 44.Camidge DR, Randall KR, Foster JR, et al. Plucked human hair as a tissue in which to assess pharmacodynamic end points during drug development studies. Br J Cancer. 2005;92:1837–1841. doi: 10.1038/sj.bjc.6602558. [DOI] [PMC free article] [PubMed] [Google Scholar]
- 45.Vermorken AJ, Bloemendal H. Human hair follicle cells in culture: the development of a new culture system and its potential applications. Mol Biol Rep. 1986;11:3–12. doi: 10.1007/BF00417588. [DOI] [PubMed] [Google Scholar]
- 46.Randall KJ, Foster JR. The demonstration of immunohistochemical biomarkers in methyl methacrylate-embedded plucked human hair follicles. Toxicol Pathol. 2007;35:952–957. doi: 10.1080/01926230701748198. [DOI] [PubMed] [Google Scholar]
- 47.Traicoff JL, Baibakov G, Biesecker G, et al. Novel application of layered expression scanning for proteomic profiling of plucked hair follicles. Dermatology. 2005;210:273–278. doi: 10.1159/000084750. [DOI] [PubMed] [Google Scholar]
Associated Data
This section collects any data citations, data availability statements, or supplementary materials included in this article.