Abstract
STACK is a tool for detection and visualisation of expressed transcript variation in the context of developmental and pathological states. The datasystem organises and reconstructs human transcripts from available public data in the context of expression state. The expression state of a transcript can include developmental state, pathological association, site of expression and isoform of expressed transcript. STACK consensus transcripts are reconstructed from clusters that capture and reflect the growing evidence of transcript diversity. The comprehensive capture of transcript variants is achieved by the use of a novel clustering approach that is tolerant of sub-sequence diversity and does not rely on pairwise alignment. This is in contrast with other gene indexing projects. STACK is generated at least four times a year and represents the exhaustive processing of all publicly available human EST data extracted from GenBank. This processed information can be explored through 15 tissue-specific categories, a disease-related category and a whole-body index and is accessible via WWW at http://www.sanbi.ac.za/Dbases.html. STACK represents a broadly applicable resource, as it is the only reconstructed transcript database for which the tools for its generation are also broadly available (http://www.sanbi.ac.za/CODES).
INTRODUCTION
Expressed sequence tags (ESTs) represent single pass reads from the 5′ and/or 3′ end of cDNA clones. These error-prone sequences gain significant biological value if they are reconstructed into consensus transcripts. The complete combined sequence of all expressed exons within a gene, a truly complete mRNA, would be an ideal scaffold for constructing a set of non-redundant transcripts. However, complete cDNA sequences such as these are not broadly represented in cDNA libraries and seldom extend to the 5′ cap of the transcript. The scarcity of full-length mRNA sequences and the abundance of ESTs has led a number of groups to attempt to add value to EST data by constructing gene indices (1–3). STACK differs from other gene indexing projects in that it is focused on the capture of context and form of expression and through this a reconstruction of a contextual transcript is attempted. The broad implementation of alignment based clustering tools can narrow the capture of potential variation within gene expression products. STACK does not rely on alignment based clustering tools to perform clustering, but instead incorporates a novel, loose clustering approach, d2_cluster, that performs comparisons via non-contextual assessment of the composition and multiplicity of words within each sequence (4,5). The non-alignment-based approach tends to capture transcript variants and contaminating sequences that could represent chimeric clones or aberrant transcripts associated with disease (4–6). The use of a loose clustering approach also allows for the incorporation of sequences that would otherwise be discarded as poor quality sequence. The inclusion of low quality sequence in STACK has led to the development of error checking tools to assess the integrity of each cluster, and in some cases, to elongate reconstructed transcripts.
STACK GENERATION
Tissue data sets
The STACK database represents the processing of all publicly available human EST data extracted from GenBank. ESTs are first partitioned arbitrarily into tissue/state context bins followed by removal of contaminating sequences such as vector, low complexity, mitochondrial and ribosomal sequences. Each tissue-grouped set is sent through a pipeline comprising of clustering, assembly, consensus generation and clone linking (7). ESTs are clustered using d2_cluster (5), which attempts to capture alternate expressed forms of a gene within the same cluster, in contrast to other protocols that may discard sequences containing ‘noise’. Alignment assemblies are generated using the PHRAP package (http://www.phrap.org) and the aligned clusters are used as input for assembly analysis using stack_Analyze and CRAW (6,7). Assembly artifacts and isoforms are partitioned within a cluster and the longest consensus sequence is assigned to a given cluster, while additional sub-consensus sequences are captured within each record if they exist. Sequences that originate from the same cDNA clone are traced and corresponding clusters are joined by a simple linker sequence producing extended STACK linked consensus entries (7; Table 1).
Table 1. STACK clustering and clonelinking information.
| Tissue |
Input sequences |
Singletons |
Multi-sequence clusters |
Linked sequences |
Average length of linked sequences (bases) |
| Adipose | 2376 | 1693 | 181 | 0 | |
| Brain | 229 005 | 46 336 | 225 88 | 11 018 | 1128.8 |
| Cochlea | 8494 | 3543 | 1220 | 265 | 746.8 |
| Connective | 47 081 | 14 433 | 5197 | 1626 | 973.2 |
| Digestive | 142 659 | 20 430 | 10 643 | 1971 | 1444.7 |
| Disease | 327 613 | 53 074 | 14 423 | 2582 | 948.6 |
| Eye | 28 554 | 14 308 | 3486 | 4207 | 789.5 |
| Genomic | 166 358 | 42 795 | 16 918 | 1740 | 749 |
| Gland | 172 314 | 34 629 | 16 972 | 4734 | 1245.2 |
| Heart | 73 941 | 21 902 | 8795 | 3728 | 922 |
| Hemato-lymph | 307 285 | 60 009 | 24 947 | 11674 | 928.3 |
| Lung | 96 917 | 22 218 | 12 669 | 4213 | 978.9 |
| Muscle | 30 512 | 5454 | 2338 | 1165 | 881.1 |
| Olfactory | 2600 | 1478 | 248 | 458 | 664 |
| Other | 26 175 | 9637 | 4356 | 3762 | 1016.6 |
| Reproductive | 293 311 | 50 199 | 28 218 | 10 353 | 1342.6 |
| Whole-body indexa | 937 782 | 159 743 | 66 081 | 7099 | 1948.3 |
aThe whole-body index represent the processing of dbEST (GenBank110) and whereas the STACK tissue-level data represents processing of dbEST (GenBank115).
Whole-body index
Tissue-based clusters, their consensus sequences and mRNAs extracted from GenBank have been used to create the STACK whole body index. Tissue-level consensus sequences are decomposed to their constituent ESTs prior to a PHRAP assembly in order to maximise the alignment accuracy over EST reads that are of low quality. The whole-body index data is subjected to assembly analysis and consensus generation. Radiation hybrid mapping information is integrated into the consensus sequences using ePCR (8). The final consensus sequence is presented in FASTA format where the header line captures the unique STACK-ID, the GenBank accession numbers for each of the constituent ESTs, the original clone libraries and mapping information if it exists.
INCORPORATING RADIATION HYBRID (RH) MAPPING INFORMATION
Mapping methodologies have centred around the use of sequence tag sites (STSs) as unique landmarks across the genome (9). EST-based landmarks entered the realm of feasibility when it was demonstrated that single-pass sequences provide suitable templates for the design of gene-based STSs (10). An international consortium was established to develop STSs from ESTs for mapping studies using primarily RH techniques (2). Approximately 1000 genetic markers from the Genethon map were included in the analysis to serve as a mapping framework and to allow gene positions to be related to genetic linkage information. Recently, about 41 000 markers were placed onto RH panels and formed the basis of Genemap’98 (11).
EST sequencing is intrinsically inadequate for identifying truly rare genes (12). Therefore, the STS pool that was generated from the EST data will tend not to capture rare transcripts and as a result, STSs would provide optimistic estimates of cluster accuracy. We have used RH markers to assess the fidelity of the STACK consensus sequences. A total of 52 882 RH markers were used to assign mapping information to STACK indices using ePCR (8). An analysis of our mapping information suggests a 1.08-fold redundancy in STACK clusters. The assignment of more than one cluster to a STS could represent the capture of paralogous genes in different clusters. Clusters containing inconsistent map locations account for 0.6% of the total clusters, which correlates with the error rates reported in the mapping laboratories. The availability of map locations within the STACK database provides a resource for positional candidate gene selection relevant to both physical location and source of gene expression.
GENE DISCOVERY RESOURCE
Capture of alternate gene expression forms
Databases such as TIGR and UniGene have focused on reconstructing the gene complement of the human genome and their technological developments have been directed towards achieving that goal. STACK, however, focuses on the detection and visualisation of transcript variation in the context of developmental and pathological states.
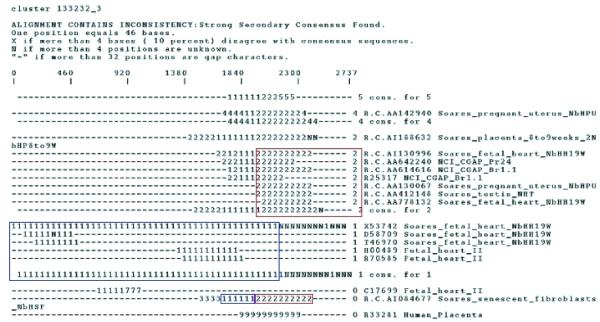
An apparent splice variant identified in a different cluster from its parent gene could be a close paralogue with a distinct genomic locus. However, alternatively spliced transcripts that capture important biological information within the same cluster assembly have to be handled appropriately. Two alternatively spliced transcript isoforms may contain regions of identity as well as disparate regions and so require specialised tools to capture the regions of dissimilarity. STACK applies CRAW as a post-assembly step to clustering and alignment in order to facilitate discrimination between distinct gene isoforms (6). Transcript variants are partitioned into sub-clusters that allow for simultaneous viewing of inconsistencies within a cluster. An example is fibulin (expressed in brain, parathyroid tumour, placenta, fibroblast, pancreas, heart, lung, testis, skin tumour) which exists as four or more isoforms (A–D) and each is clearly partitioned within the STACK whole-body index cluster 133232_3 (Fig. 1). Fibulin’s B isoform (X53742) and its corresponding ESTs are displayed as a stretch of 1s in the ASCII representation of each sequence (Fig. 1, blue box). Sequences corresponding to isoform C have been partitioned into a sub-cluster displayed as a string of 2s (Fig. 1, red box).
Figure 1.
Craw output for a whole-body index cluster displaying alternate gene isoforms of the fibulin gene. The blue box indicates the region capturing the fibulin-1B isoform whereas sequences capturing fibulin-1C are surrounded by a red box.
Tissue specificity
STACK allows the user to rapidly explore 15 tissue categories, a disease-related category and a whole-body index. The tissue-based segmentation speeds disease analysis and functional annotation by providing the user with an immediate representation of areas of the body where a gene is expressed as well as detailed library information that pinpoints the expression location for primary and alternate expression transcripts. For example, STACK was used in the characterisation of the retinitis pigmentosa (RP1) gene. Matches with an eye-specific transcript in STACK were used successfully in the mapping of retina-specific ESTs to chromosomal regions that coincide with the RP1 locus (13).
DATA ACCESS VIA THE WEB
The STACK database can be queried via the Web at http://www.sanbi.ac.za/stacksearch.html using a sequence as input. The BLAST search algorithms implemented in the search engine allow for both DNA and protein queries. The results of a blast query are hyperlinked to the STACK viewer, which allows for the extraction of detailed information pertaining to the matching STACK sequence (Figs 2 and 3). STACK consensus sequences matched to Drosophila sequences are searchable on the Drosophila Related Expressed Sequences (DRES) home page at the Telethon Institute of Genetics and Medicine (http://www.tigem.it).
Figure 2.

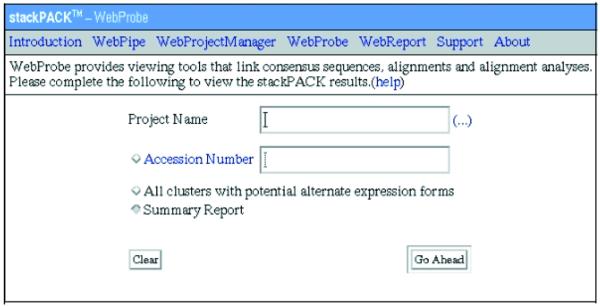
WebProbe, the STACK database extraction and viewing tool. The STACK tissue category is used as input to the ‘project name’ field that returns a list of all the clustered information.
Figure 3.
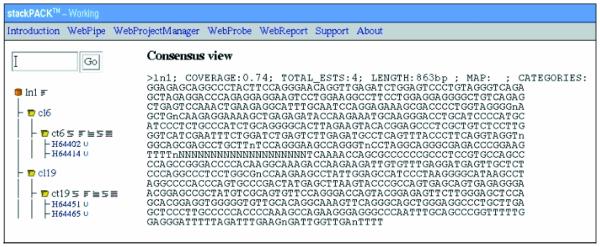
An example linked entry for the olfactory tissue. The clusters contributing to the linked entry are displayed together with the ESTs comprising each cluster. A mouse click on a specific clusterID executes the download of the FASTA formatted multi-sequence file. The hyperlinks to the right of the clusterID provides for the display of detailed information pertaining to a cluster such as phrap alignments, consensus sequence and assembly analysis information. UniGene links to each EST are provided if they exist.
Alternatively, all clustered data for a specific STACK tissue category can be accessed via WebProbe (http://www.sanbi.ac.za/stackpack/webprobe.html; Fig. 2). A query from this page returns a summary report with links to detailed information for all clusters and linked clusters contained within the specified tissue category. For example, Figure 3 illustrates a linked cluster for the olfactory tissue data set. Each cluster contributing to the linked entry is displayed with its constituent EST accession numbers and hyperlinks to additional information such as PHRAP alignments, consensus view and assembly analysis data. A FASTA formatted file containing all the sequences for a specified cluster can be downloaded by clicking on the clusterID. The WebReport link on the menu bar allows for downloading of cumulative data for a specific tissue category. These data files include all FASTA input files, consensus sequences, alignment files, alignments for all identified isoforms and assembly reports.
There are plans underway to integrate the STACK database under the sequence retrieval system (SRS) at the European Bioinformatics Institute.
ARCHITECTURAL OVERVIEW AND FUTURE DIRECTIONS
The future development of STACK focuses on linking the underlying data more firmly to biological processes and making the resultant information accessible to a widening range of users. Inclusion of genomic information will be used to map clusters and expression state to genome location, as well as to confirm the quality of the indices. Genome context also allows reorganisation of the index into exons and transcript isoforms. Prediction of proteins from transcript isoforms and cross-references to known protein records follow, opening the door for association with standardised annotations, such as Gene Ontology (http://www.geneontology.org).
Organisationally, STACK will make increasing use of the relational database architecture to enhance data access. Maintenance of clusterIDs, or links to new IDs, from release to release are planned. Entrez-styled querying capabilities are being planned for: (i) access to specialised subsets of the database; (ii) identification of isoforms based on physical or developmental expression states; or (iii) locating entries based on physical location within the genome. The above-mentioned functionality is intended to accelerate gene candidate discovery.
AVAILABILITY
STACK is freely available to academia and is distributed via the web site at http://www.sanbi.ac.za/CODES.
The STACK_PACK tool set performs clustering, clustering management, alignment processing and analysis and is freely available to academic institutions and is distributed from http://www.sanbi.ac.za/CODES.
SUPPLEMENTARY MATERIAL
Supplementary Material, available at NAR Online, includes the following information: a description of STACK, the architectural design and how to effectively search the STACK database. A detailed description of the STACK data format and STACK sequence retrieval can be obtained at http://www.sanbi.ac.za/STACK_description.html.
References
- 1.Houlgatte R., Mariage-Samson,R., Duprat,S., Tessier,A., Bentolila,S., Lamy,B. and Auffray,C. (1995) The Genexpress Index: a resource for gene discovery and the genic map of the human genome. Genome Res., 5, 272–304. [DOI] [PubMed] [Google Scholar]
- 2.Schuler G.D. (1997) Pieces of the puzzle: expressed sequence tags. Nature Genet., 4, 332–333. [DOI] [PubMed] [Google Scholar]
- 3.Quackenbush J., Liang,F., Holt,I., Pertea,G. and Upton,J. (2000) The TIGR Gene Indices: reconstruction and representation of expressed gene sequences. Nucleic Acids Res., 28, 141–145. Updated article in this issue: Nucleic Acids Res. (2001), 29, 159–164. [DOI] [PMC free article] [PubMed] [Google Scholar]
- 4.Hide W., Burke,J. and Davidson,D. (1994) Biological evaluation of d2, an algorithm for high-performance sequence comparison. J. Comput. Biol., 1, 199–215. [DOI] [PubMed] [Google Scholar]
- 5.Burke J., Davidson,D. and Hide,W. (1999) d2_cluster: A validated method for clustering EST and full-length cDNA. Genome Res., 9, 1135–1142. [DOI] [PMC free article] [PubMed] [Google Scholar]
- 6.Burke J., Wang,H., Hide,W. and Davidson,D. (1998) Alternative gene form discovery and candidate gene selection from gene indexing projects. Genome Res., 8, 276–290. [DOI] [PMC free article] [PubMed] [Google Scholar]
- 7.Miller R., Christoffels,A., Gopalakrishnan,C., Burke,J., Ptitsyn,A.A., Broveak,T.R. and Hide,W. (1999) A comprehensive approach to clustering of expressed human gene sequence: The sequence tag alignment and consensus knowledge base. Genome Res., 9, 1143–1155. [DOI] [PMC free article] [PubMed] [Google Scholar]
- 8.Schuler G.D. (1997) Sequence mapping by electronic PCR. Genome Res., 7, 541–550. [DOI] [PMC free article] [PubMed] [Google Scholar]
- 9.Olson M., Hood,L., Cantor,C. and Botstein,D. (1989) A common language for physical mapping of the human genome. Science, 245, 1434–1435. [DOI] [PubMed] [Google Scholar]
- 10.Wilcox A.S., Khan,A.S., Hopkins,J.A. and Sikela,J.M. (1991) Use of 3′ untranslated sequences of human cDNAs for rapid chromosome assignment and conversion of STSs: implications for an expression map of the genome. Nucleic Acids Res., 19, 1837–1843. [DOI] [PMC free article] [PubMed] [Google Scholar]
- 11.Deloukas P., Schuler,G.D., Gyapay,G., Beasley,E.M., Soderlund,C., Rodriguez-Tome,P., Hui,L., Matise,T.C., McKusick,K.B., Beckmann,J.S. et al. (1998) A physical map of 30,000 human genes. Science, 282, 744–746. [DOI] [PubMed] [Google Scholar]
- 12.Bortoluzzi S., d’Alessi,F., Romualdi,C. and Danieli,G.A. (2000) The human adult skeletal muscle transcriptional profile reconstructed by a novel computational approach. Genome Res., 10, 344–349. [DOI] [PMC free article] [PubMed] [Google Scholar]
- 13.Sullivan L.S., Heckenlively,J.R., Bowne,S.J., Zuo,J., Hide,W.A., Gal,A., Denton,M., Inglehearn,C.F., Blanton,S.H. and Diager,S.P. (1999) Mutations in a novel retina-specific gene cause dominant retinitis pigmentosa. Nature Genet., 22, 255–259. [DOI] [PMC free article] [PubMed] [Google Scholar]
Associated Data
This section collects any data citations, data availability statements, or supplementary materials included in this article.


