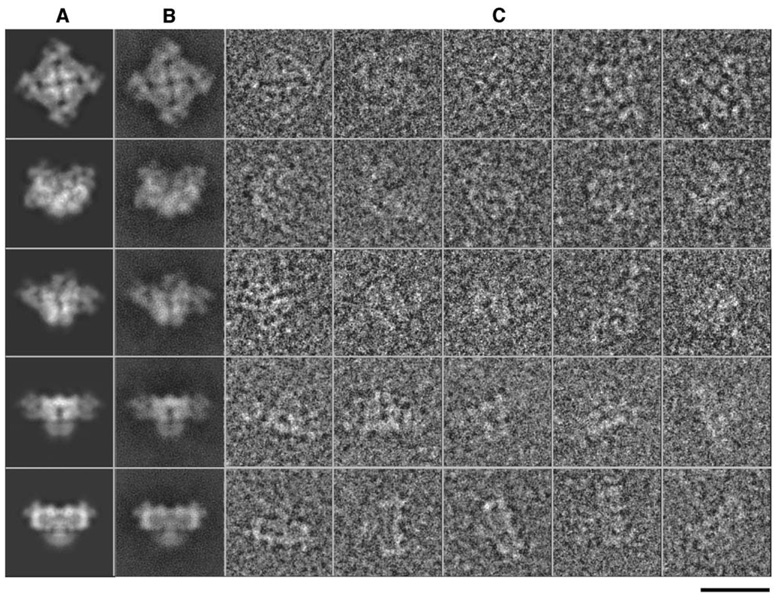
Figure 6. Results from Image Processing and 3D Reconstruction.
(A–C) (A) Selected reprojections of the final 3D structure, (B) corresponding class averages, and (C) raw particle images. Their apparent match is a key indication of the self-consistency of the reconstruction. The bar denotes 250 Å scale.

