Summary
Chemotaxis in C. elegans, like chemotaxis in bacteria1, involves a random walk biased by the time derivative of attractant concentration2,3, but how the derivative is computed is unknown. Laser ablations have shown that the strongest deficits in chemotaxis to salts are obtained when the ASE neurons (ASEL and ASER) are killed, indicating that this pair plays a dominant role4. Although these neurons are left-right homologs anatomically, they exhibit marked asymmetries in gene expression and ion preference5–7. Here, using optical recordings of calcium transients in ASE neurons in intact animals, we demonstrate an additional asymmetry: ASEL is an ON-cell, stimulated by increases in NaCl concentration, whereas ASER is an OFF-cell, stimulated by decreases in NaCl concentration. Both responses are reliable yet transient, indicating that ASE neurons report changes in concentration rather than absolute levels. Recordings from synaptic and sensory transduction mutants show that the ON-OFF asymmetry is the result of intrinsic differences between ASE neurons. Unilateral activation experiments indicate that the asymmetry extends to the level of behavioral output: ASEL lengthens bouts of forward locomotion (runs) whereas ASER promotes direction changes (turns). Strikingly, the input and output asymmetries of ASE neurons are precisely those of a simple yet novel neuronal motif for computing the time derivative of chemosensory information, which is the fundamental computation of C. elegans chemotaxis3,8. Evidence for ON and OFF cells in other chemosensory networks9–12 suggests that this motif may be common in animals that navigate by taste and smell.
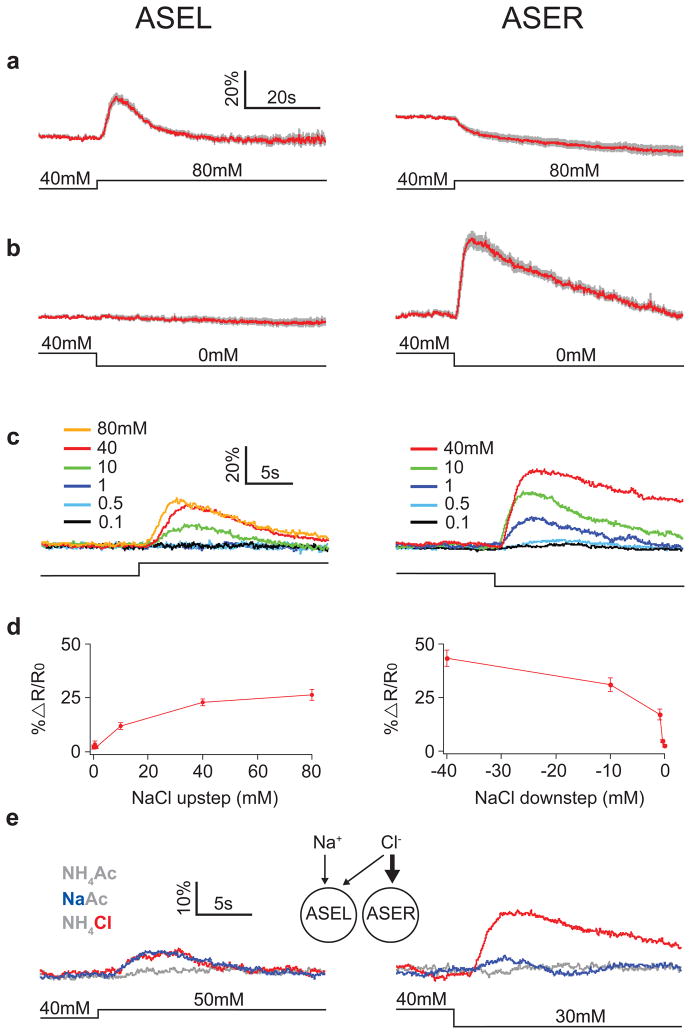
To image the activity of ASE neurons in response to stepwise changes in NaCl concentration, we used the genetically encoded calcium sensor cameleon13, which reports increases in calcium concentration as increases in the ratio of fluorescence at distinct wavelengths. We observed that a stepwise increase (upstep) in NaCl concentration evoked a rapid increase in emission ratio in ASEL (Fig. 1a). Similar results were obtained when upsteps were delivered from different baseline NaCl concentrations (Fig. 4a, Supplemental Fig. 1); emission ratio increases were absent when a calcium-insensitive form of cameleon was used (Supplemental Fig. 2). Thus, ASEL appeared to be activated by an increase in NaCl concentration.
Figure 1. Response of ASEL and ASER to NaCl concentration steps.
a,b. Average calcium transients in ASE neurons in response to NaCl concentration steps of ± 40 mM from a baseline of 40 mM. The gray band represents ± 1 standard error of the mean (SEM). Here and below: transients were imaged using the ratiometric calcium sensor cameleon and traces indicate average percent change in ratio; ASEL is shown on the left and ASER is shown on the right; the concentration step is indicated below the calcium traces; and n ≥ 5 five recordings, with one recording per worm. c. Average calcium transients in response to concentration steps of various amplitudes from a baseline of 40 mM. Trace color denotes step size as indicated in the legends; SEM is not shown. d. Summary of the data in c showing the effect of step size on average peak response amplitude; error bars are ± SEM. e. Differential sensitivity of ASEL and ASER to Na+ and Cl−. Traces are average percent change in calcium signal. Trace color denotes stimulus condition as shown in the legend; n ≥ 5 five recordings, with one recording per worm. See Supplemental Fig. 3 for SEM. The diagram depicts the relative ion sensitivities inferred from the imaging data.
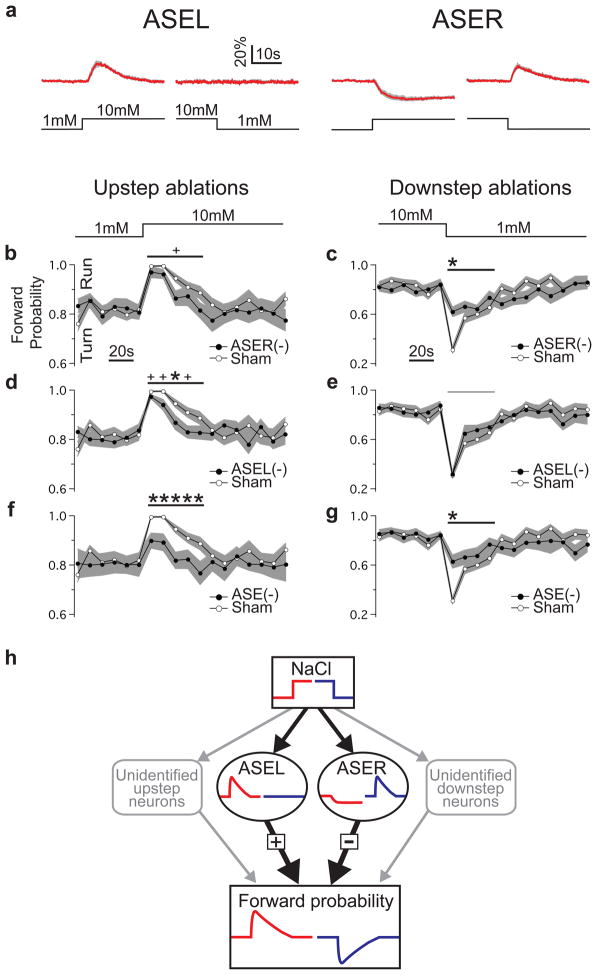
Figure 4. Roles of ASEL and ASER in NaCl step-response behaviour.
a. Average ASE calcium transients in response to concentration steps of ± 9 mM. The concentration step is indicated below each calcium trace. The gray band represents ± 1 standard error of the mean (SEM); n ≥ 5 five recordings, with one recording per worm. b–g. Effects of unilateral and bilateral ASE ablations on the behavioural response to concentration steps. Probability of forward locomotion is plotted against time relative to the step. Statistical significance (ablation vs. sham) was assessed via a repeated measures ANOVA over the indicated time window (horizontal lines above traces) following the step (shown above b and c). Notation and symbols: ASEL(−), ASEL ablation; ASER(−), ASER ablation; ASE(−), bilateral ASE ablation; thick horizontal line, ANOVA significant at p < 0.05 or less; thin horizontal line, not significant; stars, time points at which there were significant difference between means after correcting for multiple comparisons (t test; p < 0.05); pluses, time points at which there were significant differences in uncorrected t tests (p < 0.05). Imaging and behavioural data are from different individuals. The gray band represents ± 1 standard error of the mean with n ≥ 15 in each panel. h. Functional connectivity implied by b–g together with imaging data (panel a and Fig. 1a,b) and unilateral activation experiments (Fig. 3). Unidentified neurons (shown in gray) account for residual behavior when ASE is ablated.
Surprisingly, ASER neurons showed the opposite pattern of response. A stepwise decrease (downstep) in NaCl concentration evoked a rapid increase in emission ratio, and similar results were obtained when downsteps were delivered from different baselines (Fig. 1b, 4a, Supplemental Fig. 1). In addition, we observed that an upstep of NaCl evoked a prominent decrease in the emission ratio in ASER (Fig. 1a, 4a, Supplemental Fig. 1). Neither type of ASER response was evident when we used calcium-insensitive cameleon (Supplemental Fig. 2). Thus, ASER appeared to be activated by a decrease in NaCl concentration and deactivated by an increase in NaCl concentration.
Opposing responses in ASEL and ASER were observed consistently across a range of step durations (from 10 to 60 sec, data not shown) and for a variety of salts, including those that did or did not contain Na+ and Cl− ions (Supplemental Fig. 2). In dose response experiments we found that the magnitude of the responses in ASEL and ASER was a saturating function of step amplitude (Fig. 1c, d) and that ASER is more sensitive than ASEL to small changes in NaCl (Fig. 1c, d). We conclude that opposing responses are a general feature of ASE neurons.
Together, these data indicate that the ASEL and ASER neurons function, respectively, like ON-cells and OFF-cells, a common coding mechanism in visual systems14. Notably, the ON and OFF responses to preferred stimuli were transient in the face of a maintained concentration change. These responses therefore signal changes in salt concentration rather than its absolute level and thus provide the basis for computing the time derivative of concentration.
ASE neurons are reported to have different ion sensitivities, in that killing ASEL impairs chemotaxis mainly to Na+, whereas killing ASER impairs chemotaxis mainly to Cl− ions6. To assess ion sensitivity directly, we imaged the response of ASEL and ASER to 10mM step changes in sodium acetate and ammonium chloride (Fig. 1e, Supplemental Fig. 3); at this step size neither cell responded to ammonium or acetate ions (see also Supplemental Fig. 2b). We found that only ASEL responded to Na+ ions, a result that is consistent with the effects on Na+ chemotaxis when ASEL or ASER are killed. In addition, we found that ASER responded much more strongly to Cl− ions than did ASEL. This result is consistent with the strong effect on Cl− chemotaxis when ASER is killed. The comparatively weak response of ASEL to chloride may or may not be consistent with absence of an effect on Cl− chemotaxis when ASEL is killed; this would depend on the relative sensitivity of imaging and behavioral experiments, which is not known. Overall, we conclude that ASE neurons are differentially sensitive to Na+ and Cl− ions.
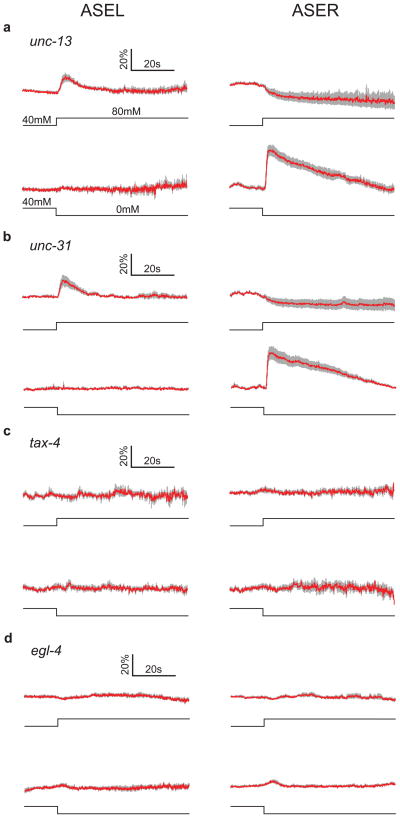
In principle, the opposing responses of ASEL and ASER neurons could result from intrinsic differences between the sensory properties of ASEL and ASER or from intrinsic differences in chemosensory neurons that are presynaptic to ASE neurons. We therefore imaged ASEL and ASER in unc-13 and snb-1 mutants, which have impairments in the release of synaptic vesicles15,16. In addition, we imaged ASE in unc-31 mutants, which are defective for dense-core vesicle release17. We observed that the ON-cell, OFF-cell asymmetry of ASEL and ASER was preserved in each of these mutants (Fig. 2a & b, Supplemental Fig. 4), suggesting that the functional asymmetry of ASE neurons is likely intrinsic rather than synaptic in origin.
Figure 2. Effects of synaptic and signal transduction mutants on ASE sensory responses.
Average ASE calcium transients in four mutant strains in response to NaCl concentration steps of ± 40 mM from a baseline of 40 mM. a,b. Mutants with defects in synaptic vesicle release. c,d. Mutants with defects in cGMP-dependent signaling. In each panel: traces indicate average percent change in ratio; the gray band represents ± 1 standard error of the mean; ASEL is shown on the left and ASER is shown on the right; the concentration step is indicated below each calcium trace; n ≥ 5 five recordings, with one recording per worm.
The mechanism of sensory transduction in ASE neurons is unknown but the cGMP-dependent pathway is a strong candidate in two respects. First, salt chemotaxis is impaired by mutations in the genes tax-2 and tax-4, which are expressed in ASE neurons and encode subunits of a cGMP-gated cation channel18,19. Second, salt chemotaxis is also impaired by mutations in the gene egl-4, which is expressed in ASE neurons and encodes a cGMP-dependent protein kinase (PKG)20,21. When we imaged calcium responses to NaCl upsteps and downsteps in ASEL and ASER in both tax-2 and tax-4 mutants, we found that the absence of either tax-2 or tax-4 function eliminated all responses in ASE neurons (Fig. 2c, Supplemental Fig. 4). These results support a model in which ASE responses are mediated by cGMP signaling. The ON-OFF asymmetry of ASE neurons could be explained if cGMP levels are increased by upsteps in ASEL and by downsteps in ASER. ASE responses were also completely absent in egl-4 mutants (Fig. 2d), indicating that PKG is also required for salt detection. EGL-4 regulates olfactory adaptation involving phosphorylation of the TAX-2 protein in other C. elegans neurons22. Thus, salt adaptation and detection may be linked in ASE neurons.
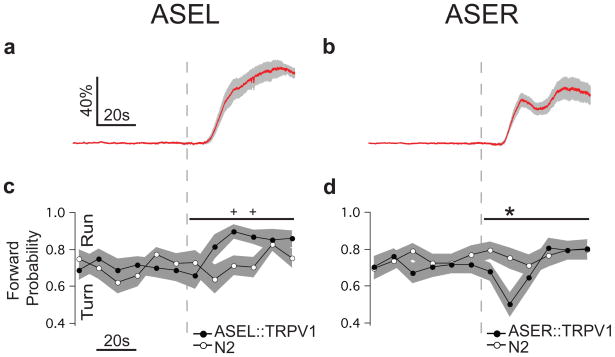
Behavioural studies have shown that NaCl upsteps increase the probability of forward locomotion and, concomitantly, decrease the probability of turning, whereas downsteps have the opposite effects8. The fact that ASEL and ASER are strongly activated by upsteps and downsteps, respectively (Fig. 1a, b), suggests that ASEL contributes to upstep behaviour whereas ASER contributes to downstep behaviour. To test this model, we selectively activated either ASEL or ASER via transgenic strains in which the mammalian cation channel TRPV1, which opens in response to the exogenous ligand capsaicin, is expressed either in ASEL or ASER23. Calcium imaging showed that only the ASE neuron expressing TRPV1 was activated by capsaicin (Fig. 3a & b, Supplemental Fig. 5). We found that activation of ASEL elevated forward probability (Fig. 3c, ANOVA, p < 0.01) whereas activation of ASER had the opposite effect (Fig. 3d, ANOVA, p < 0.05). We conclude that ASEL activation causes runs whereas ASER activation causes turns; thus the functional asymmetry between ASE neurons extends to the level of behavioural output.
Figure 3. Unilateral activation of ASEL and ASER.
a,b. Average capsaicin induced calcium transients in strains expressing the capsaicin receptor TRPV1 exclusively in either ASEL or ASER. The dashed line indicates the onset of capsaicin application, which was maintained for the duration of the experiment (ASEL 25μM, n = 6; ASER 5μM, n = 7). The gray band represents ± 1 standard error of the mean (SEM). c,d. Behavioural effects of capsaicin in the strains shown in a and b at the same capsaicin concentrations. The probability of forward locomotion is plotted against time. An increase in forward probability is termed a run whereas a decrease in forward probability is termed a turn. Statistical significance (TRPV1 strain vs. wild-type N2) was assessed via a repeated measures ANOVA over a 1 min. window (horizontal line above traces; p values are given in the text) following capsaicin application. Stars, significant differences between the means at each time point after correcting for multiple comparisons (t test; p < 0.05); pluses, significant differences detected in uncorrected t tests (p < 0.05). Imaging and behavioural data are from different individuals. The gray band represents ± 1 standard error of the mean with n ≥ 22.
The question remained, however, whether ASE neurons make a necessary contribution to the run and turn behaviors that underlie chemotaxis to salts such as NaCl3,8. When ASER was killed and animals were tested with its preferred stimulus (a downstep), we observed a large deficit in turn behavior (Fig. 4c; ANOVA, p < 10−3; Supplemental Fig. 6); the presence of residual turn behaviour is consistent with the observation that chemosensory neurons other than ASE neurons contribute to chemotaxis4. Conversely, when ASER was killed and animals were tested with its non-preferred stimulus (an upstep), we observed a small but significant deficit in run behavior (Fig. 4b; ANOVA, p < 0.01). In confirmation, we found that when ASER was killed together with ASEL, the defect in the response to upsteps was greater than when ASEL alone was killed (Fig. 4f vs. d; ANOVA, p < 0.05). We conclude that ASER makes a necessary contribution to runs and turns. Notably, because ASER is deactivated by its non-preferred stimulus (Fig. 1a, Fig. 4a), ASER’s positive contribution to run behavior in intact animals must be the result of de-suppression of forward probability. This finding suggests that ASER is tonically active at the baseline NaCl concentration, like at least one olfactory neuron in C. elegans24.
When ASEL was killed and animals were tested with its preferred stimulus (an upstep), we observed a significant deficit in run behavior (Fig. 4d; ANOVA, p < 10−3; Supplemental Fig. 6); the presence of residual run behaviour is, again, consistent with the observation that other chemosensory neurons contribute to chemotaxis4. In contrast, when ASEL was killed and animals were tested with its non-preferred stimulus (a downstep), we found no deficit in turn behaviour (Fig. 4e; ANOVA, p = 0.13), nor did killing ASEL together with ASER enhance the deficit produced by killing ASER alone (Fig. 4c vs. g; ANOVA, p = 0.50). Thus, ASEL makes a necessary contribution to runs but not turns.
We have shown that a left-right homologous pair of chemosensory neurons is functionally asymmetric at the cellular level: ASEL acts like an ON-cell, is specialized for Na+ sensation, and causes runs, whereas ASER acts like an OFF-cell, is specialized for Cl− detection, and causes turns. ON-cells and OFF-cells are a common feature of early stages in visual processing14. ON-cell chemosensory neurons are also well known, as are chemosensory neurons that hyperpolarize in response to concentration increases25,26 and chemosensory OFF-cells, including the AWC olfactory neurons in C. elegans9–12,24. However, the observation of a single pair of anatomically homologous chemosensory neurons with ON-OFF functionality and differential chemical sensitivity appears to be unprecedented.
The asymmetry of ASE neurons at the sensory level (ON-cell vs. OFF-cell) and the behavioural level (runs vs. turns) immediately suggests that the time derivative is computed, at least in part, by a two-stage neuronal motif (Fig. 4h). First, each ASE neuron is transiently activated by its preferred stimulus such that the time course of ASEL activation approximates the derivative of an upstep, whereas the time course of ASER activation approximates the inverse derivative of a downstep. Second, the effects of ASE activation converge, but with opposing effects: ASEL positively regulates forward locomotion whereas ASER negatively regulates it, causing turns. Thus, at the point of convergence, the net effect of ASE activation is a behavioral signal that approximates the time derivative of salt concentration. The functional asymmetries of ASE neurons may have emerged as a means of computing a quantity that is essential to chemotaxis in this organism. ASE asymmetry is established and maintained by a complex gene regulatory network7; the critical role of chemotaxis in the search for food and habitat27,28 would appear to justify the complexity of this network.
Methods Summary
Calcium imaging
Animals expressing cameleon YC2.12 in ASEL and ASER neurons were glued to a coverslip and submerged in a pool of saline. NaCl steps were produced by placing the worm in a plume between an inflow and an outflow pipette; the solution feeding the plume was changed by valves controlled by the data acquisition system. For ratiometry, images in two distinct wavelength bands were projected in juxtaposition on the photodetector via a beam splitter.
Selective activation of ASE neurons
The capsaicin receptor TRPV1 was expressed exclusively in ASEL or ASER using the gcy-7 and gcy-5 promoters, respectively5. Worms were glued to coverslips, but here the tail was free to move. Capsaicin was delivered as above. Behaviour was scored manually by pressing computer keys to record bouts of forward swimming29; the observer was blind to genotype.
Neuronal ablations
ASE neurons were identified by position and killed with a focused laser beam30. Behaviour was tested using the concentration-clamp assay8 in which a worm is placed on a porous membrane that is infused from below by a pair of inverted showerheads that emit osmotically balanced solutions with different NaCl concentrations; concentration changes are produced by sliding the showerhead assembly relative to the worm. Behavior was scored as above.
Supplementary Material
Acknowledgments
We thank the Caenorhabditis Genetics Center for strains, C. Frøkjœr-Jensen for strain integration and D. Juluis for the TRPV1 cDNA. Support was provided by grants from the NIH (MH051383 to SRL; DA016445 to WRS), NSF (IOB-0543643 to SRL) and HFSP (to WRS).
Footnotes
Author Contributions H.S. planned and did experiments first revealing ASE ON/OFF function and effects of transduction and synaptic mutants, made imaging and direct activation reagents, acquired supplemental ion sensitivity data, wrote text. T.R.T. planned and did ON/OFF, dose-response, genetics, direct activation, and ablation experiments in text and supplemental material, made imaging reagents and figures, co-wrote the final manuscript. S.F. planned and did genetics and ion selectivity imaging in text and supplemental material. M.E. developed dose response methodologies. S.R.L. planned imaging and behavioural experiments, devised the derivative model, co-wrote the final manuscript. W.R.S. planned imaging and genetics experiments, drafted the manuscript.
References
- 1.Segall JE, Block SM, Berg HC. Temporal comparisons in bacterial chemotaxis. Proc Natl Acad Sci U S A. 1986;83:8987–8991. doi: 10.1073/pnas.83.23.8987. [DOI] [PMC free article] [PubMed] [Google Scholar]
- 2.Dusenbery DB. Responses of the nematode Caenorhabditis elegans to controlled chemical stimulation. J Comp Physiol. 1980;136:127–331. [Google Scholar]
- 3.Pierce-Shimomura JT, Morse TM, Lockery SR. The fundamental role of pirouettes in Caenorhabditis elegans chemotaxis. J Neurosci. 1999;19:9557–9569. doi: 10.1523/JNEUROSCI.19-21-09557.1999. [DOI] [PMC free article] [PubMed] [Google Scholar]
- 4.Bargmann CI, Horvitz HR. Chemosensory neurons with overlapping functions direct chemotaxis to multiple chemicals in C. elegans. Neuron. 1991;7:729–742. doi: 10.1016/0896-6273(91)90276-6. [DOI] [PubMed] [Google Scholar]
- 5.Yu S, Avery L, Baude E, Garbers DL. Guanylyl cyclase expression in specific sensory neurons: a new family of chemosensory receptors. Proc Natl Acad Sci USA. 1997;94:3384–3387. doi: 10.1073/pnas.94.7.3384. [DOI] [PMC free article] [PubMed] [Google Scholar]
- 6.Pierce-Shimomura JT, Faumont S, Gaston MR, Pearson BJ, Lockery SR. The homeobox gene lim-6 is required for distinct chemosensory representations in C. elegans. Nature. 2001;410:694–698. doi: 10.1038/35070575. [DOI] [PubMed] [Google Scholar]
- 7.Johnston RJ, Jr, Chang S, Etchberger JF, Ortiz CO, Hobert O. MicroRNAs acting in a double-negative feedback loop to control a neuronal cell fate decision. Proc Natl Acad Sci U S A. 2005;102:12449–12454. doi: 10.1073/pnas.0505530102. [DOI] [PMC free article] [PubMed] [Google Scholar]
- 8.Miller AC, Thiele TR, Faumont S, Moravec ML, Lockery SR. Step-response analysis of chemotaxis in Caenorhabditis elegans. J Neurosci. 2005;25:3369–3378. doi: 10.1523/JNEUROSCI.5133-04.2005. [DOI] [PMC free article] [PubMed] [Google Scholar]
- 9.Takagi SF, Shibuya T. ‘On’- and ‘Off’-responses of the olfactory epithelium. Nature. 1959;184:60. doi: 10.1038/184060a0. [DOI] [PubMed] [Google Scholar]
- 10.Mair RG. Response properties of rat olfactory bulb neurones. J Physiol. 1982;326:341–359. doi: 10.1113/jphysiol.1982.sp014197. [DOI] [PMC free article] [PubMed] [Google Scholar]
- 11.Hinterwirth A, Zeiner R, Tichy H. Olfactory receptor cells on the cockroach antennae: responses to the direction and rate of change in food odour concentration. Eur J Neurosci. 2004;19:3389–3392. doi: 10.1111/j.0953-816X.2004.03386.x. [DOI] [PubMed] [Google Scholar]
- 12.Liu L, et al. Drosophila hygrosensation requires the TRP channels water witch and nanchung. Nature. 2007;450:294–298. doi: 10.1038/nature06223. [DOI] [PubMed] [Google Scholar]
- 13.Miyawaki A, et al. Fluorescent indicators for Ca2+ based on green fluorescent proteins and calmodulin. Nature. 1997;388:882–887. doi: 10.1038/42264. [DOI] [PubMed] [Google Scholar]
- 14.Schiller PH. The ON and OFF channels of the visual system. Trends Neurosci. 1992;15:86–92. doi: 10.1016/0166-2236(92)90017-3. [DOI] [PubMed] [Google Scholar]
- 15.Richmond JE, Davis WS, Jorgensen EM. UNC-13 is required for synaptic vesicle fusion in C. elegans. Nat Neurosci. 1999;2:959–964. doi: 10.1038/14755. [DOI] [PMC free article] [PubMed] [Google Scholar]
- 16.Nonet ML, Saifee O, Zhao H, Rand JB, Wei L. Synaptic transmission deficits in Caenorhabditis elegans synaptobrevin mutants. J Neurosci. 1998;18:70–80. doi: 10.1523/JNEUROSCI.18-01-00070.1998. [DOI] [PMC free article] [PubMed] [Google Scholar]
- 17.Speese S, et al. UNC-31 (CAPS) is required for dense-core vesicle but not synaptic vesicle exocytosis in Caenorhabditis elegans. J Neurosci. 2007;27:6150–6162. doi: 10.1523/JNEUROSCI.1466-07.2007. [DOI] [PMC free article] [PubMed] [Google Scholar]
- 18.Coburn CM, Bargmann CI. A putative cyclic nucleotide-gated channel is required for sensory development and function in C. elegans. Neuron. 1996;17:695–706. doi: 10.1016/s0896-6273(00)80201-9. [DOI] [PubMed] [Google Scholar]
- 19.Komatsu J, Mori I, Rhee JS, Akaike N, Ohshima Y. Mutations in a cyclic neucleotide-gated channel lead to abnormal thermosensation and chemosesnation in C. elegans. Neuron. 1996;17:707–718. doi: 10.1016/s0896-6273(00)80202-0. [DOI] [PubMed] [Google Scholar]
- 20.Daniels SA, Ailion M, Thomas JH, Sengupta P. egl-4 acts through a transforming growth factor-beta/SMAD pathway in Caenorhabditis elegans to regulate multiple neuronal circuits in response to sensory cues. Genetics. 2000;156:123–141. doi: 10.1093/genetics/156.1.123. [DOI] [PMC free article] [PubMed] [Google Scholar]
- 21.Hirose T, et al. Cyclic GMP-dependent protein kinase EGL-4 controls body size and lifespan in C. elegans. Development. 2003;130:1089–1099. doi: 10.1242/dev.00330. [DOI] [PubMed] [Google Scholar]
- 22.L’Etoile ND, et al. The cyclic GMP-dependent protein kinase EGL-4 regulates olfactory adaptation in C. elegans. Neuron. 2002;36:1079–1089. doi: 10.1016/s0896-6273(02)01066-8. [DOI] [PubMed] [Google Scholar]
- 23.Tobin D, et al. Combinatorial expression of TRPV channel proteins defines their sensory functions and subcellular localization in C. elegans neurons. Neuron. 2002;35:307–318. doi: 10.1016/s0896-6273(02)00757-2. [DOI] [PubMed] [Google Scholar]
- 24.Chalasani SH, et al. Dissecting a circuit for olfactory behaviour in Caenorhabditis elegans. Nature. 2007;450:63–70. doi: 10.1038/nature06292. [DOI] [PubMed] [Google Scholar]
- 25.de Bruyne M, Foster K, Carlson JR. Odor coding in the Drosophila antenna. Neuron. 2001;30:537–552. doi: 10.1016/s0896-6273(01)00289-6. [DOI] [PubMed] [Google Scholar]
- 26.Michel WC, McClintock TS, Ache BW. Inhibition of lobster olfactory receptor cells by an odor-activated potassium conductance. J Neurophysiol. 1991;65:446–453. doi: 10.1152/jn.1991.65.3.446. [DOI] [PubMed] [Google Scholar]
- 27.Hills T, Brockie PJ, Maricq AV. Dopamine and glutamate control area-restricted search behavior in Caenorhabditis elegans. J Neurosci. 2004;24:1217–1225. doi: 10.1523/JNEUROSCI.1569-03.2004. [DOI] [PMC free article] [PubMed] [Google Scholar]
- 28.Gray JM, Hill JJ, Bargmann CI. A circuit for navigation in Caenorhabditis elegans. Proc Natl Acad Sci U S A. 2005;102:3184–3191. doi: 10.1073/pnas.0409009101. [DOI] [PMC free article] [PubMed] [Google Scholar]
- 29.Faumont S, Miller AC, Lockery SR. Chemosensory behavior of semi-restrained Caenorhabditis elegans. J Neurobiol. 2005;65:171–178. doi: 10.1002/neu.20196. [DOI] [PubMed] [Google Scholar]
- 30.Bargmann CI, Avery L. Laser killing of cells in Caenorhabditis elegans. Methods Cell Biol. 1995;48:225–250. doi: 10.1016/s0091-679x(08)61390-4. [DOI] [PMC free article] [PubMed] [Google Scholar]
Associated Data
This section collects any data citations, data availability statements, or supplementary materials included in this article.


