Abstract
The Basques are a culturally isolated population, living across the western border between France and Spain and speaking a non-Indo-European language. They show outlier allele frequencies in the ABO, RH, and HLA loci. To test whether Basques are a genetic isolate with the features that would make them good candidates in genetic association studies, we genotyped 123 SNPs in a 1-Mb region in chromosome 22 in Basque samples from France and Spain, as well as in samples from northern and southern Spain, and in three North African samples. Both Basque samples showed similar levels of heterozygosity to the other populations, and the decay of linkage disequilibrium with physical distance was not different between Basques and non-Basques. Thus, Basques do not show the genetic properties expected in population isolates.
Keywords: Basques, linkage disequilibrium, genetic isolates
Introduction
It has often been suggested that genetically isolated populations would offer increased statistical power to detect association because of the impact on their genomic structure of their particular demography.1 Linkage disequilibrium (LD) would be higher than in other populations because of the reduced effective population size, which limits the number of haplotypes that can be present in the population. Moreover, such populations are expected to be genetically more homogeneous, which may translate into being less diverse in the genetic architecture of susceptibility to a particular complex disease.
An apparent candidate as a genetically isolated population suitable for association studies is the Basques. They live in a small area straddling the westernmost section of the French–Spanish border, and speak an isolated, non-Indo-European language. Basques have been described as the most differentiated population in continental western Europe based on classical polymorphisms (ie, blood groups, enzyme polymorphism, and HLA).2 Their mtDNA sequences and Y-chromosome polymorphisms do not show such relatively intense differences, and locate them at the end of European-wide gradients in the frequencies of the most common European lineages, namely mtDNA haplogroup H3, 4 and Y-chromosome haplogroup R1b-M2695, 6, 7 lineage frequencies. As for other DNA autosomal markers, a survey of 11 Alu insertion polymorphisms showed that their allele frequencies were not significantly different between Basques and other Iberians.8 A genome scan of 650 000 SNPs seemed to slightly differentiate French Basques from other western European populations (see Figure 2a in Li et al9); however, given the samples analyzed, such a data set cannot be used to place Basques directly in an Iberian context. In summary, the previous assumption that Basques are strong genetic outliers has been challenged by a number of studies.
In the present study, we seek to verify whether Basques show indeed the genetic features that would make them more appropriate than other populations for genetic association studies. With this aim, we genotyped 123 SNPs in a ∼1-Mb region of chromosome 22 in two Basque populations, as well as in three other nonisolated Spanish populations, as controls. In addition, this data set can be used to explore the genetic heterogeneity of Spanish populations; because a major source of heterogeneity might be the different contribution of the North African populations7 (a varying proportion of the Iberian Peninsula was ruled by North African Muslims from 711 to 1492 ), we also genotyped three North African populations.
Material and methods
Samples
We genotyped a total of 541 individuals from eight populations: Basques from Iparralde (the part of the Basque country lying in France) (N=85), Basques from Gipuzkoa (a province of Spain) (N=61), Catalans (in northeastern Iberia) (N=75), Extremadura in southwest Spain (N=36), Andalusians in southern Spain (N=60), north Moroccans (N=84) and south Moroccans (N=84), both mostly Berber-speakers, and Saharauis (N=56), that is, inhabitants of the western Sahara. All individuals had all four grandparents born in the same region. Informed consent was obtained from all donors. Part of the samples was gathered within the LD Europe European project, led by H Cann, CEPH, Paris.
SNP selection and genotyping
SNPs were selected and genotyped as in González-Neira et al.10 Briefly, SNPs were selected from dbSNP build 115 in a region spanning 987 872 bp in chromosome 22, from 32 600 114 to 33 587 986 bp (NCBI Build 34). The 1-Mb region begins at the 3′-end of the glycosyltransferase-like protein LARGE. Three transcripts and nine Gnomon-model predicted genes (www.ncbi.nlm.nih.gov/projects/mapview) map in this region. After we selected and genotyped this region, newer genome releases have shown that it is actually closer to the LARGE gene: in build 36.3, it overlaps by 50 kb with the last intron and exon of the 664-kb LARGE gene. We investigated whether selection may have acted to distort interpopulation differentiation patterns in this region within the geographic area analyzed. LD patterns, FST values in Europe, and the expected neutral FST distribution (see details of this analysis in Supplementary materials) did not reveal any trace of selection driven by LARGE or by any unknown, functional element in the region.
The final data set consisted of 123 SNPs, with an average distance between contiguous SNPs of 8097 bp, and a 95% of the distances fall between 931 and 21 781 bp.
Statistical analysis
Genotypic data were managed with the SNPator platform (www.snpator.org).11 Average heterozygosities and the average number of alleles was directly calculated using the Arlequin package version 2.00,12 http://anthropologie.unige.ch/arlequin/. Arlequin was also used to compute FST distances among populations and to perform AMOVA. The FST distance matrix was visualized by means of multidimensional scaling (MDS) computed with Statistica version 6.0. Negative FST values were set to zero.
LD was described by computing r2, and by counting the proportion of SNP pairs that had r2-values ≥0.8 for different bins of physical distance. LD parameters were computed with Haploview, which was also used to find pairwise tagSNPs within each population by means of the tagger algorithm.13 Haploview infers haplotypes by means of an expectation–maximization algorithm.
Results
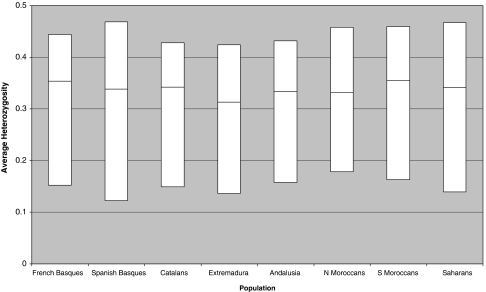
The median and interquartile range for heterozygosity is plotted for each population in Figure 1. Average heterozygosity was actually larger in the two Basque samples than in other Iberian populations; this difference reached statistical significance with Extremadura (P∼10−5 both with French and Spanish Basques, Wilcoxon's nonparametric test), probably given the smaller sample size in Extremadura and the larger number of monomorphic SNPs in this sample.
Figure 1.
Median and interquartile range for heterozygosity of 123 SNPs in several Iberian and Northwestern African population samples.
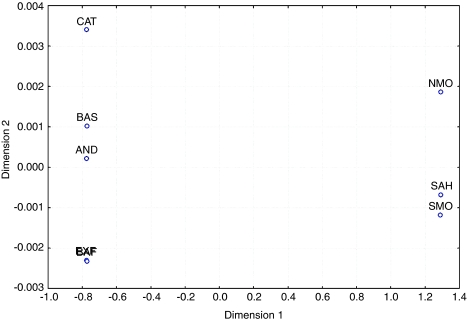
FST genetic distances were computed either with the whole 123-SNP data set or with the set of the 56 SNPs that were tagSNPs in each of the eight populations, and were plotted with MDS. Both data sets produced very similar results, and only the latter is presented in Figure 2. Stress was 0.0005 (P<0.01, Sturrock and Rocha14). The MDS plot shows that genetic variation can be described with a single component, namely, Iberian vs North African populations (note the huge difference in scale between components 1 and 2), and Basques are not differentiated from other Iberian populations.
Figure 2.
Multidimensional scaling plot based on FST genetic distances computed from the allele frequencies of 56 tagSNPs. BAF, French Basques; BAS, Spanish Basques; CAT, Catalans; EXT, Extremadura; AND, Andalusians; NMO, North Moroccans; SMO, South Moroccans; SAH, Saharans.
Next, we tested for the significance of the genetic differences apparent in the FST matrix by means of AMOVA. As above, we used the whole data set or the set of tagSNPs, with very similar results. FST among all populations is 1.03% (P<0.001), and FCT is 2.05% (P=0.02) among the Iberians and North Africans. FCT was much lower between Basques and Iberian non-Basques (−0.02%, which has to be taken as 0). That is, allele frequencies for 123 SNPs show no statistically significant difference among Basques and non-Basques.
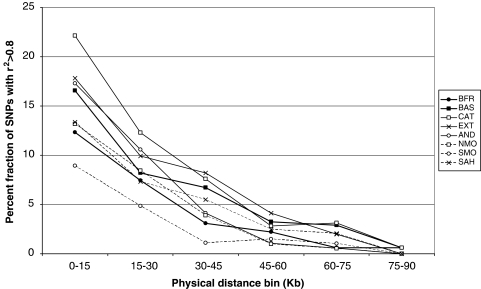
Finally, we analyzed LD. Average r2 between adjacent SNPs was lower in French Basques than in any other Iberian sample (P<0.014, Wilcoxon's test), whereas it was similar (and not significantly different) in Spanish Basques. In Figure 3, the proportion of SNP pairs in each physical distance bin with r2>0.8 is plotted, for SNPs with minor allele frequencies (MAF) above 0.05. We verified the hypothesis that the Basques may have a slower LD decay. It is apparent from Figure 3 that this is not the case; actually, French Basques show significantly more LD than Catalans at the 0–15 kb bin (P=0.024 for the whole SNP data set and P=0.012 for MAF>0.05), and Spanish Basques, as other Iberian populations, show less LD than Southern Moroccans at the 0–15 kb and 30–45 kb bins (P=0.038 and P=0.006 for the whole set; P=0.042 and P=0.004, respectively, for the MAF>0.05 subset). A similar pattern was found when analyzing average r2 within each distance bin (data not shown).
Figure 3.
Proportion of SNP pairs with R2>0.8 as a function of physical distance. Only SNPs with a minor allele frequency above 0.05 were used. Abbreviations as in Figure 2.
Discussion
We have found that Basques have similar or larger heterozygosity, and similar or smaller LD than other Iberians, from which they are not differentiated in their allele frequencies. Thus, we must conclude that, at least as gathered from this genomic region, Basques do not exhibit the genomic properties that would make them a particularly attractive population for association studies.
Our finding that Basques are not genetically differentiated contrasts sharply with previous reports that showed them to be outliers in the genetic variation of western Europe, and appears more in line with the observations from mtDNA sequences and Y-chromosome polymorphisms3, 4, 5, 6, 7 or for whole-genome scans of SNP variation9 (in another recent whole-genome scan,15 French Basques were the only western European population analyzed, and thus, their status as outlier in Europe could not be properly assessed). The loci with the largest allele frequency differences in previous studies2 were ABO, RH, and other blood groups, that is, glycoproteins of the red cell membrane, as well as the HLA histocompatibility system. These genes share a common trait: they are involved in pathogen–human interaction. It is tempting to speculate, then, that such differences were not exclusively due to founder effects and subsequent reduced gene flow, but that microgeographical natural selection, possibly linked to pathogens, had also played a role. A whole-genome scan of 3000 British subjects16 found that, within Britain, HLA was also one of the genomic regions showing the strongest differentiation, and natural selection was also invoked in that case for this geographical differentiation.
These results have strong implications in two partly overlapping fields: on the one hand, it joins a number of studies3, 4, 5, 6, 7, 8, 9 in contradicting the previous extensive literature2, 17, 18, 19, 20, 21 on the genetic distinctiveness of the Basques as a result of population processes and with a strong interaction with cultural isolation; and, on the other hand, on the putative use of the Basques (and of other European isolates yet to be characterized) as a population of choice in understanding the genetic basis of complex traits and diseases.
Acknowledgments
Bioinformatic services were kindly provided by the Genomic Diversity node, Spanish Bioinformatic Institute (www.inab.org). This paper was greatly improved by the contribution of three anonymous reviewers.
Footnotes
Supplementary Information accompanies the paper on European Journal of Human Genetics website (http://www.nature.com/ejhg)
Supplementary Material
References
- Laan M, Paabo S. Mapping genes by drift-generated linkage disequilibrium. Am J Hum Genet. 1998;63:654–656. doi: 10.1086/301972. [DOI] [PMC free article] [PubMed] [Google Scholar]
- Calafell F, Bertranpetit J. Principal component analysis of gene frequencies and the origin of Basques. Am J Phys Anthropol. 1994;93:201–215. doi: 10.1002/ajpa.1330930205. [DOI] [PubMed] [Google Scholar]
- Bertranpetit J, Sala J, Calafell F, Underhill PA, Moral P, Comas D. Human mitochondrial DNA variation and the origin of Basques. Ann Hum Genet. 1995;59 Part 1:63–81. doi: 10.1111/j.1469-1809.1995.tb01606.x. [DOI] [PubMed] [Google Scholar]
- Salas A, Comas D, Lareu MV, Bertranpetit J, Carracedo A. mtDNA analysis of the Galician population: a genetic edge of European variation. Eur J Hum Genet. 1998;6:365–375. doi: 10.1038/sj.ejhg.5200202. [DOI] [PubMed] [Google Scholar]
- Rosser ZH, Zerjal T, Hurles ME, et al. Y-chromosomal diversity in Europe is clinical and influenced primarily by geography, rather than by language. Am J Hum Genet. 2000;67:1526–1543. doi: 10.1086/316890. [DOI] [PMC free article] [PubMed] [Google Scholar]
- Alonso S, Flores C, Cabrera V, et al. The place of the Basques in the European Y-chromosome diversity landscape. Eur J Hum Genet. 2005;13:1293–1302. doi: 10.1038/sj.ejhg.5201482. [DOI] [PubMed] [Google Scholar]
- Adams SM, Bosch E, Balaresque PL, et al. The genetic legacy of religious diversity and intolerance: paternal lineages of Christians, Jews, and Muslims in the Iberian Peninsula. Am J Hum Genet. 2008;83:725–736. doi: 10.1016/j.ajhg.2008.11.007. [DOI] [PMC free article] [PubMed] [Google Scholar]
- Comas D, Calafell F, Benchemsi N, et al. Alu insertion polymorphisms in NW Africa and the Iberian Peninsula: evidence for a strong genetic boundary through the Gibraltar Straits. Hum Genet. 2000;107:312–319. doi: 10.1007/s004390000370. [DOI] [PubMed] [Google Scholar]
- Li JZ, Absher DM, Tang H, et al. Worldwide human relationships inferred from genome-wide patterns of variation. Science. 2008;319:1100–1104. doi: 10.1126/science.1153717. [DOI] [PubMed] [Google Scholar]
- González-Neira A, Ke XY, Lao O, et al. The portability of tagSNPs across populations: a worldwide survey. Genome Res. 2006;16:323–330. doi: 10.1101/gr.4138406. [DOI] [PMC free article] [PubMed] [Google Scholar]
- Morcillo-Suarez C, Alegre J, Sangros R, et al. SNP analysis to results (SNPator): a web-based environment oriented to statistical genomics analyses upon SNP data. Bioinformatics. 2008;24:1643–1644. doi: 10.1093/bioinformatics/btn241. [DOI] [PubMed] [Google Scholar]
- Schneider S, Roessli D, Excoffier L. Switzerland: Genetics and Biometry Laboratory, University of Geneva; 2000. Arlequin 2.000: a software for population genetic data analysis. [Google Scholar]
- de Bakker PI, Yelensky R, Pe'er I, Gabriel SB, Daly MJ, Altshuler D. Efficiency and power in genetic association studies. Nat Genet. 2005;37:1217–1223. doi: 10.1038/ng1669. [DOI] [PubMed] [Google Scholar]
- Sturrock K, Rocha J. A multidimensional scaling stress evaluation table. Field Methods. 2000;12:49–60. [Google Scholar]
- Jakobsson M, Scholz SW, Scheet P, et al. Genotype, haplotype and copy-number variation in worldwide human populations. Nature. 2008;451:998–1003. doi: 10.1038/nature06742. [DOI] [PubMed] [Google Scholar]
- WTCCC Genome-wide association study of 14 000 cases of seven common diseases and 3000 shared controls. Nature. 2007;447:661–678. doi: 10.1038/nature05911. [DOI] [PMC free article] [PubMed] [Google Scholar]
- Cavalli-Sforza LL. The Basque population and ancient migrations in Europe. Munibe. 1988;6 Suplemento núm:129–137. [Google Scholar]
- Cavalli-Sforza LL, Menozzi P, Piazza A. History and Geography of Human Genes. Princeton, NJ: Princeton University Press; 1994. [Google Scholar]
- Bauduer F, Feingold J, Lacombe D. The Basques: review of population genetics and Mendelian disorders. Hum Biol. 2005;77:619–637. doi: 10.1353/hub.2006.0001. [DOI] [PubMed] [Google Scholar]
- Calafell F, Bertranpetit J. Mountains and genes: population history of the Pyrenees. Hum Biol. 1994;66:823–842. [PubMed] [Google Scholar]
- Calafell F, Bertranpetit J. A simulation of the genetic history of the Iberian Peninsula. Curr Anthropol. 1993;34:735–745. [Google Scholar]
Associated Data
This section collects any data citations, data availability statements, or supplementary materials included in this article.


