Abstract
Ordinary electrophilic reagents react too slowly in a nonpolar environment to be useful for the determination of the accessibility to lipid of continuous stretches of residues mutated to cysteine. By contrast, photoactivated 5-iodonaphthyl-1-azide (INA) reacted readily with 2-mercaptoethanol and dodecanethiol in nonpolar solvents and in liposomes. Continuous stretches of residues in the amphipathic N-terminal helix and first transmembrane helix of the bacterial potassium channel KcsA were replaced with cysteine, and the mutants were expressed in Escherichia coli and isolated in inner membranes. These membranes were dissolved in detergent and reconstituted into asolectin liposomes incorporating INA. The extent of light-induced reaction of INA with each cysteine was assayed by subsequent reaction with the gel-shifting, SH-specific methoxy-polyethylene glycol-2-pyridine disulfide. The pattern of apparent second-order rate constants for the photoreactions of eight substituted cysteines in the N-terminal helix conformed to other measures of lipid exposure. The pattern of the rate constants for the photoreactions of 15 cysteines in the first transmembrane helix had peaks every third residue, which partly conformed to other measures of lipid exposure.
Characterization of membrane protein residues as water-facing, lipid-facing, or buried and the pattern of exposure to water or lipid can provide insights into protein structure and functional mechanisms. One approach to the systematic determination of the exposure of membrane-embedded residues involves the mutation of continuous stretches of residues one at a time to cysteine (Cys) (1–4). Exposure of each substituted Cys can in principle be inferred either from the environmentally sensitive properties of specifically attached spectroscopic probes or from the susceptibility of the Cys to SH-specific reagents.
In an example of the former approach, mutant protein is expressed, purified, spin-labeled in detergent, and reconstituted in liposomes, in which the spin mobility and the accessibility to hydrophilic and hydrophobic quenchers of electron spin resonance are monitored (2). This approach requires plentiful and robust proteins.
In the latter approach, substituted Cys facing water-filled channels, transport pathways, and binding sites have been identified by their reactivity toward hydrophilic, SH-specific reagents and their ability to be protected by specific ligands (3, 4). In some cases, the reactions have been monitored with high sensitivity by their effects on the function of the target protein (3). This functional approach depends on the generally benign effect of Cys substitution on function and, hence, structure (1, 5). To identify water-exposed Cys, the reactions of which do not affect function, however, requires a chemical assay of the reaction. Such assays have involved radioactive reagents or mass-altering reagents and the purification and/or specific detection of the target protein after electrophoresis or MS (1, 4, 6–8).
In contrast to water-facing residues, the systematic identification of lipid-facing residues by reaction of substituted Cys with hydrophobic reagents has not been fruitful. Electrophilic reagents that react more rapidly with thiols than with other nucleophiles in water at neutral pH react very slowly with thiols in nonpolar environments (9–11). [Mercuric chloride may be a useful exception (12).] Photoactivated reagents can be more reactive than ordinary electrophilic reagents toward nucleophilic groups and can even insert into C–H bonds. Native lipid-facing residues have been identified by mapping the sites of reaction of radioactive, hydrophobic photolabels (13–15); photolabeling and mapping, however, does not permit the systematic characterization of every residue in a segment.
The lipophile 5-iodonaphthyl-1-azide (INA) was developed as a photolabel for lipid-embedded domains of membrane proteins (16–21). It strongly absorbs light at ≈310 nm, generating a highly reactive nitrene. Although INA was used to identify membrane-embedded segments of proteins, it was not ideally nonselective for all lipid-exposed side chains. For example, it was found to react with only one residue, a Cys, in the membrane-embedded b subunit of ATP synthase (22). This preference for Cys could be a consequence of the electrophilicity of the nitrene itself (23) or of an intramolecular rearrangement product of the nitrene (24).
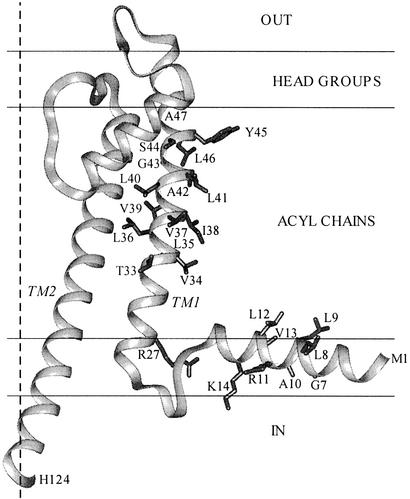
We tested whether INA could be used to determine the lipid exposure of Cys substituted for residues in the first transmembrane segment (TM1) and in the amphipathic N-terminal helix of the bacterial (Streptomyces lividans) K+ channel (KcsA; Fig. 1). The lipid exposure of the native residues in TM1 can be inferred from the high-resolution structure of KcsA crystallized in detergent (25, 26), and the lipid exposure of spin-labeled Cys substituted in both TM1 and the N-terminal helix has been determined in KcsA reconstituted in liposomes (27). We incorporated KcsA and INA into liposomes and determined the rate of photoreaction of the substituted Cys. Photoactivated INA reacts effectively with Cys in the membrane domain, and the pattern of Cys reactivity is largely consistent with the previous structural determinations.
Figure 1.
Structure of the KcsA monomer and its location in the phospholipid bilayer. The coordinates of residues 22–124 were from the crystal structure 1K4C (26). Residues 1–17 were configured in INSIGHT II as an ideal α-helix, which was joined to residues 22–124 by residues 18–21 in a loop. We generated a loop using the loop module in the modeler program and the modeler objective function (28). We manipulated the locations of the core residues 22–124 and the N-terminal helix relative to the 30-Å-wide acyl-chain domain and the 7.5-Å-wide head-group domains so as to place the R27 guanidinium in the head-group domain and the lipid-facing residues of the N-terminal helix (11, 27) in contact with the acyl chains. In addition to R27, the side chains of the residues probed in this article are shown. The fourfold axis of the tetramer, which is also the axis of the channel, is shown as a broken line.
Materials and Methods
Dodecyl maltoside (DM) was from Anatrace (Maumee, OH), t-dodecanethiol (mixed isomers) was from Aldrich, methoxy-polyethylene glycol-2-pyridine disulfide (PegSSP) Mr 3,000 was from Shearwater Polymers (Huntsville, AL), asolectin (soybean phospholipids) was from Sigma, Ni(II)-nitrilotriacetate-agarose (NiNTA-agarose) was from Qiagen (Valencia, CA), and SYPRO orange was from Molecular Probes. INA was synthesized by Biotium (Hayward, CA), following synthesis 2 of Bercovici and Gitler (16), and was stored in a desiccated state at −20°C.
The sequence of the 173-residue pseudo-wild-type KcsA construct used here began M−13RGSHHHHHHGIR−1M1PPMLS6GLLAR11LVKLL16LGRHG21SALHW26RAAGA31ATVLL36VIVLL41AGSYL46A …, in which residues −13 to −1 contain a His tag and the native sequence starts at M1. The single-Cys-substitution mutants at positions 7–14 in the N-terminal helix and 33–47 in TM1, a gift from D. M. Cortes and E. Perozo (University of Virginia, Charlottesville), were generated and expressed in Escherichia coli as described (11, 27, 29). Inner membrane was prepared and the KcsA concentration and the total protein concentration were determined as described (11). Total phosphorus and lipid phosphorus extractable with CHCl3/CH3OH (2:1) were assayed following McClare (30).
KcsA Reduction and Reconstitution.
KcsA mutants in E. coli inner membrane were reduced, dissolved in DM, mixed with asolectin liposomes containing INA, reconstituted by dilution (31), and photolyzed, and the extent of reaction of the Cys was analyzed, as in the following protocol: A volume (25–50 μl) of inner membrane suspension containing 25 μg of mutant KcsA, with water added to bring the volume to 148.5 and 16.5 μl of 100 mM DTT/500 mM KCl/500 mM Tris/10 mM EDTA, pH 8.0, was combined to provide a final volume of 165 μl. The suspension was covered with argon and stirred gently for 1 h at room temperature. (Except where noted, this and all subsequent steps were at room temperature.) The reduced membrane was diluted with 495 μl of 150 mM KCl/10 mM CaCl2/10 mM Hepes, pH 7.5 (KCa), and 660 μl of 2.4 mM DM/KCa to a final concentration of 1.2 mM DM and stirred for 60 min. The suspension was transferred to six Beckman Airfuge tubes and centrifuged at ≈160,000 × g (29 psi; 1 psi = 6.9 kPa) for 3 min to remove undissolved material, and the supernatant was collected. Asolectin liposomes (10 mg/ml) with 0, 400, and 800 μM INA, or with the faster-reacting mutants, 0, 200, and 400 μM INA (average concentrations in the suspension) were made as follows: 0.5 ml of 20 mg of asolectin (Sigma type IV-S) per ml of CHCl3 and 0, 50, or 100 μl of 8 mM INA/CHCl3 were mixed in a glass tube and dried under a stream of argon (INA was protected from light). The dried lipid was twice suspended in ≈200 μl of pentane and dried with argon. The lipid was suspended by vortex mixing in 1 ml of KCa and was sonicated under argon in a Racker-type tank sonicator (Laboratory Supplies, Hicksville, NY) for ≈5 min or until clear. Fifty microliters of each concentration of INA in sonicated liposomes was added to a 400-μl aliquot of solubilized inner membrane, and the mixture was stirred for 10 min. The mixture was diluted 22 times (to a level below the critical micelle concentration of DM) with 2 mM tris(2-carboxyethyl)phosphine (TCEP)/KCa, mixed for 5 min, and sedimented in a Beckman 75Ti rotor at 75,000 rpm for 30 min at 4°C. [The TCEP was added to maintain reducing conditions. We assumed that the three negative charges on TCEP would keep it out of the lipid phase, where it could have reacted with the azide (32).] The reconstituted membrane pellet was suspended in a small volume by repeated pipetting, diluted to 10 ml with 2 mM TCEP/KCa, further decreasing the DM concentration, and sedimented as before. Each pellet was suspended in 500 μl of KCa (no TCEP) and equilibrated at 20°C.
Photolysis.
Duplicate 200-μl aliquots of each of the three reconstituted liposome preparations were transferred to a quartz cell, with a 1-mm pathlength and 9-mm width. Ten microliters of 42 mM reduced glutathione (GSH)/KCa was mixed with the 200 μl of liposomes to a final concentration of 2 mM GSH (to quench reactive species in the aqueous phase), argon was layered over the suspension, and the cell was capped. The quartz cell was held in a jacketed cuvette holder salvaged from a Zeiss PMQ spectrophotometer and fitted with a spacer to hold the 1-mm cell. Water at 20°C was circulated through the holder. The light source was an XBO 75-W xenon short-arc lamp in a housing with a focusable quartz lens. The light was passed through a Melles Griot (Irvine, CA) WG305 high-band-pass glass filter (A280 ≈ 1). The beam was focused so that it just covered the entire 210 μl of suspension in the quartz cell. The suspension was exposed to light for 1 min. The liposomes were removed from the quartz cell, mixed with 10 μl of 220 mM 2-mercaptoethanol (2-ME) to a final concentration of 10 mM, and stirred for 10 min to react with any long-lived, reactive photolysis products.
Denaturation of KcsA and Pegylation of Remaining Cys.
The liposomes were sedimented in an Airfuge at 29 psi for 5 min. The liposome pellet was dissolved in 30 μl of 1% SDS/1 mM 2-ME/20 mM Hepes/0.1 mM EDTA (pH 7.0) and transferred to a Microfuge tube (≈25 μl was recovered). The tube was filled with argon, tightly capped, and held at 100°C for 3 min to dissociate KcsA oligomers into monomers. The tube was cooled to room temperature, 5 μl of 20 mM PegSSP/100 mM Tris buffer (pH 8.0) was added, and the mixture was stirred for 45 min. The reaction was stopped by the addition of 2 μl of 50 mM N-ethylmaleimide (NEM).
Isolation and Quantitation of KcsA Products.
After 10 min, 0.5 ml of 1% DM/100 mM NaCl/50 mM NaPi (pH 8.0) was added. (The DM diluted the SDS.) Thirty microliters of NiNTA-agarose gel, which had been washed and suspended 1:1 (vol/vol) in 100 mM NaCl/50 mM NaPi (pH 8.0), was added to bind the His-tagged KcsA, and the suspension was stirred for 60 min. The gel was sedimented, suspended in 1 ml of 0.3% DM/100 mM NaCl/50 mM NaPi (pH 8.0), sedimented, suspended in 1 ml of water, and sedimented. The gel was suspended in 30 μl of 5 mM EDTA/2% SDS/62 mM Tris (pH 6.8)/10% (vol/vol) glycerol [EDTA/Laemmli sample buffer (LSB)], stirred for 15 min, and sedimented. The supernatant was saved. The gel was extracted again with 30 μl of EDTA/LSB, and the supernatant was added to the first. One microliter of 0.05% pyronin Y was added to the combined supernatants, and duplicate 20-μl samples were loaded on a 15-well, 1-mm-thick gel with a 5% acrylamide stacking gel and a 14% acrylamide resolving gel. The running buffer contained 0.05% SDS/25 mM Tris/200 mM glycine (pH 8.3). After electrophoresis, the gel was stained for 60 min with a 1:5,000 dilution of SYPRO orange and washed for 1 min in 7.5% acetic acid, following the instructions of Molecular Probes. The gel was immediately scanned in fluorescence mode in a Storm 840 (Molecular Dynamics). The band densities were quantitated by using imagequant software (Molecular Dynamics).
Surface Area Calculation.
The accessible surface area of the sulfur atom in each TM1 Cys-substitution mutant in the context of the KcsA tetramer was calculated in CHARMM27B4 (33) with a sphere of 2.6-Å radius, which is the average of the approximate half-width and half-thickness of INA. Hydrogens were added to the KcsA structure (1K4C; ref. 26), and the Cys-substituted mutant structures were energy-minimized in charmm. The tetramer was constructed in INSIGHT II with the symmetry information in the Protein Data Bank (PDB) file.
Results and Discussion
Photoreaction of INA with Thiols.
INA in n-heptane was nearly completely photolyzed by a 1-min exposure (Table 1, experiment 1). Under the same conditions, photolysis of a mixture of INA and 2-ME in heptane decreased the SH titer 81% (experiment 2). By contrast, in the absence of INA, the SH titer decreased only slightly during a 1-min exposure to light. Similar results were obtained in decane; however, the rate of photoreaction of INA and 2-ME was slower than in heptane, possibly because of the higher viscosity of decane (experiment 3). INA incorporated into asolectin liposomes, suspended in aqueous buffer, was substantially photolyzed during a 2-min exposure, despite the optical density of the suspension (experiment 4). The SH titer of dodecanethiol incorporated with INA (note higher concentrations than in experiment 4) into the liposomes was substantially decreased during a 2-min exposure (experiment 5). Although azides can be reduced by thiols in the dark, the dark-reaction with DTT was undetectably slow under the conditions of the above reactions (experiment 6). It is clear that photoactivated INA can react with SH in a nonpolar environment.
Table 1.
Photoreaction of INA and thiols
| Exp. | [INA],* μM | [Thiol],* μM | Thiol | Medium | Exposure,† min | INA loss,‡ % | SH loss,§ % |
|---|---|---|---|---|---|---|---|
| 1 | 920 | 0 | n-Heptane | 1 | 86 | ||
| 2 | 97 | ||||||
| 2 | 0 | 318 | 2-ME | n-Heptane | 1 | 7 | |
| 2 | 9 | ||||||
| 700 | 700 | 2-ME | n-Heptane | 1 | 81 | ||
| 2 | 90 | ||||||
| 3 | 0 | 700 | 2-ME | n-Decane | 1 | 6 | |
| 2 | 10 | ||||||
| 700 | 700 | 2-ME | n-Decane | 1 | 55 | ||
| 2 | 83 | ||||||
| 4 | 200 | 0 | Lipo/NP100¶ | 2 | 40 | ||
| 5 | 0 | 480 | C12SH | Lipo/NP100¶ | 2 | 2 | |
| 400 | 480 | C12SH | Lipo/NP100¶ | 2 | 31 | ||
| 800 | 480 | C12SH | Lipo/NP100¶ | 2 | 43 | ||
| 6 | 27 | 1,110 | DTT | DM/KP150 | 0 | 0 |
C12SH, t-dodecanethiol; lipo/NP100, 10 mg of asolectin liposomes/ml of 100 mM NaCl/10 mM NaPi (pH 7.8)/1 mM EDTA/3 mM NaN3; DM/KP150, 1.1 mM DM/150 mM KCl/10 mM NaPi (pH 8.0)/1 mM EDTA.
When the medium is a liposome suspension, the concentration is the average over the total volume of the suspension.
XBO light source was used, as described in Materials and Methods.
The concentration of INA was taken as proportional to A310, a local absorbance maximum. In experiment 6, there was no change in the absorbance spectrum of INA during a 20-min exposure to DTT.
Thiol concentration was determined by vigorously mixing 10-μl aliquots of the reaction mixture with 800 μl of 100 μM 5,5′-dithio-bis(2-nitrobenzoate)/100 mM Tris buffer (pH 8.0) for 1 min and determining A412 of 700 μl of the bottom phase. [SH] = A412/13,600.
C12SH and INA in liposomes: 0.5 ml of 20 mg asolectin/ml CHCl3, 0 or 40 μl of 12 mM C12SH/CHCl3, and 0, 20, 40, or 80 μl of 10 mM INA/CHCl3 was mixed and dried. The dried lipid was suspended in 1 ml of NP100 and passed 13 times through a 100-nm-pore membrane in a LiposoFast extruder (Avestin, Ottawa).
Reconstitution of KcsA in Liposomes.
Our aim was to obtain rate constants for the photoreaction of INA with KcsA-Cys-substitution mutants. The assay for the INA reaction was the loss of KcsA SH available to react with the SH-specific PegSSP. Preliminary studies indicated that INA concentrations in the lipid phase of the order of 50 mM would be needed to obtain 50% reaction of KcsA thiol in 1 min. Also, for consistent reaction conditions, we wanted the protein concentration in the lipid phase to be well below (≤1/6) the concentration of INA. Both aims were accomplished by reconstituting E. coli membranes containing KcsA in asolectin liposomes containing INA.
In E. coli inner membranes, the mutants of KcsA constituted 6–27% (wt/wt) of the total protein. In addition, by phosphate assay, the inner membranes contained 0.6 g of lipid per g of protein (cf. ref. 34). The 200-μl aliquots of reconstituted liposomes subjected to photolysis contained 3 μg (0.2 nmol) of KcsA, 11–50 μg of total protein (0.3–1.2 nmol, assuming a mean Mr of 40,000), 7–30 μg of endogenous lipid, 200 μg of asolectin, and 0, 4, 8, or 16 nmol of INA. The KcsA thiol concentration in the lipid phase was ≈0.7 mM, and, assuming a partition coefficient of ≈1 × 10⁵ (17, 18), the INA concentration in the lipid phase was ≈18, 36, or 72 mM.
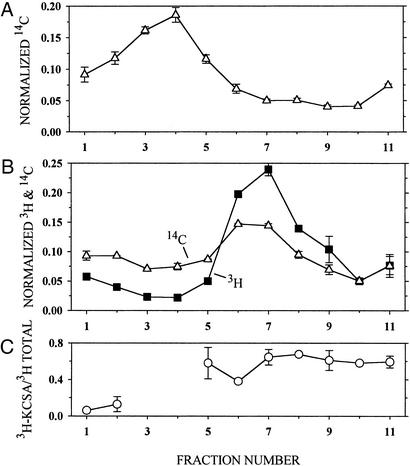
Reconstitution by dilution of DM below its critical micelle concentration incorporated KcsA into liposomes (31) (Fig. 2). Reconstituted liposomes containing either 14C-tagged lipid alone (Fig. 2A) or 14C-tagged lipid plus 3H-tagged inner membrane protein including KcsA (Fig. 2B) were sedimented to equilibrium in a 5–31% (wt/wt) sucrose-density gradient. The lipid and the protein ran together further into the gradient, peaking at ≈19.5% (wt/wt) sucrose, than did the liposomes containing lipid alone, which peaked at ≈14.4% (wt/wt) sucrose. Inner membrane containing the KcsA mutant K14C, with a water-exposed SH, was used for this experiment, and ≈60% of the total 3H-labeled protein in the sucrose-gradient fractions was 3H-KcsA (Fig. 2C). Of the 3H-KcsA recovered, 4.5% was in the bottom fraction, which is an upper limit on the amount of KcsA not reconstituted into liposomes.
Figure 2.
Association of KcsA and phospholipid in reconstituted liposomes. Liposomes consisting of asolectin and 14C-phospholipid, suspended in KCa buffer, were added to DM/KCa buffer (A) or to 3H-labeled KcsA in DM/KCa buffer (B) and reconstituted by dilution. The concentrations of asolectin, protein, and DM and the reconstitution conditions were the same as those given in Materials and Methods. The mixture of asolectin and 14C-phospholipid was made by mixing 150 μl of 20 mg of asolectin per ml of CHCl3 and 300 nCi (1 Ci = 37 GBq) of 14C-dipalmitoyl phosphatidylcholine (25 nCi/μl of toluene/ethanol, 1:1). 3H-labeled KcsA was made by reacting E. coli inner membrane containing 25 μg of KcsA mutant K14C and 162 μg of total protein with 10 mM DTT (pH 8.0) for 60 min. This suspension was sedimented, and the pellet was suspended in 20 mM Hepes (pH 7.0)/1 mM EDTA, sedimented, and suspended again to lower the DTT concentration. The reduced protein was reacted with 4.4 μM 3H-NEM/90 μM NEM for 30 min and sedimented and suspended three times to lower the free 3H-NEM concentration. In duplicate, 200 μl of reconstituted liposomes containing 14C-phospholipid (A) and 200 μl of reconstituted liposomes containing 3H-KcsA and 14C-phospholipid (B) were layered over 4 ml of a linear gradient from 5–31% (wt/wt) sucrose in 10 mM Hepes (pH 7.0), and sedimented in a Beckman SW60 rotor at 60,000 rpm for 13 h at 4°C. The sucrose concentration and linearity of the gradient were determined in parallel tubes with an Abbe refractometer (Zeiss). Ten 400-μl fractions were taken from the top (fraction 1 is topmost), and the volume of the remaining 11th fraction, which was <400 μl, was determined. Forty-microliter aliquots of each fraction were mixed with 5 ml of scintillation fluid and counted with a double-label protocol. The average radioactivity (and average error), normalized by the total recovered radioactivity, is plotted versus the fraction number. (C) The part of the total 3H radioactivity that was associated with KcsA in each fraction in B was determined by diluting the remaining 360 μl of each fraction (less in fraction 11) with 0.5 ml of 1% DM/100 mM NaCl/50 mM NaPi (pH 8.0), stirring with 50 μl of NiNTA-agarose (1:1) for 60 min, washing the gel, and eluting the bound KcsA in two 50-μl aliquots of 5 mM EDTA/LSB (conditions as in Materials and Methods). The combined eluted 3H radioactivity was determined and is plotted versus the sucrose-density-gradient B fraction number normalized by the input to the NiNTA-agarose. There was too little 3H-labeled protein in sucrose-density-gradient fractions 3 and 4 to determine its binding to NiNTA-agarose.
Photoreaction of INA with Cys in KcsA.
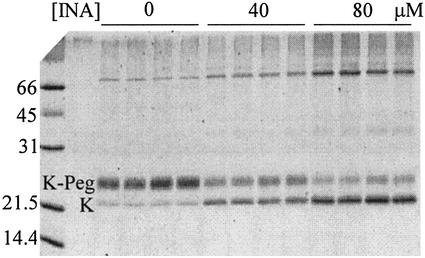
The photoreaction of INA with engineered Cys in KcsA was detected as the blocking of subsequent reaction of the Cys with the mass-altering, SH-specific reagent, PegSSP. KcsA was reduced with DTT initially, photolyzed in the reconstituted membrane, dissolved and denatured in SDS, and reacted with PegSSP under saturating conditions. The Pegylated KcsA had a lower electrophoretic mobility (i.e., higher apparent molecular weight) than non-pegylated KcsA, as illustrated by SDS/PAGE of the reaction products of T33C (Fig. 3). With an increase in the concentration of INA, the portion of KcsA that reacted subsequently with PegSSP decreased, with more of the KcsA running with the mobility of KcsA. (The mobility of KcsA was not detectably changed by reaction with INA, Mr 295.)
Figure 3.
Electrophoresis of KcsA reacted with INA and PegSSP. The reaction and SDS/PAGE conditions are given in Materials and Methods. The final concentrations of INA averaged over the volume of the liposome suspension are at the top of the gel. For each INA concentration, duplicate lanes were run of each of duplicate reaction mixtures. The positions of the KcsA monomer (K) and of the KcsA-PegSSP adduct (K-Peg) are indicated. The molecular masses of protein standards are in kDa.
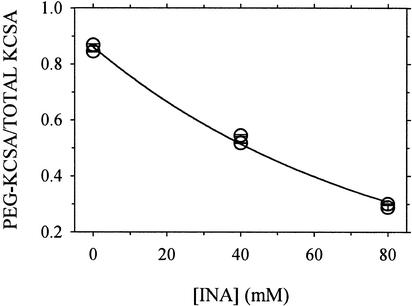
The quantities of KcsA and KcsA-Peg in a sample were taken as proportional to the SYPRO orange fluorescence intensity integrated over the KcsA and KcsA-Peg gel bands. The fraction of SH remaining after the INA reaction was taken as the quantity of KcsA-Peg divided by the sum of the quantities of KcsA-Peg and KcsA. (Thus, each lane yielded a kinetic point, independent of the total amount of protein loaded.) This fraction as a function of the INA concentration was fit by a first-order exponential equation, yielding a decay constant (Fig. 4). This decay constant divided by the time of photolysis (60 s) is analogous to a second-order rate constant. It is not a true rate constant, however, because the identities, concentrations, and lifetimes of the photogenerated reactants during the 1 min of light exposure are not known, and the concentrations of INA used are the averages over the suspension volume, not the concentrations in the lipid phase. Furthermore, the decay constant itself is an approximation, because we tested only three concentrations of INA at a time and assumed that at high enough INA concentration, the reaction with the Cys would go to completion. Nevertheless, because the reaction conditions were nearly the same for all of the Cys mutants, comparisons of such apparent rate constants should reveal the relative reactivities of the various Cys residues. To the extent that these reactivities depend on Cys accessibility to photoactivated INA and that INA is confined to the lipid bilayer, the apparent rate constants should reflect the relative exposure of the Cys to lipid.
Figure 4.
The fraction of T33C that reacted with PegSSP after photoreaction with INA. The data are from the gel shown in Fig. 3. The integrated densities of the KcsA monomer band and of the KcsA-PegSSP adduct band were determined and added, and the fraction (y) of the total in the KscA-PegSSP adduct band was calculated. The means of the duplicate lanes (and average errors) for each of the duplicate reactions are shown. The errors in all cases were smaller than the symbol. A nonlinear least-squares fit to the data of the equation y = ae−b[INA] yielded b, which was divided by the time of photolysis, 60 s, to yield an apparent second-order rate constant, kINA (M−1⋅s−1).
Although the mutants were subjected to reduction with DTT initially and the reaction time and PegSSP concentration were sufficient to react with all available Cys in denatured KcsA, the maximum extent of reaction with PegSSP was not 100%. For the 15 Cys mutants in TM1, the mean extent of reaction of PegSSP after 1 min of light (but no INA) was 75 ± 16% (range 37–97%). For the N-terminal helix, the mean was 28 ± 18% (range 9–42%), and the rate constants for the reaction of INA with the mutants with the smaller extents of initial reaction of PegSSP had larger standard errors. Despite the initial reduction and precautions against oxidation of the Cys SH, there was significant loss of available SH in some N-terminal helix Cys mutants during solubilization and reconstitution. Exposure to light for 1 min in the absence of INA had an insignificant effect (2 ± 6%) on the subsequent KcsA reaction with PegSSP.
N-Terminal Amphipathic Helix.
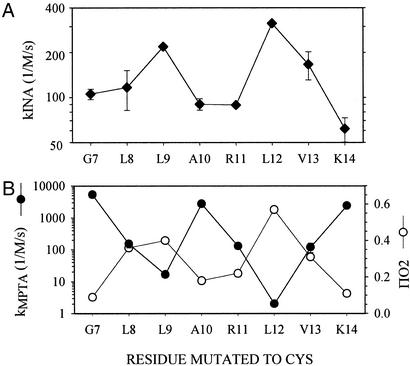
The pattern of reactivities of eight consecutive Cys substituted into the N-terminal helix conforms to the expected exposure of these residues to lipid (Fig. 5A). The pattern is similar to the pattern of quenching by O2 of the spin-labeled Cys mutants, which reflects lipid accessibility (27) (Fig. 5B). The opposite pattern is given by the rate constants of the reaction of the Cys mutants with 4-(N-maleimido)phenyltrimethylammonium, which reflects aqueous accessibility (ref. 11; Fig. 5B).
Figure 5.
Rate constants for the photoreaction of INA with Cys-substitution mutants in the N-terminal amphipathic helix. (A) Apparent second-order rate constants were obtained as described in the legend of Fig. 4. Means and errors (most are within the symbols) in the fits of duplicate reaction mixtures are shown. (B) For comparison, we show the rate constants for the reactions of the hydrophilic 4-maleimidophenyltrimethylammonium (kMPTA) with the Cys mutants (11) and the O2-accessibility parameter (ΠO2) from the quenching by O2 of spin-labeled Cys mutants (27). Note the rate constants are on logarithmic scales and the quenching parameter is on a linear scale.
In preliminary experiments, we found that photoactivated INA reacted with some water-facing Cys just outside of the lipid bilayer nearly as rapidly as with lipid-facing Cys. Other hydrophobic photolabels have been reported to react with residues in the aqueous phase (15, 18, 23, 35). We found that the reactions with predicted water-facing Cys in the amphipathic helix, but not the reactions with predicted lipid-facing Cys, were slowed by GSH in the aqueous phase (cf. ref. 23). All of the results presented here were obtained with 2 mM GSH in the aqueous phase.
Despite the fact that INA reacts with some water-facing Cys close to the bilayer, and lipid-facing Cys at similar rates, INA is a much better probe for lipid-facing Cys than are ordinary hydrophobic electrophilic reagents such as pyrene maleimide, which reacted orders of magnitude faster with water-facing Cys than with lipid-facing Cys (11). With the addition of a suitable polar quencher like GSH, the photoreaction of INA usefully distinguishes Cys facing lipid from Cys facing water.
First Membrane-Spanning Segment.
Fifteen substituted Cys residues in a continuous stretch of TM1 (Fig. 1) were probed with INA. We did not expect GSH in the aqueous phase to have an effect on the reaction with Cys in TM1, and in preliminary experiments the extents of reaction of INA with the TM1 mutants T33C, V37C, I38C, V39C, and L46C were unaffected by GSH. The extent of reaction of A47C, however, which is close to the lipid–water interface, was significantly decreased by GSH. For consistency, GSH was included in the final protocol applied to all of the mutants.
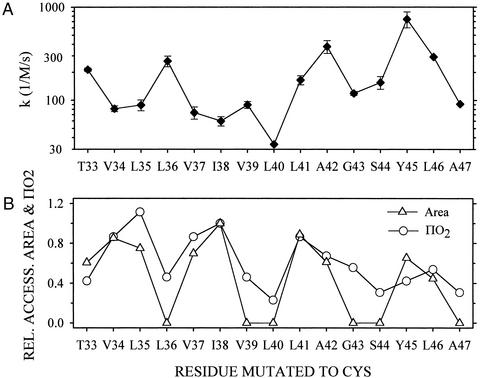
The apparent rate constants for TM1 were spread over a greater range, from 34 to 617 M−1⋅s−1 (Fig. 6A), than were the rate constants for the amphipathic N-terminal helix, which ranged from 62 to 314 M−1⋅s−1 (Fig. 5A). The pattern of the rate constants had peaks every third residue. From L40 to A47 this pattern conformed to the patterns of accessible surface area calculated from the crystal structure (26) and of O2 accessibility (ref. 27; Fig. 6B), but from T33 to V39 the peaks of the rate constants were out of phase with the peaks of accessible area and O2 accessibility.
Figure 6.
Rate constants for the photoreaction of INA with Cys-substitution mutants in TM1. (A) Apparent second-order rate constants were obtained as described in the legend of Fig. 4. Means and errors in the fits of duplicate or quadruplicate reaction mixtures are shown. (B) For comparison, we show ΠO2 (29) and the molecular surface area of the Cys sulfur atom, which is in each case relative to these values for I38C (see Materials and Methods).
Like the lipid-facing Cys in the amphipathic helix, lipid-facing residues in TM1 reacted with photoactivated INA. Because the pattern of the rate constants did not completely coincide with other measures of exposure to lipid, it is uncertain whether the INA photoreaction reliably distinguishes between lipid- and protein-facing Cys. Although it is possible that the structure of TM1 was different in the reconstituted liposomes than in KcsA crystallized from detergent solution (26), the O2-quenching of spin-labeled, Cys-substituted KcsA in similarly reconstituted liposomes (27) gave a pattern more consistent with the crystal structure (Fig. 6B). It is also possible that the relatively high concentration of INA in the bilayer distorted the structure of TM1, which is unconstrained by intersubunit contacts. Further studies with KcsA and other model proteins are needed to address these possibilities. Despite some unanswered questions, the approach described here can be used to distinguish lipid- from water-exposed Cys and potentially from buried Cys as well.
Acknowledgments
We thank Q. Xu for technical assistance, D. M. Cortes and E. Perozo for the KcsA mutants, N. Turro for advice, and H. Bayley, C. Deutsch, J. A. Javitch, H. R. Kaback, and C. Miller for comments on the manuscript. This work was supported by National Institutes of Health Research Grant NS07065.
Abbreviations
- DM
dodecyl maltoside
- GSH
glutathione
- INA
5-iodonaphthyl-1-azide
- KcsA
Streptomyces lividans K+ channel
- 2-ME
2-mercaptoethanol
- NEM
N-ethylmaleimide
- PegSSP
methoxy-polyethylene glycol-2-pyridine disulfide
- TM1
first transmembrane segment
- TCEP
tris(2-carboxyethyl) phosphine
References
- 1.Kaback H R, Sahin-Toth M, Weinglass A B. Nat Rev Mol Cell Biol. 2001;2:610–620. doi: 10.1038/35085077. [DOI] [PubMed] [Google Scholar]
- 2.Hubbell W L, Cafiso D S, Altenbach C. Nat Struct Biol. 2000;7:735–739. doi: 10.1038/78956. [DOI] [PubMed] [Google Scholar]
- 3.Karlin A, Akabas M H. Methods Enzymol. 1998;293:123–145. doi: 10.1016/s0076-6879(98)93011-7. [DOI] [PubMed] [Google Scholar]
- 4.Falke J J, Hazelbauer G L. Trends Biochem Sci. 2001;26:257–265. doi: 10.1016/s0968-0004(00)01770-9. [DOI] [PMC free article] [PubMed] [Google Scholar]
- 5.Zhang H, Karlin A. Biochemistry. 1998;37:7952–7964. doi: 10.1021/bi980143m. [DOI] [PubMed] [Google Scholar]
- 6.Jones P C, Sivaprasadarao A, Wray D, Findlay J B. Mol Membr Biol. 1996;13:53–60. doi: 10.3109/09687689609160575. [DOI] [PubMed] [Google Scholar]
- 7.Lu J, Deutsch C. Biochemistry. 2001;40:13288–13301. doi: 10.1021/bi0107647. [DOI] [PubMed] [Google Scholar]
- 8.Movileanu L, Cheley S, Howorka S, Braha O, Bayley H. J Gen Physiol. 2001;117:239–252. doi: 10.1085/jgp.117.3.239. [DOI] [PMC free article] [PubMed] [Google Scholar]
- 9.Harrison M A, Murray J, Powell B, Kim Y I, Finbow M E, Findlay J B. J Biol Chem. 1999;274:25461–25470. doi: 10.1074/jbc.274.36.25461. [DOI] [PubMed] [Google Scholar]
- 10.Czerski L, Sanders C R. FEBS Lett. 2000;472:225–229. doi: 10.1016/s0014-5793(00)01457-5. [DOI] [PubMed] [Google Scholar]
- 11.Li J, Xu Q, Cortes D M, Perozo E, Laskey A, Karlin A. Proc Natl Acad Sci USA. 2002;99:11605–11610. doi: 10.1073/pnas.192439299. [DOI] [PMC free article] [PubMed] [Google Scholar]
- 12.Soskine M, Steiner-Mordoch S, Schuldiner S. Proc Natl Acad Sci USA. 2002;99:12043–12048. doi: 10.1073/pnas.192392899. [DOI] [PMC free article] [PubMed] [Google Scholar]
- 13.Richards F M, Brunner J. Ann NY Acad Sci. 1980;346:144–164. [Google Scholar]
- 14.Radhakrishnan R, Gupta C M, Erni B, Robson R J, Curatolo W, Majumdar A, Ross A H, Takagaki Y, Khorana H G. Ann NY Acad Sci. 1980;346:165–198. doi: 10.1111/j.1749-6632.1980.tb22099.x. [DOI] [PubMed] [Google Scholar]
- 15.Blanton M P, Dangott L J, Raja S K, Lala A K, Cohen J B. J Biol Chem. 1998;273:8659–8668. doi: 10.1074/jbc.273.15.8659. [DOI] [PubMed] [Google Scholar]
- 16.Bercovici T, Gitler C. Biochemistry. 1978;17:1484–1489. doi: 10.1021/bi00601a020. [DOI] [PubMed] [Google Scholar]
- 17.Gitler C, Bercovici T. Ann NY Acad Sci. 1980;346:199–211. doi: 10.1111/j.1749-6632.1980.tb22100.x. [DOI] [PubMed] [Google Scholar]
- 18.Bayley H, Knowles J R. Biochemistry. 1980;19:3883–3892. doi: 10.1021/bi00558a001. [DOI] [PubMed] [Google Scholar]
- 19.Odermatt E, Snozzi M, Bachofen R. Biochim Biophys Acta. 1980;591:372–380. doi: 10.1016/0005-2728(80)90168-1. [DOI] [PubMed] [Google Scholar]
- 20.Raviv Y, Bercovici T, Gitler C, Salomon Y. Biochemistry. 1989;28:1313–1319. doi: 10.1021/bi00429a055. [DOI] [PubMed] [Google Scholar]
- 21.Pak C C, Puri A, Blumenthal R. Biochemistry. 1997;36:8890–8896. doi: 10.1021/bi9702851. [DOI] [PubMed] [Google Scholar]
- 22.Hoppe J, Friedl P, Jorgensen B B. FEBS Lett. 1983;160:239–242. doi: 10.1016/0014-5793(83)80974-0. [DOI] [PubMed] [Google Scholar]
- 23.Bayley H, Knowles J. Biochemistry. 1978;17:2414–2419. doi: 10.1021/bi00605a025. [DOI] [PubMed] [Google Scholar]
- 24.Nielsen P E, Buchardt O. Photochem Photobiol. 1982;35:317–323. [Google Scholar]
- 25.Doyle D A, Morais-Cabral J, Pfuetzner R A, Kuo A, Gulbis J M, Cohen S L, Chait B T, MacKinnon R. Science. 1998;280:69–77. doi: 10.1126/science.280.5360.69. [DOI] [PubMed] [Google Scholar]
- 26.Zhou Y, Morais-Cabral J H, Kaufman A, MacKinnon R. Nature. 2001;414:43–48. doi: 10.1038/35102009. [DOI] [PubMed] [Google Scholar]
- 27.Cortes D M, Cuello L G, Perozo E. J Gen Physiol. 2001;117:165–180. doi: 10.1085/jgp.117.2.165. [DOI] [PMC free article] [PubMed] [Google Scholar]
- 28.Fiser A, Do R K, Sali A. Protein Sci. 2000;9:1753–1773. doi: 10.1110/ps.9.9.1753. [DOI] [PMC free article] [PubMed] [Google Scholar]
- 29.Perozo E, Cortes D M, Cuello L G. Nat Struct Biol. 1998;5:459–469. doi: 10.1038/nsb0698-459. [DOI] [PubMed] [Google Scholar]
- 30.McClare C W. Anal Biochem. 1971;39:527–530. doi: 10.1016/0003-2697(71)90443-x. [DOI] [PubMed] [Google Scholar]
- 31.Cortes D M, Perozo E. Biochemistry. 1997;36:10343–10352. doi: 10.1021/bi971018y. [DOI] [PubMed] [Google Scholar]
- 32.Saxon E, Bertozzi C R. Science. 2000;287:2007–2010. doi: 10.1126/science.287.5460.2007. [DOI] [PubMed] [Google Scholar]
- 33.Brooks B R, Bruccoleri R E, Olafson B D, States D J, Swaminathan S, Karplus M. J Comput Chem. 1983;4:182–217. [Google Scholar]
- 34.Kaback H R. Methods Enzymol. 1971;22:99–120. [Google Scholar]
- 35.Seto-Young D, Monk B C, Perlin D S. Biochim Biophys Acta. 1992;1102:213–219. doi: 10.1016/0005-2728(92)90102-8. [DOI] [PubMed] [Google Scholar]


