Abstract
The population of Norfolk Island, located off the eastern coast of Australia, possesses an unusual and fascinating history. Most present-day islanders are related to a small number of the ‘Bounty' mutineer founders. These founders consisted of Caucasian males and Polynesian females and led to an admixed present-day population. By examining a single large pedigree of 5742 individuals, spanning >200 years, we analyzed the influence of admixture and founder effect on various cardiovascular disease (CVD)-related traits. On account of the relative isolation of the population, on average one-third of the genomes of present-day islanders (single large pedigree individuals) is derived from 17 initial founders. The proportion of Polynesian ancestry in the present-day individuals was found to significantly influence total triglycerides, body mass index, systolic blood pressure and diastolic blood pressure. For various cholesterol traits, the influence of ancestry was less marked but overall the direction of effect for all CVD-related traits was consistent with Polynesian ancestry conferring greater CVD risk. Marker-derived homozygosity was computed and agreed with measures of inbreeding derived from pedigree information. Founder effect (inbreeding and marker-derived homozygosity) significantly influenced height. In conclusion, both founder effect and extreme admixture have substantially influenced the genetic architecture of a variety of CVD-related traits in this population.
Keywords: isolated population, extended pedigree, cardiovascular disease, inbreeding
Introduction
Many population isolates have been used to help dissect the basis of complex traits. Isolates have one or more of the following properties: a small number of initial founding individuals,1, 2 long isolation with limited immigration/inter-marriage,3, 4, 5 unusually high levels of inbreeding,6, 7 extensive sampling of the target population1, 2 and/or relatively homogeneous environment.8 Isolated populations have proven particularly valuable for the purposes of mapping genes involved in rare Mendelian monogenic disorders.9 Speculation surrounding the potential advantages of using isolated populations in the study of complex multifactorial diseases has led to the collection of many contrasting population isolates. Several studies have shown differences between populations both compared with outbred cohorts and within the isolates themselves.4, 10, 11, 12, 13 Another approach in gene-mapping studies is admixture mapping. A number of studies have focused on admixed populations, in which individuals with differing ancestries marry.14, 15 Perhaps unsurprisingly, there have been few studies to date focusing on populations with both admixture and a history of isolation.
Cardiovascular disease (CVD) and related phenotypes, such as blood pressure and obesity, are known to be influenced by both genetic and environmental factors. Gene-mapping studies have identified some loci underlying the heritable component of these phenotypes,16, 17 but the majority of the genetic component of these traits remains to be discovered.
This study involved the participation of an isolated population from Norfolk Island, located off the eastern coast of Australia. Norfolk Island is a small volcanic island 1600-km east, northeast of Sydney, Australia. The initial founders of Norfolk were relocated from Pitcairn Island and possess a fascinating history – their population was started in 1790 on Pitcairn by the original ‘Bounty' mutineers (Isle of Mann and British ancestry) and Tahitian women (Polynesian ancestry). Fletcher Christian, the Bounty's acting Lieutenant, led the mutiny that resulted in a small number of Caucasian men and Tahitian women leaving descendants on the island (a small number of Tahitian men also traveled to the island but left no descendants). The island community remained isolated from immigration until 1856. In 1856, limited by Pitcairn's meager resources, most of the islanders relocated to uninhabited Norfolk Island. Present-day Norfolk islanders have maintained a detailed family genealogy, with family histories traceable back to original founders.18 The combination of a small number of original founders with diverse ancestries, together with an extremely strict immigration policy and Norfolk's obvious geographical isolation presents quite a unique population for the investigation of complex multifactorial diseases. Consistent with their isolated history, we recently showed that a set of individuals drawn from Norfolk Island show long stretches of linkage disequilibrium.19 Further background information on the Norfolk Island data20 and on Polynesian settlement more generally21 was published earlier.
Materials and methods
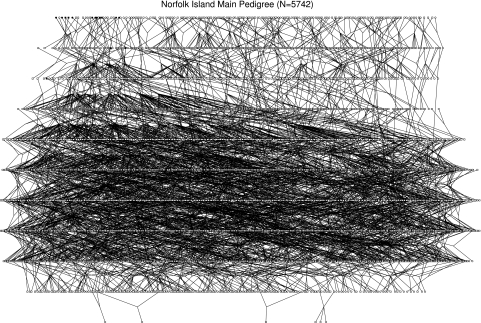
The main focus in this study was on the legacy of a small number of ‘original founders', and the set of individuals used differs slightly from that used by Bellis et al.22 There were 9 male founders (Bounty mutineers of Caucasian ancestry) and 12 female founders (Polynesian ancestry). This set of individuals was supplemented by two further Caucasian males in the mid-nineteenth century. In total, 11 male founders and 6 female founders contribute genes to present-day individuals – this set of ‘original founder' individuals appear as filled symbols in the pedigree of 5742 connected individuals in Figure 1. Of the 5742 individuals, 337 had phenotype–genotype information available. Of the 337, 295 were non-founders in the pedigree, with the remainder being married-in individuals.
Figure 1.
Full pedigree.
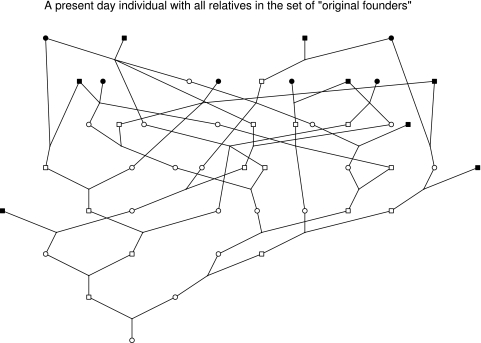
A present-day phenotyped individual is known to have all ancestors in the set of ‘original founders' (Figure 2). On Figure 2, the lineages can be followed to the initial founders, with the phenotyped individual being related to all six Polynesian ‘original founders'. There are ∼6 generations from most ‘original founders' to the individual in Figure 2 and as most of the phenotyped individuals are younger than this there are generally 6–7 generations between ‘original founders' and phenotyped individuals. If there were a single lineage from founder to present day, phenotyped individuals would be expected to share roughly 0.008–0.015 (1/128 to 1/64) of their genome with any given ‘original founder'.
Figure 2.
One present-day individual.
In addition to the phenotyped individuals from the main pedigree, a further 256 phenotyped/genotyped individuals were available for study. In total, 593 individuals had phenotypes or genotypes available (in virtually all cases both).
Nine quantitative traits were considered (Table 1). Full details for the collection of these data were given earlier.20 Informed consent was obtained from all participants. Before collection of samples, the Griffith University Human Research Ethics Committee granted ethical clearance. A panel of 382 microsatellite markers were typed across all individuals with blood available – full details are in Bellis et al.22 Marker information was used to validate the specified pedigree relationships and to assess whether ‘unrelateds' could be connected to the main pedigree using the program GRR.23 A number of ‘unrelateds' were joined to the initially specified main pedigree, with several mis-specified relationships within the pedigree corrected in the light of the marker data. The marker data suggested that some of the ‘unrelateds' were distantly related to the main pedigree but was not sufficient to explicitly join such individuals to the pedigree.
Table 1. Effect of ancestry on CVD-related traits.
| Trait | h2 (SE) | Effect of Polynesian ancestry | P-value for Polynesian ancestry |
|---|---|---|---|
| Cholesterol | 0.40 (0.12) | 1.04 | 0.08896 |
| Triglycerides | 0.14 (0.16) | 1.55 | 0.00424 |
| HDL | 0.22 (0.16) | −0.74 | 0.18456 |
| LDL | 0.41 (0.11) | 0.70 | 0.26285 |
| Height | 0.76 (0.10) | −0.37 | 0.53888 |
| Weight | 0.30 (0.13) | 0.80 | 0.14003 |
| BMI | 0.17 (0.13) | 1.15 | 0.03498 |
| SBP | 0.24 (0.12) | 1.75 | 0.00061 |
| DBP | 0.06 (0.12) | 1.15 | 0.01521 |
h2 is the heritability of each trait. SE denotes the standard error. N=593. The scale for effect size is for each trait transformed to N(0,1), with Polynesian ancestry as a proportion between 0 and 1. For example, an individual with 0.3 Polynesian ancestry would on average have ∼0.11 SD lower height than an individual with no Polynesian ancestry. Having all traits on the same scale allows all traits to be easily compared in terms of effect sizes.
Ancestry was assessed by calculating the expected contribution of each set of parents to their offspring. For example, an individual with a 100% Polynesian mother and 100% Caucasian father would have 50% Polynesian and 50% Caucasian ancestry. For the early part of the islanders' history, all individuals' ancestry was derived from the ‘original founders'. The vast majority of individuals who came to the island in more recent years were Caucasian and all of the recent founder individuals outside the set of ‘original founders' are assumed here to have Caucasian ancestry. Ancestry values for the main pedigree were computed using PEDIG.24 Inbreeding coefficients (F) based on the pedigree information were computed in PEDIG using the method of Meuwissen and Luo.25 F is the probability that the two alleles at a locus in an individual are identical by descent.
Genome-wide homozygosity (GWH) was calculated by computing the proportion of autosomal markers that were homozygous. Inbreeding will increase homozygosity, with inbred individuals showing increased homozygosity as a result of their inheriting the same alleles, identical by descent, down both sides of an inbreeding loop. The expected amount of homozygosity in an inbred individual is
 |
where H0 is the homozygosity in the outbred population. This predicts that a graph of homozygosity versus F will have gradient 1−H0.
The relationship between each trait and ancestry, marker homozygosity and F was assessed using a mixed-model approach in SOLAR26 – this models the relationship between each individual in the pedigree by fitting a variance component for the additive genetic effect transmitted to each offspring. This allows estimation of the additive genetic variance and hence the heritability of each trait. For each of ancestry, marker homozygosity and F in turn, a fixed effect was fitted to test for an effect of each on the traits of interest. In addition, fitted in each case was fixed effects for age, sex, age2 and an age by sex interaction. Strictly speaking, the estimates of the variance components from the maximum likelihood approach implemented in SOLAR are biased but in practice the bias is small – this was confirmed by running a subset of the data through the program ASREML,27 which implements restricted maximum likelihood (data not shown).
Results
Of the 5742 individuals in the main pedigree, 1503 were inbred. The average F of the inbred individuals was 0.044, with a maximum of 0.16 (0.16 indicates slightly more inbreeding than would result from an avuncular marriage). Of the 337 individuals with phenotypes/genotypes, 60 are inbred – the average inbreeding in these individuals was 0.026, with a maximum of 0.081.
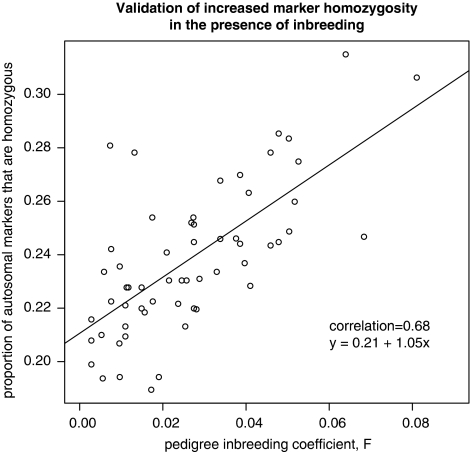
Figure 3 shows the relationship between marker-derived homozygosity and F for the 60 inbred individuals. The gradient is 1.05 (SE 0.15); this is not significantly different from the prediction of 1–0.21=0.79. For individuals who are (based on the available pedigree information) not inbred (F=0), there is some variability in their marker-derived homozygosity but the mean value in the non-inbred individuals is 0.21 – this is the same as the intercept derived from the inbred individuals. A small number of individuals from outside the main pedigree had marker homozygosity values much higher than expected if they were not inbred – it is likely that some of these individuals are in fact related to the main pedigree but the available marker data were not sufficient to allow these individuals to be explicitly connected to the main pedigree (using the program GRR).
Figure 3.
Marker-derived homozygosity and inbreeding coefficient.
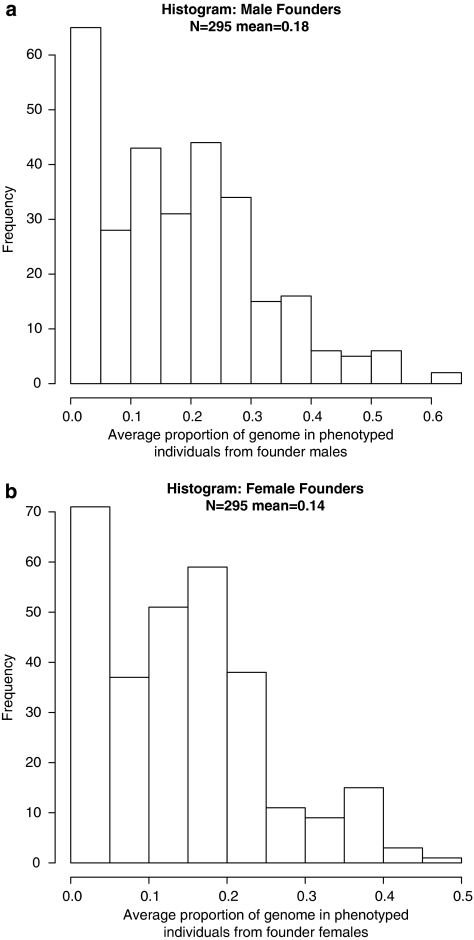
The average proportion of the genome from initial founders obviously decreases over time (as more new founders are ‘married-in'), but the contribution of the initial founders remains reasonably high. There are 295 non-founder individuals in the main pedigree with phenotypes. On average, these individuals carry 18% of their genome from the male original founders and 14% of their genome from the female initial founders – histograms are in Figure 4. The present-day individual from Figure 2 is on the right-hand side of the histograms – she is expected to have inherited 61% of her genome from founder males and 39% from founder females and has F=0.029. The female-specific histogram in Figure 2 can also be interpreted as showing the degree of Polynesian/Caucasian admixture in the Norfolk Island population (assuming that all new founders were Caucasian). Considering each initial founder separately, some of the original founders contribute much more to present-day phenotyped individuals than others (range: 0.2–3.1%).
Figure 4.
Contribution of ‘original' founders: (a) males, (b) females.
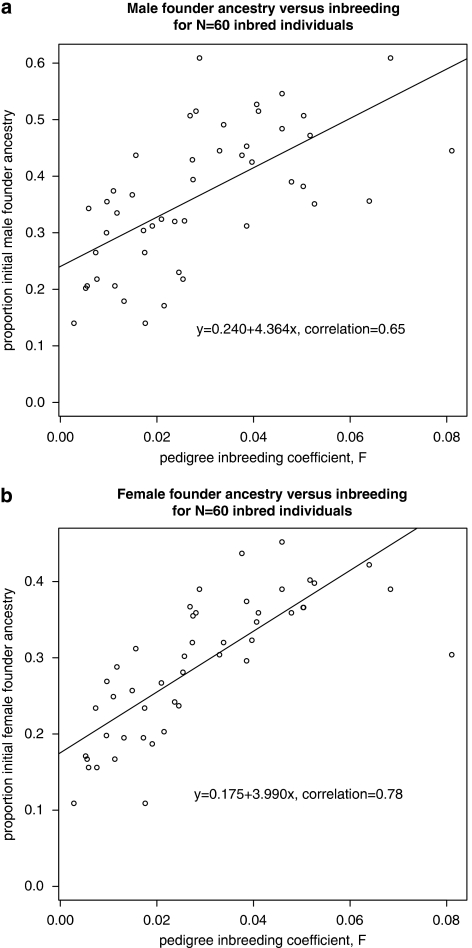
There is a strong relationship between inbreeding and ancestry – individuals with ancestors who intermarried with others from small group of founders will be inbred and also carry a large proportion of the original founder individuals' DNA. The correlation between F and Polynesian ancestry was 0.78. Graphs showing the relationship between proportion of genome from initial founders (ie, ancestry) and inbreeding coefficient are in Figure 5. The correlation between marker-derived homozygosity and Polynesian ancestry was much lower (0.19).
Figure 5.
Relationship between ancestry and inbreeding: (a) males, (b) females.
Heritabilities (h2) for each trait were estimated using the mixed model (Table 1). The mixed model was also used to estimate the effect of Polynesian ancestry, taking into account the known relationships between individuals. Polynesian founder ancestry significantly increased total triglycerides, body mass index (BMI), systolic blood pressure (SBP) and diastolic blood pressure (DBP) for individuals with more Polynesian ancestry (Table 1). There was also an indication that Polynesian ancestry increased total cholesterol. Although the effects of ancestry on the other traits were non-significant, the effect direction was always consistent with Polynesian ancestry leading toward less favorable outcomes with respect to CVD risk (increases in all traits with the exception of HDL and height). It seems likely that having greater Polynesian ancestry generally increased individuals susceptibility to traits associated with CVD when those individuals were ‘exposed' to a Western diet.
Table 2 shows the effect of GWH and inbreeding (F) on each trait. For GWH, N=593; for F, N is only 60 because only individuals from the main pedigree can be assessed for their F-value, and only a subset of individuals in the main pedigree are inbred. The only trait significantly affected by marker-derived homozygosity was height and this result was also confirmed in the small set of inbred individuals. Total cholesterol and SBP were significantly related to F, although interpretation of this is made difficult by the strong correlation between F and ancestry. The individuals who have high levels of Polynesian ancestry tend to maintain that high level as a result of their being inbred descendants of the small number of Polynesian founders. Owing to the strong correlation between F and ancestry in the pedigreed individuals in the main pedigree, it is difficult to fully disentangle their effects. Fiting both F in the model after ancestry resulted in F becoming non-significant (and vice versa). For GWH and ancestry, the correlation was substantially lower (0.19).
Table 2. Effect of homozygosity and inbreeding on CVD-related traits.
| Trait | GWH effect size | P-value for GWH | F effect size | P-value for F |
|---|---|---|---|---|
| cholesterol | 0.66 | 0.66048 | 17.17 | 0.01898 |
| Triglycerides | 1.28 | 0.41355 | 15.27 | 0.05299 |
| HDL | −0.21 | 0.89381 | −1.87 | 0.78042 |
| LDL | 0.60 | 0.69520 | 9.29 | 0.22282 |
| Height | −2.72 | 0.01782 | −13.33 | 0.02610 |
| Weight | −2.18 | 0.12699 | 3.37 | 0.67334 |
| BMI | −1.32 | 0.40732 | 11.22 | 0.19824 |
| SBP | 0.35 | 0.80152 | 16.38 | 0.00812 |
| DBP | 1.31 | 0.40785 | 3.02 | 0.69493 |
Genome-wide homozygosity (GWH) takes the range of values as shown in Figure 3, with most values in the range 0.2–0.3. F takes values between 0 and 0.081 for these individuals. N=593 for GWH and N=60 for F.
The mixed-model results shown are for the main pedigree together with the additional individuals (N=593). The results were similar if the analysis was restricted to just the N=295 non-founder individuals in the main pedigree.
We attempted to fit dominance components of variance in the mixed model but with little success. For some of the traits, including a dominance component in the model led to convergence problems. For other traits, estimates of the dominance variance were estimated but (1) our confidence that these results were correct and were not convergence artefacts was low and (2) the estimated SE of the dominance components were very large. Such problems were not entirely surprising because our pedigree has somewhat limited information to estimate dominance variance because dominance variance can only be estimated from a limited number of (phenotyped) relative pairs such as full sibs. Convergence problems are common when there is only limited information to estimate a parameter in the mixed model.
Discussion
The population of Norfolk Island possesses an unusual and fascinating history. The data presented here offer a unique opportunity to study the effects of both ancestry and founder effect on CVD-related traits. To allow analysis of ancestry, an accurate pedigree structure defining the ‘original founders' of interest is vital. For the Norfolk Island population, we took advantage of well-documented historical records and also confirmed the pedigree structure using marker data – individuals with high pedigree-derived inbreeding (F) values also had higher levels of GWH. Admixed ancestry remains a major factor in the genetic composition of this population because immigration to the island in recent years has been strictly regulated. The vast majority of recent immigrants are thought to be Caucasian – to allow analysis here, we assumed all married-in individuals were Caucasian.
Owing to the population history of the islanders, there was a strong correlation between male founder ancestry and female founder ancestry. Here, as the female founder ancestry is in the minority (with all new immigration resulting from Caucasians coming to the island), it was assumed that an admixture of these Polynesians into an otherwise Caucasian sample was the ‘event' of primary interest. It is possible to interpret the results as genes from English seaman being different (increasing cholesterol, triglycerides, SBP and DBP) from Caucasians more generally, with Polynesian similar to general Caucasians.
Our focus was on the ‘genome-wide' effect of ancestry on each trait of interest. This approach was taken because the power to detect ancestry effects was high and indeed an effect of ancestry was shown for a number of the traits. A possible next step would be to use the marker data to further identify specific chromosomal regions (admixture mapping) underlying the observed effect of ancestry. However, the limited sample size available here would mean that power to detect any particular chromosomal region would be low, and hence we did not attempt this.
Earlier studies of founder populations have considered CVD risk-related phenotypes. Abney et al28 and Ober et al,8 examine a Hutterite data set and report substantial dominance components of variance for the traits SBP and LDL, but no dominance variance for triglycerides, HDL, height, BMI and DBP. Campbell et al29 examine the effect of inbreeding on these traits in another founder population from the Dalmatian Islands in Croatia. Campbell et al29 find that inbreeding affects the traits (SBP and LDL) that were found to have positive dominance components of variance but not the other traits. Here, we find a slight effect of pedigree-derived inbreeding (inbreeding coefficient, F) on SBP but this seems to be more readily explicable as an effect of Polynesian ancestry than inbreeding. There was no effect of marker-derived homozygosity (a proxy for inbreeding) on SBP in the larger set of 593 individuals with available data. We found no effect of inbreeding on LDL in the Norfolk population. Dominance effects have not been reported for any of these traits in large twin studies,30, 31, 32 although this is not necessarily unexpected as twin samples are typically drawn from the general population – the genetic composition of these traits is likely to differ in isolated populations compared with general population samples.
The main finding apropos of homozygosity/inbreeding was that height seemed to be slightly decreased in inbred individuals – there was no significant effect of Polynesian ancestry on height. A number of traits seemed to be influenced by the admixture of Polynesian and Caucasian genetic backgrounds, with Polynesian ancestry significantly increasing trait values for total triglycerides, BMI, SBP and DBP. For the other traits, the effect of ancestry was not significant but in all cases, the direction of effect was consistent with Polynesian ancestry increasing CVD risk. Although inbreeding cannot be ruled out as causing these increases, the lack of association with marker-derived homozygosity suggests that ancestry is the main factor here.
Acknowledgments
This work was supported by grants from the Australian National Health and Medical Research Council (Medical Genomics Program Grant) and the Griffith Medical Research College (a joint program of Griffith University and the Queensland Institute of Medical Research, QIMR, Herston, QLD, Australia, 4006). SM and PMV are supported by the NHMRC fellowship scheme. We thank Norfolk Island volunteers for their participation in this study.
References
- Shmulewitz D, Auerbach SB, Lehner T, et al. Epidemiology and factor analysis of obesity, type ii diabetes, hypertension, and dyslipidemia (syndrome x) on the island of kosrae, federated states of micronesia. Hum Hered. 2000;51:8–19. doi: 10.1159/000022953. [DOI] [PubMed] [Google Scholar]
- Wijsman EM, Rosenthal EA, Hall D, et al. Genome-wide scan in a large complex pedigree with predominantly male schizophrenics from the island of kosrae: evidence for linkage to chromosome 2q. Mol Psychiatry. 2003;8:695–705. doi: 10.1038/sj.mp.4001356. [DOI] [PubMed] [Google Scholar]
- Gudbjartsson DF, Walters GB, Thorleifsson G, et al. Many sequence variants affecting diversity of adult human height. Nat Genet. 2008;40:609–615. doi: 10.1038/ng.122. [DOI] [PubMed] [Google Scholar]
- Angius A, Petretto E, Maestrale GB, et al. A new essential hypertension susceptibility locus on chromosome 2p24–p25, detected by genomewide search. Am J Hum Genet. 2002;71:893–905. doi: 10.1086/342929. [DOI] [PMC free article] [PubMed] [Google Scholar]
- McArdle PF, Dytch H, O'Connell JR, Shuldiner AR, Mitchell BD, Abney M. Homozygosity by descent mapping of blood pressure in the old order amish: evidence for sex specific genetic architecture. BMC Genet. 2007;8:66. doi: 10.1186/1471-2156-8-66. [DOI] [PMC free article] [PubMed] [Google Scholar]
- Ayub M, Irfan M, Maclean A, et al. Linkage analysis in a large family from Pakistan with depression and a high incidence of consanguineous marriages. Hum Hered. 2008;66:190–198. doi: 10.1159/000135265. [DOI] [PubMed] [Google Scholar]
- Ayub M, Irfan M, Malik M, et al. Characteristics of recurrent major depression in a large pedigree from a rural community in Pakistan. Am J Med Genet B Neuropsychiatr Genet. 2005;138B:104–105. [Google Scholar]
- Ober C, Abney M, McPeek MS. The genetic dissection of complex traits in a founder population. Am J Hum Genet. 2001;69:1068–1079. doi: 10.1086/324025. [DOI] [PMC free article] [PubMed] [Google Scholar]
- Peltonen L, Jalanko A, Varilo T. Molecular genetics of the finnish disease heritage. Hum Mol Genet. 1999;8:1913–1923. doi: 10.1093/hmg/8.10.1913. [DOI] [PubMed] [Google Scholar]
- Eaves IA, Merriman TR, Barber RA, et al. The genetically isolated populations of Finland and Sardinia may not be a panacea for linkage disequilibrium mapping of common disease genes. Nat Genet. 2000;25:320–323. doi: 10.1038/77091. [DOI] [PubMed] [Google Scholar]
- Dunning AM, Durocher F, Healey CS, et al. The extent of linkage disequilibrium in four populations with distinct demographic histories. Am J Hum Genet. 2000;67:1544–1554. doi: 10.1086/316906. [DOI] [PMC free article] [PubMed] [Google Scholar]
- Heutink P, Oostra BA. Gene finding in genetically isolated populations. Hum Mol Genet. 2002;11:2507–2515. doi: 10.1093/hmg/11.20.2507. [DOI] [PubMed] [Google Scholar]
- Wright AF, Carothers AD, Pirastu M. Population choice in mapping genes for complex diseases. Nat Genet. 1999;23:397–404. doi: 10.1038/70501. [DOI] [PubMed] [Google Scholar]
- Freedman ML, Haiman CA, Patterson N, et al. Admixture mapping identifies 8q24 as a prostate cancer risk locus in African-American men. Proc Natl Acad Sci USA. 2006;103:14068–14073. doi: 10.1073/pnas.0605832103. [DOI] [PMC free article] [PubMed] [Google Scholar]
- Deo RC, Patterson N, Tandon A, et al. A high-density admixture scan in 1670 African Americans with hypertension. PLoS Genet. 2007;3:2200–2207. doi: 10.1371/journal.pgen.0030196. [DOI] [PMC free article] [PubMed] [Google Scholar]
- Frayling TM, Timpson NJ, Weedon MN, et al. A common variant in the FTO gene is associated with body mass index and predisposes to childhood and adult obesity. Science. 2007;316:889–894. doi: 10.1126/science.1141634. [DOI] [PMC free article] [PubMed] [Google Scholar]
- Kathiresan S, Melander O, Guiducci C, et al. Six new loci associated with blood low-density lipoprotein cholesterol, high-density lipoprotein cholesterol or triglycerides in humans. Nat Genet. 2008;40:189–197. doi: 10.1038/ng.75. [DOI] [PMC free article] [PubMed] [Google Scholar]
- Edgecombe J. Norfolk Island – South Pacfic: Island of History and Many Delights. Thornleigh, Australia: JM Edgecombe; 1999. [Google Scholar]
- Bellis C, Cox HC, Ovcaric M, et al. Linkage disequilibrium analysis in the genetically isolated Norfolk Island population. Heredity. 2008;100:366–373. doi: 10.1038/sj.hdy.6801083. [DOI] [PubMed] [Google Scholar]
- Bellis C, Hughes RM, Begley KN, et al. Phenotypical characterisation of the isolated Norfolk Island population focusing on epidemiological indicators of cardiovascular disease. Hum Hered. 2005;60:211–219. doi: 10.1159/000090545. [DOI] [PubMed] [Google Scholar]
- Whyte AL, Marshall SJ, Chambers GK. Human evolution in polynesia. Hum Biol. 2005;77:157–177. doi: 10.1353/hub.2005.0045. [DOI] [PubMed] [Google Scholar]
- Bellis C, Cox HC, Dyer TD, et al. Linkage mapping of CVD risk traits in the isolated Norfolk Island population. Hum Genet. 2008;124:543–552. doi: 10.1007/s00439-008-0580-y. [DOI] [PMC free article] [PubMed] [Google Scholar]
- Abecasis GR, Cherny SS, Cookson WOC, Cardon LR. Grr: graphical representation of relationship errors. Bioinformatics. 2001;17:742–743. doi: 10.1093/bioinformatics/17.8.742. [DOI] [PubMed] [Google Scholar]
- Boichard D.Pedig: a fortran package for pedigree analysis suited to large populations7th World Congress on Genetics Applied to Livestock Production, Montpellier; 2002. paper28–13 [Google Scholar]
- Meuwissen THE, Luo Z. Computing inbreeding coefficients in large populations. Genet Sel Evol. 1992;24:305–313. [Google Scholar]
- Almasy L, Blangero J. Multipoint quantitative-trait linkage analysis in general pedigrees. Am J Hum Genet. 1998;62:1198–1211. doi: 10.1086/301844. [DOI] [PMC free article] [PubMed] [Google Scholar]
- Gilmour AR, Gogel BJ, Cullis BR, Welham SJ, Thompson R. ASREML User Guide Release 1.0. Hemel Hempstead, UK: VSN International Ltd; 2002. [Google Scholar]
- Abney M, McPeek MS, Ober C. Broad and narrow heritabilities of quantitative traits in a founder population. Am J Hum Genet. 2001;68:1302–1307. doi: 10.1086/320112. [DOI] [PMC free article] [PubMed] [Google Scholar]
- Campbell H, Carothers AD, Rudan I, et al. Effects of genome-wide heterozygosity on a range of biomedically relevant human quantitative traits. Hum Mol Genet. 2007;16:233–241. doi: 10.1093/hmg/ddl473. [DOI] [PubMed] [Google Scholar]
- Beekman M, Heijmans BT, Martin NG, et al. Heritabilities of apolipoprotein and lipid levels in three countries. Twin Res. 2002;5:87–97. doi: 10.1375/1369052022956. [DOI] [PubMed] [Google Scholar]
- Evans A, van Baal GCM, McCarron P, et al. The genetics of coronary heart disease: the contribution of twin studies. Twin Res. 2003;6:432–441. doi: 10.1375/136905203770326439. [DOI] [PubMed] [Google Scholar]
- Fenger M, Schousboe K, Sorensen TIA, Kyvik KO. Variance decomposition of apolipoproteins and lipids in Danish twins. Atherosclerosis. 2007;191:40–47. doi: 10.1016/j.atherosclerosis.2006.04.024. [DOI] [PubMed] [Google Scholar]


