Abstract
The Afrotheria, a supraordinal grouping of mammals whose radiation is rooted in Africa, is strongly supported by DNA sequence data but not by their disparate anatomical features. We have used flow-sorted human, aardvark, and African elephant chromosome painting probes and applied reciprocal painting schemes to representatives of two of the Afrotherian orders, the Tubulidentata (aardvark) and Proboscidea (elephants), in an attempt to shed additional light on the evolutionary affinities of this enigmatic group of mammals. Although we have not yet found any unique cytogenetic signatures that support the monophyly of the Afrotheria, embedded within the aardvark genome we find the strongest evidence yet of a mammalian ancestral karyotype comprising 2n = 44. This karyotype includes nine chromosomes that show complete conserved synteny to those of man, six that show conservation as single chromosome arms or blocks in the human karyotype but that occur on two different chromosomes in the ancestor, and seven neighbor-joining combinations (i.e., the synteny is maintained in the majority of species of the orders studied so far, but which corresponds to two chromosomes in humans). The comparative chromosome maps presented between human and these Afrotherian species provide further insight into mammalian genome organization and comparative genomic data for the Afrotheria, one of the four major evolutionary clades postulated for the Eutheria.
The anatomical features of living and extinct mammals have historically provided the foundation for placing the 18 orders of mammals in phylogenetic frameworks (1). The monophyly of most of the orders is generally supported (2), but several problems in higher eutherian relationships have been the subject of enduring debate, especially so since the advent of molecular data sets (reviewed in ref. 3). One of the more puzzling problems that has recently emerged, fuelled exclusively by molecular studies, has been the superordinal grouping of an apparently endemic clade of African placentals, the Afrotheria.
DNA sequence evidence from various nuclear and mtDNA genes and a unique 9-bp deletion in exon 11 of the BRCA1 gene support an Afrotherian grouping (4–12) that comprises six of the orders of mammals. On morphological grounds, however, there is little to suggest that the Proboscidea (elephant), Tubulidentata (aardvark), Macroscelidea (elephant shrews or sengis), Hyracoidea (hyrax), Sirenia (dugongs and manatees), and the newly erected subordinal Afrosoricida (golden mole and tenrecs; ref. 13) form a natural assemblage (the Afrotheria), with species showing a variety of ecological and morphological specialization (14). In fact, if the molecular hypothesis is correct, morphology has failed to detect a single anatomical character that would unite one of the most fundamental clades in mammalian evolution (8, 13).
Statistical measures of support for the monophyly of the Afrotheria based on molecular data are consistent with the phylogenetic associations suggested by the biogeographic patterns and fossil history of the group (4, 5, 8–10, 15; see also ref. 3). Moreover, given that the Afrotheria's antecedents seem to have been entirely Afro-Arabian, the most parsimonious explanation is a single Afro-Arabian origin that was broadly contemporaneous with the break-up of the supercontinent Gondwanaland (ref. 16 and references therein). Tectonic movement isolated Afro-Arabia as an “island continent” until the late Cenozoic when intercontinental dispersal became a possibility (15). However, although there is strong molecular support for the Afrotheria, the group's position in the eutherian tree has been a matter of debate with several studies positing a basal placement (8–10, 15), whereas others argue for the Xenarthra (12, 17, 18). Recently, phylogenetic analysis of the protein coding genes from complete mitochondrial genomes place the Erinaceomorpha (hedgehogs) basal (19), further underscoring the uncertainty in determining the root for the eutherian crown group.
In an attempt to shed more light on the evolutionary affinities and placement of the Afrotheria in the eutherian tree, we have adopted a comparative genomic approach that relies on cross-species chromosome painting as a means of delimiting evolutionarily conserved chromosomes and subchromosomal segments among taxa at the molecular cytogenetic level. By so doing, we aim to identify cytogenetic signatures that may shed light on the monophyly of this primitive and morphologically diverse assemblage, ascertain sister–group relationships among in-group taxa, accurately reconstruct the ancestral eutherian karyotype, and construct rudimentary homology maps with that of man.
Herein, we report the outcome of comparative painting between man and three species of the Afrotheria: the aardvark (Orycteropus afer, 2n = 20), the African elephant (Loxodonta africana, 2n = 56), and the Asian elephant (Elephas maximus, 2n = 56). Our study provides comparative genomic data for the Afrotheria, one of four superordinal placental mammal groups (Afrotheria, Xenarthra, Laurasiatheria, and Euarchontoglires) currently recognized (9, 10) and strong evidence of the mammalian ancestral karyotype.
Materials and Methods
Flow Sorting and Generation of Chromosome-Specific Paint Probes.
Chromosome-specific painting probes for human, aardvark, and African elephant were made by degenerate oligonucleotide PCR amplification of flow-sorted chromosomes following previously described methods (20). Aardvark and African elephant chromosome preparations for sorting were made from primary fibroblast culture derived from skin biopsies. All 24 chromosome-specific paint probes (21) representing the entire human genome (1–22, X and Y), were used to delimit homologous chromosomes/segments in the genomes of aardvark and African and Asian elephants. Reverse painting of aardvark and African elephant paint probes onto human metaphases was included as it provides another dimension to our genome-wide comparisons by allowing for the assignment of regions of chromosomal homology with a high degree of precision.
Fluorescence in Situ Hybridization.
Comparative chromosome painting between human and aardvark, and human and elephant was performed as previously described (22–24). In brief, 100–150 ng of biotin-labeled chromosome-specific paints were made up to 12 ml with hybridization buffer (50% deionized formamide/10% dextran sulfate/2× SSC/0.5 M phosphate buffer, pH 7.3/1× Denhardt's solution). The probes were denatured at 65°C for 10 min and then preannealed by incubation at 37°C for 15–60 min. Metaphase slides from peripheral fibroblast cultures were denatured by incubation in 70% formamide/2× SSC solution at 65°C for 1.5–2 min, quenched in ice-cold 70% ethanol, and dehydrated through a 70%, 90%, and 100% ethanol series. The preannealed paints were applied to slides, covered with 22 × 22-mm2 coverslips, sealed, and incubated for 72 h at 37°C. Posthybridization washes involved two 5-min incubations in 50% formamide, 50% 2× SSC at 40°C, followed by two 5-min incubations in 2× SSC at 40°C. Biotin-labeled probes were visualized using Cy3-avidin (1:500 dilution, Amersham Pharmacia). After detection, slides were mounted in Antifade AF1 (Citifluor, Kent, U.K.) containing 0.6 mg/ml 4′,6-diamidino-2-phenylindole.
Phylogenomics.
Two species are considered closely related if they share one or more derived character state, with derived conditions being distinguished from primitive ones by analysis of appropriate outgroups and parsimony. The underlying assumption in this cladistic approach is that a character state possessed by both in-group and outgroup taxa represents the primitive condition for the in-group. Although a strict cladistic interpretation of our data is problematic (the appropriate outgroup to the Afrotheria would be a marsupial), we follow others in using commonality of a particular chromosomal state to reflect a common evolutionary origin (21, 25–27). [Thus far, chromosome painting across the Eutheria/Metatheria boundary has proved intractable with the exception of the X chromosome, where a portion, Xp11.2→Xqter, is conserved between the two lineages (28).] In determining primitive and derived associations, we used chromosome painting data from representatives of the Primates, Scandentia, Lagomorpha, Carnivora, Cetartiodactyla, Perissodactyla, Chiroptera, Insectivora (Eurylipotyphla), Xenarthra, and the two Afrotherian orders the Tubulidentata and Proboscidea (see ref. 27 and references therein; see also refs. 29–31).
Results and Discussion
Flow Sorting of the Aardvark and African Elephant.
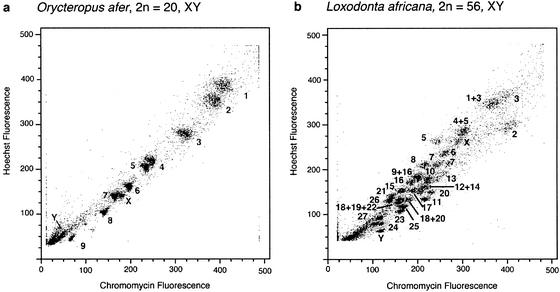
Using size and the AT:GC ratio of Hoechst 33258 and chromomycin A3-stained chromosomes for flow sorting, the male aardvark's karyotype (2n = 20, XY) resolved into 11 peaks and, in the case of the African elephant (2n = 56, XY), into 28 peaks. Chromosome-specific paints were generated from the aardvark's 11 chromosomal pools and verified by fluorescence in situ hybridization to 4′,6-diamidino-2-phenylindole-banded aardvark chromosomes. Each flow peak (Fig. 1a) was shown to represent a single aardvark chromosome.
Figure 1.
Bivariate chromosome sorting of the aardvark, O. afer (a), and the African elephant, L. africana (b), showing chromosomal assignments to flow karyotypes of each species. Each flow peak was shown to represent a single aardvark chromosome type. In the case of the elephant, pure sorts of single chromosomes were obtained for 23 chromosomes with the two homologues of chromosome 7 and 24, each resolved into a different peak due to heterochromatic differences, and six peaks contained two chromosomes.
Of the 29 paint probes generated from the flow-sorted chromosomes of the African elephant (Fig. 1b), 23 hybridized to a single chromosome (nos. 2, 3, 5, 6, 7, 7, 8, 10, 11, 13, 15, 16, 17, 20, 21, 23, 24, 24, 25, 26, 27, X, and the Y) when painted to G-banded elephant chromosomes. The homologues of chromosomes 7 and 24 were each separated into a different peak due to differences in the amounts of heterochromatin between the respective homologues of each pair. The remaining six probes each painted more than one chromosome, but since chromosomes 3, 5, 16, and 20 were also isolated in pure form, we were able to fully characterize the probes from chromosomes 1 + 3, 4 + 5, 9 + 16, and 18 + 20, respectively. Peaks containing chromosomes 18 + 19 + 22 and 12 + 14 could not be further resolved.
Chromosome Painting.
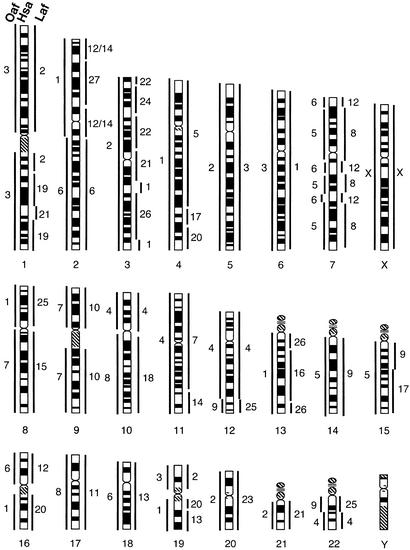
All 22 human autosomal painting probes and the X successfully defined homologous segments of conserved synteny between human and the three Afrotherian species; the outcome of the reciprocal painting experiments are summarized in Fig. 2. The bidirectional painting results are concordant, providing a one-to-one correspondence among aardvark, elephant, and human chromosomes (A+X) with the exception of homology between human chromosome 6 and elephant chromosome 26.
Figure 2.
A schematic summary of the genome-wide correspondence among aardvark (Oaf, Left), human (Hsa, Center), and African elephant (Laf, Right) chromosomes as determined by cross-species reciprocal chromosome painting using the human idiogram as reference.
Human (Hsa) and Aardvark (Oaf).
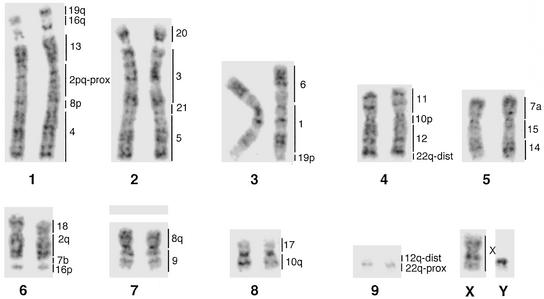
Painting probes derived from 15 human chromosomes (nos. 1, 3, 4–6, 9, 11, 13–15, 17, 18, 20, 21, and X) each delimit one homologous segment (i.e., corresponding to an intact human chromosome). Additionally, eight human chromosome painting probes (nos. 2, 7, 8, 10, 12, 16, 19, and 22) each delimit two conserved segments in the aardvark genome (Fig. 3). All of the previously postulated ancestral mammalian syntenies (21, 26, 27) that are composed of two adjacent segments homologous to different human chromosomes were also present in the aardvark genome. These are Hsa 3/21, 4/8, 7/16, 12/22, 14/15, and 16/19. The disruption of syntenies of human chromosomes 2, 7, 8, 10, 12, 16, 19, and 22 in the aardvark is consistent with the hypothesis that these chromosomes evolved recently through fission of more ancient segments during primate species radiation (27). In total, therefore, the 22 human autosomal paints delimit 30 synteny-conserved segments in the aardvark genome. This is the lowest number identified in non-primate species, suggesting that the aardvark has retained a karyotype that largely resembles that of the last common ancestor of all eutherians.
Figure 3.
G-banded karyotype of the aardvark O. afer (2n = 20). The region of homology to the respective human chromosomes is shown to the right of each aardvark chromosome pair.
Human (Hsa) and the African (Laf) and Asian (Ema) Elephants.
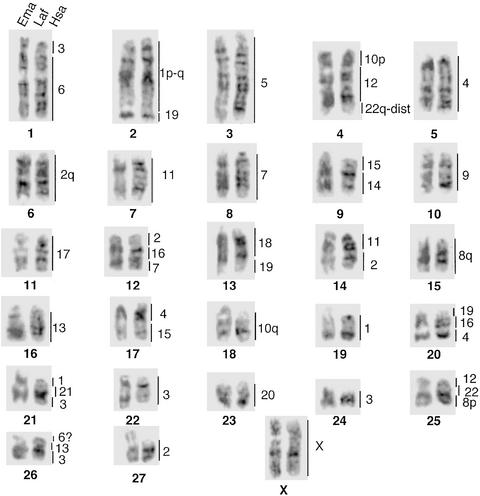
Human painting probes produced identical hybridization patterns in both the African and Asian elephants, confirming that both species possess karyotypes that differ only in the amount and distribution of C-band positive heterochromatin (Fig. 4, ref. 32). Paints from eight human chromosomes (nos. 5, 9, 14, 17, 18, 20, 21, and X) each detected one conserved chromosome, or one chromosomal segment in the elephant karyotype, with the remaining human painting probes delimiting two to four conserved segments. In total, 22 human autosomal paints revealed 44 segments of conserved synteny in the elephant haploid genome (Fig. 4). Most of the ancient human segment combinations such as Hsa 3/21, 7q/16p, 12/22a, 14/15, and 16q/19q were also present in the elephants. Eight associations (Hsa 3/6, 18/19, 4/15, 2/16/7, 2/11, 4/16/19, 8/22, and 6/13/3) seem to be elephant specific but may, once comparable data are available for the other Afrotherian species, prove useful in a cladistic framework for determining relationships within the in-group.
Figure 4.
G-banded comparisons of homologues between the Asian (Ema) and African (Laf) elephants. The regions of homology to the respective human chromosomes are shown to the right of each elephant chromosome pair. Karyotypic differences between the two elephant species are attributable to variation in the amount and position of heterochromatin.
Although our comparative chromosome painting approach failed to identify unique characters that unite the Afrotheria to the exclusion of other placental groups, there are nonetheless two adjacent segment combinations detected in the Afrotheria that are especially noteworthy. The association of Hsa 10p/12/22qdist found in the aardvark chromosome 4q and elephant chromosome 4 is present in the Carnivora (33–35) and has been suggested to comprise part of the ancestral carnivore karyotype (27). Clearly, the detection in the Afrotheria gives greater credence to the idea that it may be ancestral for all eutherian mammals. The Hsa 1/19p association detected in both the elephants and aardvark has also been found in the galago (Otolemur crassicaudatus, ref. 31), and it too is likely to be ancestral for all eutherians. Should this hold, elephant chromosomes 2 and 19 can be derived from the aardvark chromosome 3q via one fission.
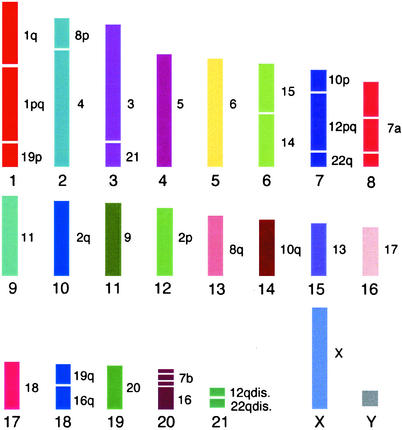
Taking the results from the two Afrotherian orders, the Tubulidentata and Proboscidea, together with those derived from representatives of the other nine mammalian orders for which human chromosome-specific painting probes have been used in cross-species in situ hybridization experiments leads us to propose that the eutherian ancestral karyotype comprised 2n = 44, XY (Fig. 5). The 2n = 44 differs from the 2n = 50 proposed by Murphy et al. (27) and the 2n = 48 by Chowdhary et al. (26). In large part, this has to do with the configuration of chromosomes 1 and 7 in our scheme where the former chromosome is represented by three independent elements (1p-q, 1qt, and 19) in Murphy et al. (27) and the latter by two (10p, and 12p-q, 22qt). These three fusions would account for the difference between 2n = 50 and the 2n = 44 hypothesized herein. Differences with the Chowdhary et al. (26) proposal are more extensive.
Figure 5.
The eutherian ancestral karyotype. Chromosomes are ordered according to approximate length. Numbers to the right indicate human homologues. The position of centromeres is not shown, because this cannot be deduced from fluorescence in situ hybridization using chromosome-specific painting probes. Homology with the human Y chromosome is not shown because it was not hybridized.
Our data suggest the following human chromosomes, chromosome arms, and segmental associations were embodied in this ancestral state. First, nine chromosomes show complete chromosomal synteny, i.e., they are conserved in toto: Hsa5–6, Hsa9, Hsa11, Hsa13, Hsa17–18, Hsa20, and HsaX. Second, there are six chromosomes that show conservation as single chromosome arms or blocks that occur on two different chromosomes in the ancestor: Hsa7a, Hsa7b, Hsa2q, Hsa2p, Hsa8q, and Hsa10q. Finally, there are seven neighbor-joining combinations (i.e., the synteny is maintained in the majority of species of the orders studied thus far but which correspond to two chromosomes in humans): Hsa1/19p, Hsa8p/4, Hsa3/21, Hsa15/14, Hsa10p/12pq/22q, Hsa19q/16q, and Hsa12qdis/22qdis). The evolutionary breakpoints identified by the ancestral karyotype provide a departure point for addressing fundamental questions in mammalian genome architecture. These include a possible correlation with chromosomal polymorphisms or translocations that cause neoplasia in humans and whether sequence analysis of the evolutionary breakpoints contain motifs that promote chromosome breakage (36).
In conclusion, although our data do not confirm the monophyly of the Afrotheria, it is noteworthy that, added to the aardvark's combination of seemingly plesiomorphic and highly autapomorphic traits (37), we can include the retention of a karyotype that provides strong evidence of the eutherian ancestral state. Extending comparative chromosome painting analyses to the remaining Afrotheria and the Xenarthra, the two basal superordinal groups at the root of the eutherian phylogenetic tree, will facilitate the transfer of mapping data among evolutionarily highly divergent species and contribute to the development of a cohesive, chromosomal character-based phylogenetic framework for all eutherian mammals.
Acknowledgments
We are grateful to Johan Watson (Free State Department of Environmental and Economic Affairs) for permission to collect aardvark material and for assistance in the field, and to Dr. D. Suwattana (Chulalongkorn University, Bangkok, Thailand) for metaphase chromosome cell suspensions of the Asian elephant. This study was funded in part by a Wellcome Trust Collaborative Research Initiative Grant (to T.J.R. and M.A.F.-S.), the South African National Research Foundation (to T.J.R.), the National Natural Science Foundation of China and the Chinese Academy of Sciences (to F.Y.), the Russian Fund of Basic Research (to A.S.G., P.L.P., and E.Z.A.), and Grant 01-2163 from the International Association for the Promotion of Co-operation with Scientists from the New Independent States of the Former Soviet Union (to A.S.G. and M.A.F.-S.).
Footnotes
This paper was submitted directly (Track II) to the PNAS office.
References
- 1.Simpson G C. Bull Am Mus Nat Hist. 1945;85:1–350. [Google Scholar]
- 2.Novacek M J. Nature. 1992;356:121–125. doi: 10.1038/356121a0. [DOI] [PubMed] [Google Scholar]
- 3.Novacek M J. Curr Biol. 2001;11:573–575. doi: 10.1016/s0960-9822(01)00347-5. [DOI] [PubMed] [Google Scholar]
- 4.Springer M S, Cleven G C, Madsen O, de Yong W W, Waddell V G, Amrine H M, Stanhope M J. Nature. 1997;388:61–64. doi: 10.1038/40386. [DOI] [PubMed] [Google Scholar]
- 5.Stanhope M J, Madsen O, Waddell V G, Cleven G C, de Jong W W, Springer M S. Mol Phylogenet Evol. 1998;9:501–508. doi: 10.1006/mpev.1998.0517. [DOI] [PubMed] [Google Scholar]
- 6.Easteal E. BioEssays. 1999;21:1052–1058. doi: 10.1002/(SICI)1521-1878(199912)22:1<1052::AID-BIES9>3.0.CO;2-6. [DOI] [PubMed] [Google Scholar]
- 7.Springer M S, Amrine H M, Burk A, Stanhope M J. Syst Biol. 1999;48:65–75. doi: 10.1080/106351599260445. [DOI] [PubMed] [Google Scholar]
- 8.Madsen O, Scally M, Douady C J, Kao D J, DeBry R W, Adkins R, Amrine H M, Stanhope M J, de Jong W W, Springer M S. Nature. 2001;409:610–614. doi: 10.1038/35054544. [DOI] [PubMed] [Google Scholar]
- 9.Murphy W J, Elzirik E, Johnson W E, Zhang Y P, Ryder O A, O'Brien S J. Nature. 2001;409:614–618. doi: 10.1038/35054550. [DOI] [PubMed] [Google Scholar]
- 10.Murphy W J, Eizirik E, O'Brien S J, Madsen O, Scally M, Douady C J, Teeling E, Ryder O A, Stanhope M J, de Yong W W, Springer M S. Science. 2001;294:2348–2351. doi: 10.1126/science.1067179. [DOI] [PubMed] [Google Scholar]
- 11.Van Dijk M A M, Madsen O, Catzeflis F, Stanhope M J, de Jong W W, Pagel M. Proc Natl Acad Sci USA. 2001;98:188–193. doi: 10.1073/pnas.250216797. [DOI] [PMC free article] [PubMed] [Google Scholar]
- 12.Scally M, Madsen O, Douady C J, de Jong W W, Stanhope M J, Springer M S. J Mammal Evol. 2001;8:239–277. [Google Scholar]
- 13.Stanhope M J, Waddell V G, Madsen O, de Jong W W, Hedges S B, Cleven G C, Kao D, Springer M S. Proc Natl Acad Sci USA. 1998;95:9967–9972. doi: 10.1073/pnas.95.17.9967. [DOI] [PMC free article] [PubMed] [Google Scholar]
- 14.Shoshani J, McKenna M C. Mol Phylogenet Evol. 1998;9:572–584. doi: 10.1006/mpev.1998.0520. [DOI] [PubMed] [Google Scholar]
- 15.Eizirik E, Murphy W J, O'Brien S J. J Hered. 2001;92:212–219. doi: 10.1093/jhered/92.2.212. [DOI] [PubMed] [Google Scholar]
- 16.Seiffert E R. IUCN Afrotherian Conserv Newsletter. 2002;1:3–6. [Google Scholar]
- 17.Liu F-G R, Miyamoto M M, Freire N P, Ong P Q, Tennant M R, Young T S, Gugel K F. Science. 2001;291:1786–1789. doi: 10.1126/science.1056346. [DOI] [PubMed] [Google Scholar]
- 18.Jow H, Hudelot C, Rattray M, Higgs P G. Mol Biol Evol. 2002;19:1591–1601. doi: 10.1093/oxfordjournals.molbev.a004221. [DOI] [PubMed] [Google Scholar]
- 19.Arnason U, Adegoke J A, Bodin K, Born E, Esa Y B, Gullberg A, Nilsson M, Short R V, Xu X, Janke A. Proc Natl Acad Sci USA. 2002;98:10751–10756. doi: 10.1073/pnas.102164299. [DOI] [PMC free article] [PubMed] [Google Scholar]
- 20.Telenius H, Pelmear A H, Tunnacliffe A, Carter N P, Behmel A, Ferguson-Smith M A, Nordenskjold M, Pfragner R, Ponder B A J. Genes Chromosomes Cancer. 1992;4:257–263. doi: 10.1002/gcc.2870040311. [DOI] [PubMed] [Google Scholar]
- 21.Ferguson-Smith M A, Yang F, O'Brien P C M. INLAR J. 1998;39:68–76. doi: 10.1093/ilar.39.2-3.68. [DOI] [PubMed] [Google Scholar]
- 22.Scherthan H, Cremer T, Arnason U, Weier H-U, Lima-de-Faria A, Frönicke L. Nat Genet. 1994;6:342–348. doi: 10.1038/ng0494-342. [DOI] [PubMed] [Google Scholar]
- 23.Yang F, Carter N P, Shi L, Ferguson-Smith M A. Chromosoma. 1995;103:642–652. doi: 10.1007/BF00357691. [DOI] [PubMed] [Google Scholar]
- 24.Yang F, Müller S, Just R, Ferguson-Smith M A, Wienberg J. Genomics. 1997;39:396–401. doi: 10.1006/geno.1996.4497. [DOI] [PubMed] [Google Scholar]
- 25.Rettenberger G, Klett C, Zechner U, Bruch J, Just W, Vogel W, Hameister H. Chromosome Res. 1995;3:479–486. doi: 10.1007/BF00713962. [DOI] [PubMed] [Google Scholar]
- 26.Chowdhary B P, Raudsepp T, Fronicke L, Scherthan H. Genome Res. 1998;8:577–589. doi: 10.1101/gr.8.6.577. [DOI] [PubMed] [Google Scholar]
- 27.Murphy W J, Stanyon R, O'Brien S J. Genome Biol. 2001;2:1–8. doi: 10.1186/gb-2001-2-6-reviews0005. [DOI] [PMC free article] [PubMed] [Google Scholar]
- 28.Glas R, Marshall Graves J, Toder R, Ferguson-Smith M, O'Brien P. Mamm Genome. 1999;10:1115–1116. doi: 10.1007/s003359901174. [DOI] [PubMed] [Google Scholar]
- 29.Dixkens C, Klett C, Bruch J, Kollak A, Serov O L, Zhdanova N, Vogel W, Hameister H. Cytogenet Cell Genet. 1998;8:61–67. doi: 10.1159/000014958. [DOI] [PubMed] [Google Scholar]
- 30.Richard F, Lombard M, Dutrillaux B. Genome Res. 2000;10:644–651. doi: 10.1101/gr.10.5.644. [DOI] [PMC free article] [PubMed] [Google Scholar]
- 31.Stanyon R, Koehler U, Consigliere S. Am J Phys Anthropol. 2002;75:37–52. doi: 10.1002/ajpa.10047. [DOI] [PubMed] [Google Scholar]
- 32.Houck M L, Kumamoto A T, Gallagher D S, Benirschke K. Cytogenet Cell Genet. 2001;93:249–252. doi: 10.1159/000056992. [DOI] [PubMed] [Google Scholar]
- 33.Frönecke L, Müller-Navia J, Romanakis K, Scherthan H. Chromosoma. 1997;106:108–113. doi: 10.1007/s004120050230. [DOI] [PubMed] [Google Scholar]
- 34.Graphodatsky A S, Yang F, Serdukova N, Perelman P, Zhdanova N, Z, Ferguson-Smith M A. Cytogenet Cell Genet. 2000;90:275–278. doi: 10.1159/000056788. [DOI] [PubMed] [Google Scholar]
- 35.Yang F, Graphodatsky A, O'Brien P M C, Colabella A, Solansky N, Squire M, Sargan D, Ferguson-Smith M A. Chromosome Res. 2000;8:393–404. doi: 10.1023/a:1009210803123. [DOI] [PubMed] [Google Scholar]
- 36.Dehal P, Predki P, Olsen A S, Kobayashi A, Folta P, Lucas S, Land M, Terry A, Ecale Zhou C L, Rash S, et al. Science. 2001;293:104–111. doi: 10.1126/science.1060310. [DOI] [PubMed] [Google Scholar]
- 37.Melton D A. Mammal Rev. 1976;6:75–88. [Google Scholar]


