Abstract
We investigated the organization of interacting proteins and protein complexes into networks of modules. A network-clustering method was developed to identify modules. This method of network-structure determination was validated by clustering known signaling-protein modules and by identifying module rudiments in exclusively high-throughput protein-interaction data with high error frequencies and low coverage. The signaling network controlling the yeast developmental transition to a filamentous form was clustered. Abstraction of a modular network-structure model identified module-organizer proteins and module-connector proteins. The functions of these proteins suggest that they are important for module function and intermodule communication.
Protein molecules bind to each other to form stable complexes that often can be purified. At a higher level of structure, proteins and protein complexes interact with preferred partners weakly, transiently, or conditionally to form a biological module serving a specific collective function (1). For example, a MAPK (mitogen-activated protein kinase) cascade, together with its scaffold proteins and various regulators and effectors, forms a signal-amplification module. As another example, a spindle-pole body is a consortium of protein complexes that form a hub for the attachment and organization of microtubules. Driven by the acquisition of whole-genome-scale data sets from complex biological systems, our conception of biomolecular organization is evolving from metabolic and signaling pathways to networks of evolutionarily conserved modules (2–4).
With the abundance of protein–protein interaction data produced by genome-scale efforts (5–9), it is possible to create a global representation of the protein-interaction network of the yeast cell (4–6). This network has been shown to have a nonrandom power-law distribution of node connectivity (number of interactions of each protein) and a low frequency of direct connections between high-connectivity nodes (10). These observations suggest modular organization consistent with the insights of biologists (1). Various methods of network clustering have been developed and applied to identify modules in various biological systems, including a genomic cooccurrence network (11), a food web (12), and the Escherichia coli metabolic network (13). We developed and evaluated a network-clustering method using the modular network of yeast signaling proteins. In addition, we identified modules in an interaction network consisting of exclusively mass-produced data with very low coverage and very high false-positive frequency. Moreover, we integrated functional gene-identification data with protein–protein interaction data to provide a modular abstraction of the organization of a complex network controlling a biological response.
Materials and Methods
Network Clustering.
For each biological network investigated, vertices (relevant proteins) and edges (protein–protein interactions among them) were assembled as described in the text. Each edge in the network was assigned a length of 1. An all-pairs-shortest-path distance matrix was calculated by using standard algorithms. The all-pairs-shortest-path matrix contains the length of the shortest path (distance) between every pair of vertices in the network. Each distance in the all-pairs-shortest-path matrix was transformed into an “association,” defined as 1/d2, where d is the shortest-path distance. This transformation emphasizes local associations (short paths) in the subsequent clustering. The resulting associations range from 0 to 1. The association of a vertex with itself was defined as 1. The association of vertices that have no connecting path was defined as 0. Hierarchical agglomerative average-linkage clustering with the uncentered correlation coefficient as the distance metric (14) was applied to the association matrix. The treeview program (14) was used to view the results. For the clustering of the signaling-protein network, the Munich Information Center for Protein Sequences (MIPS) (15) database list of proteins of the signaling category and its pathway subcategories was obtained in August 2001.
Identification of Filamentation-Network Proteins.
We searched the Yeast Protein Database (16) for proteins with annotations matching the search query (invasi* OR filament* OR pseudohypha*). Hits were screened manually for relevance to filamentation, invasive growth, or pseudohyphal development. These were supplemented with proteins implicated in reviews (17, 18).
Results
Network Clustering.
We sought to compute the modular organization of cellular networks controlling specific biological responses. We represented yeast protein-interaction networks as graphs of vertices and edges (nodes and links corresponding to proteins and interactions), and developed a network-clustering method based on the following ideas: (i) the shortest path between any two vertices is likely to be the most relevant one for functional associations and information transmission; (ii) each vertex in a network has a unique profile of shortest-path distances through the network to every other vertex; and (iii) module comembers are likely to have similar (clustered) shortest-path-distance profiles. The method is described in Materials and Methods.
Modular Structure of the Yeast Signaling Network.
The conception of the structure of cellular systems as a network of modules (1) comes from the intensive study of systems like the yeast signaling network. Accordingly, we used this system, for which there are many high-confidence individually validated interaction data, to test our approach.
We assembled a set of interactions containing 4,079 proteins and 6,761 protein–protein interactions from a global two-hybrid screen (7) and a composite data set (4) that includes global two-hybrid data and individually validated interaction data. The MIPS-database signaling-protein category (15) includes 133 proteins. Of these, 64 had at least one interaction with another signaling protein. A network consisting of these 64 proteins and the interactions among them was extracted from the global set of interactions. Network clustering was applied to this signaling network.
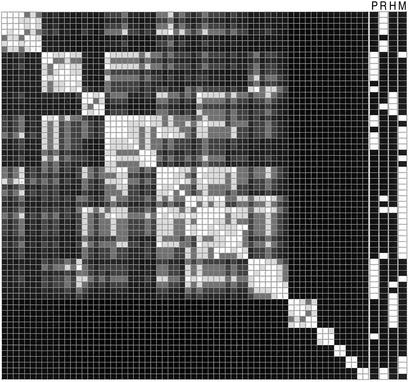
The results are displayed as a grayscale representation of the values in the clustered protein–protein pairwise association matrix; pairwise association is a simple function of shortest-path distance (see Materials and Methods). Each row or column represents a single protein. The matrix is symmetrical because it was clustered identically in both dimensions. Direct interactions are white. Indirect interactions of increasing distance (weaker association) are progressively darker. All features on the diagonal (self associations) are white. Interactions between clusters, both direct and indirect, are evident at the points off the diagonal where their components intersect.
The protein clusters in the signaling network represent the modules of signaling pathways (Fig. 1). For example, in Fig. 1, Ras-pathway proteins form a single cluster. The organization of a pathway into separate protein clusters reflects the existence of more than one module within the pathway. Among the clusters are three MAPK pathways, including the high-osmolarity glycerol pathway (HOG), the PKC pathway, and the mfMAPK pathway. The HOG and PKC pathways are each split into two clusters (PKC includes an additional polarity-regulation cluster in MIPS); one cluster comprises sensory complexes and signal integrators, and the other comprises a MAPK cascade and associated proteins (data not shown).
Figure 1.
Clustering of the yeast signaling-protein interaction network. A symmetrical matrix of 64 proteins of the MIPS-database signaling category was clustered identically in both dimensions. The cluster tree is not shown. Each row or column represents a protein. Each feature is the intersection of two proteins and is a grayscale representation of pairwise protein association (see text). Columns to the right of the clustered network represent MIPS-defined signaling pathways [P, polarity-PKC; R, Ras; H, HOG; M, mating/filamentation MAPK (mfMAPK)]. White bars in the MIPS-pathway columns indicate protein members of the pathway.
Because pathway proteins are expected to show some clustering by random chance, the clustering of signaling proteins based on biological data was compared with the clustering of 100 networks in which the signaling-network interactions were randomly reassigned to signaling-protein pairs. The clustering of pathway proteins in the biological network is significantly higher than the clustering in randomized networks (Table 1).
Table 1.
Clustering scores for the signaling network and 100 randomized signaling networks
| Pathway | Clustering score
|
|
|---|---|---|
| Signaling network | Randomized networks | |
| HOG | 0.73 | 0.21 ± 0.11 |
| mfMAPK | 0.77 | 0.42 ± 0.07 |
| Polarity-PKC | 0.72 | 0.30 ± 0.08 |
| Ras | 0.46 | 0.20 ± 0.10 |
The clustering score equals 1 − (number of gaps/maximum number of gaps). A gap is the occurrence of one or more proteins between pathway comembers in the clustered protein ordering (Fig. 1). The maximum number of gaps equals the number of pathway proteins minus 1. Pathway members were specified by the MIPS database (15). Clustering scores were calculated for the clustered signaling network, and 100 randomized and clustered signaling networks (mean ± SD).
Network Clustering of High-Throughput Data Sets.
Network clustering can identify signaling modules in high-coverage, high-quality interaction data. However, data from high-throughput interaction screens have high false-positive error frequencies, ≈50% (19). In addition, high-throughput coverage of the proteome includes a minority of individually validated observations, and a small fraction of estimates of the total number of interactions (19). Also, many interactions may not occur within modules. For example, protein transport through the nuclear pore involves interactions between the pore proteins and many other proteins that have no other functional or physical associations. We sought to identify module rudiments in mass-produced data.
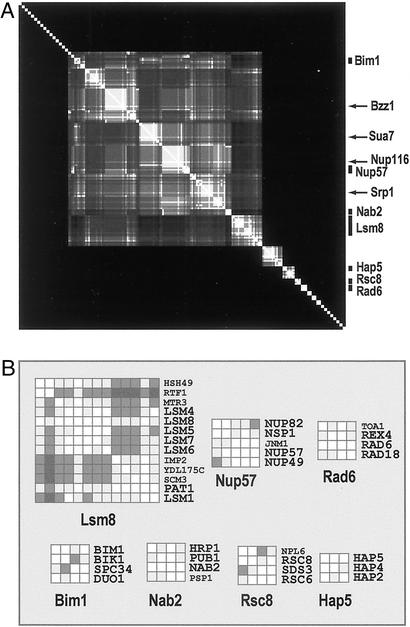
Because interacting proteins usually localize in the same subcellular compartments (19), integration of interaction and localization data can promote the identification of modules. We collected data from high-throughput screens of protein–protein interactions and protein localization in cellular compartments. A protein-binding data set was assembled from two exclusively high-throughput two-hybrid screens (7, 8). Protein localization data for 1,407 proteins were assembled from two exclusively high-throughput epitope-tagging data sets (20). A nuclear-protein subset was assembled. A nuclear-protein interaction network was extracted from the global high-throughput network and clustered (Fig. 2A). Clusters were delimited manually by using the cluster tree (not shown) as a guide.
Figure 2.
Clustering of the yeast nuclear-protein network derived from high-throughput interaction and localization data. (A) Examples of clusters representing module rudiments are labeled. The cluster tree is not shown. Arrows indicate high-connectivity hub proteins. (B) Example clusters are shown in detail. Cluster comembers participating in some common structure or function (see text) have large bold labels.
The network-clustering method and modules, by their nature, resist the effects of false-positive and false-negative data. Within modules, proteins have direct interactions and multiple close indirect interactions. Thus, modules are likely to resist cluster disruption by false-negative data because of the likelihood of alternative paths of short length. False-positive interactions, because of their spurious nature, are likely to occur between proteins in different modules. Consequently, false-positives are likely to appear as connections between separate clusters. In general, the similarity of shortest-path-distance profiles is a robust property within groups of nodes with a high number of internal connections and few external connections. This property, and the focus of our method on it, allows module identification in a network with high error frequencies. Moreover, false-positive interactions are likely to occur between proteins that are not functionally associated. The clustering of networks of interacting proteins sharing some other type of protein–protein association (like colocalization in a cell compartment) will exclude false-positive data.
Single proteins with many interactions (high-connectivity hub proteins) in two-hybrid screens nucleate large clusters that are not modules. All of the hub proteins indicated in Fig. 2A (arrows) bind >90 proteins in the global two-hybrid network. The proteins bound by these hubs are randomly distributed in cellular compartments (data not shown). The nuclear-localized proteins bound by these hubs (a minority of the global totals) form the four largest clusters in Fig. 2A. Proteins bound by high-connectivity hubs will have few or no interactions among themselves if they are not functionally associated. The four largest clusters in Fig. 2A have this “hub-and-spokes” structure. Moreover, the clusters formed by these high-connectivity hubs in the global interaction network have hub-and-spokes structures as well (data not shown). These observations suggest that the proteins bound by each high-connectivity hub are not functionally associated with each other, and that their clusters do not represent modules.
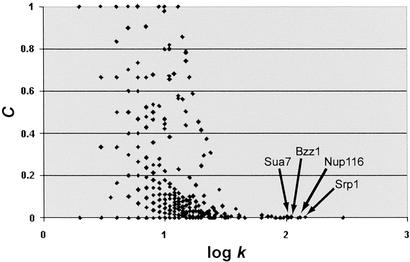
Because proteins that are functionally associated are likely to interact, a quantitative indication of modularity is the connectedness among a group of proteins. In a global plot of node connectivity versus neighborhood clustering (where the neighborhood is the set of adjacent nodes, and clustering is a measure of connectedness among a set of nodes), the four high-connectivity hub proteins indicated in Fig. 3 are among 15 outliers. Although these 15 proteins have exceedingly high connectivity, they almost completely lack neighborhood clustering (Fig. 3). These results suggest that quantitative properties can be used to distinguish modules from nonmodules.
Figure 3.
Global protein connectivity versus neighborhood clustering. Each protein in the global protein network (high-throughput data plus validated data) is plotted by its connectivity, k, and its neighborhood clustering, C, the ratio of the number of connections among its k neighbors to the maximum possible number, k(k − 1)/2. Arrows indicate high-connectivity proteins shown in Fig. 2A.
Many nuclear-protein clusters represent module rudiments. Examples are indicated in Fig. 2A and shown in Fig. 2B. Cluster names are from a protein with the most interactions within the cluster. Each cluster in Fig. 2B is enriched with proteins participating in a common cellular structure or function. These are snRNA-associated proteins (Lsm8 cluster), nuclear pore (Nup57 cluster), RNA polyadenylation (Nab2 cluster), chromatin remodeling (Rsc8 cluster), kinetochores (Bim1 cluster), DNA repair (Rad6), and CCAAT-binding factor (Hap5 cluster). These results, derived from sparse mass-produced data, lend further support for the existence of modules and the ability of our network-clustering method to identify them.
Application to Biological-Response Networks.
We incorporated network clustering into a three-step process to study complex biomolecular systems. This process generates a modular network-structure model showing major units of structure and function and the connection of these units into a network controlling a biological response. (i) Compile known and suspected components (vertices) of the response network. The identification of system components can be from any combination of methods, including database queries, expression profiling, proteomics, genetic screens, metabolite profiles, etc. (ii) Cluster the network based on interactions (edges) among the vertices. Edges can represent any type of pairwise connections, including protein–protein interactions, protein–DNA interactions, genetic interactions, and metabolic reactions. (iii) Abstract a modular network-structure model showing modules and their connections forming the network. The clustering of vertices into modules indicates concordance among disparate integrated data types. The comembers of each module share both common implication in a biological response and multiple interactions.
We generated a network-structure model of a complex system controlling the yeast developmental transition from a cellular yeast form into a filamentous invasive form. Under specific environmental conditions (carbon limitation for haploids, nitrogen limitation for diploids), budding yeast form invasive filaments. Filamentous-form cells grow in an altered cell cycle, produce chains of elongated cells that bud distal to the site of their birth, adhere to each other and solid substrates, and invade agar (21–23). Major fungal pathogens of humans and plants behave similarly in response to host tissues. Conserved signaling pathways control this fungal dimorphism (17, 18).
Clustering of the Filamentation Network.
A filamentation-network protein set was derived from a search of the Yeast Protein Database (16) and other published sources (17, 18) for proteins with mutant phenotypes or expression patterns associated with the filamentous form (see Materials and Methods). The resulting list includes many proteins that were implicated only by expression-profiling experiments or large-scale mutant screens. The database and literature searches garnered 229 proteins; current models include roles for 20–30 proteins. Of the 229 filamentation proteins, 90 had at least one interaction with another filamentation protein; these form a filamentation network. The sources of interaction data included high-throughput two-hybrid studies and individually validated observations (4, 7). These data sets do not contain all known protein–protein interactions. Some filamentation proteins, like Elm1, Tec1, and Flo11, are not included because the data sets contain no interactions involving them.
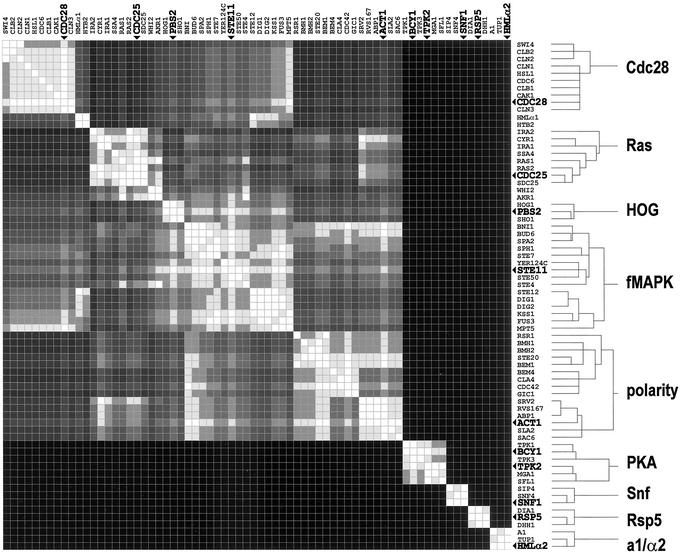
The filamentation-network proteins were clustered (Fig. 4). Using the clustering tree as a guide, we delimited cluster boundaries. A threshold tree depth was set. The threshold tree depth is a single point at which the tree is cut to uniquely specify all cluster boundaries. Raising the threshold results in cluster fusion. A lower threshold splits clusters. The threshold was set at a point low enough to split the two largest resulting clusters, polarity and filamentation MAPK (fMAPK). All clusters of three or more proteins below the tree threshold are indicated in Fig. 4.
Figure 4.
Clustering of the yeast filamentation network. Proteins of the yeast filamentation network were clustered. A tree-depth threshold was set. Tree branches with three or more leaves (clusters with three or more proteins) below the tree threshold are shown. Bullets and large bold labels indicate proteins of highest intracluster connectivity.
The composition of clusters in Fig. 4 reflects and extends current filamentation models. Current models (17, 18) incorporate 20–30 fMAPK, polarity, and Ras/protein-kinase-A pathway proteins. All of these pathways are represented by clusters with markedly expanded membership (Fig. 4). This expansion implicates multiple proteins whose role in filamentation is unknown or unclear, for example, Yer124C of the fMAPK cluster and Dia1 of the Rsp5 cluster. These observations suggest that network clustering can be used to direct experimental research by providing a functional context for uncharacterized components of likely importance. In addition, Snf, Cdc28, and a1/α2 clusters emerge. The Snf proteins control the carbon-source dependence of filamentation (24). Cdc28-associated proteins are involved in the altered cell-cycle progression of filamentous-form cells (22, 25). The a1/α2 cluster includes transcriptional regulators of cell-type specific (haploid versus diploid) development (21, 23). Additionally, the small Rsp5 cluster emerges as a module candidate.
Within each cluster there are one or two proteins of highest intracluster connectivity, i.e., the most interactions with other members of the same cluster (bullets and bold labels in Fig. 4). Essential proteins are overrepresented among those of high global connectivity (26). This suggests that proteins of highest intracluster connectivity are organizers and major functional components of their respective modules. The identities of these proteins in the filamentation-network clusters support this idea (Fig. 4). For example, the Bcy1 protein is an inhibitor of all three cyclic-AMP-dependent protein kinases of the protein kinase A module. Inactivation of Bcy1 results in a general increase in protein kinase A module activity (27). Other examples include the Act1 monomer of the polarized actin cytoskeleton, and the Cdc28 cyclin-dependent kinase, the central function of the Cdc28 module.
Modular Network-Structure Model and Intermodule Communication.
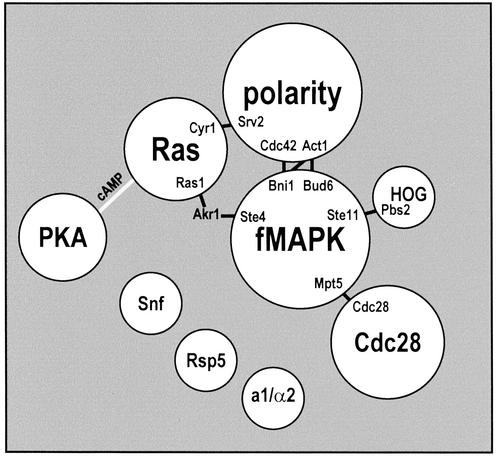
We generated a model of the modular structure of the filamentation network. Fig. 5 shows all of the clusters of Fig. 4 abstracted as modules. All intermodule paths are shown. All of these intermodule paths are direct connections, except one mediated by the Akr1 protein. Akr1 did not fall in any of the clusters. The modules are in a configuration that is consistent with current models of the filamentation network (17, 18).
Figure 5.
Modular model of the yeast filamentation network. Clusters indicated in Fig. 4 are abstracted as modules. All intermodule paths in the filamentation network are indicated as black lines with the interacting proteins at the termini. A gray line connecting the Ras and protein kinase A modules was added to indicate a connection mediated by the small molecule cAMP.
We examined the possibility that intermodule connections are important for the functions that modules carry out in association with each other. These relatively few interactions may be information-flow constriction points required for communication between major units of structure and function. Known roles of intermodule connector proteins suggest that they are critical for intermodule communication. Some proteins serve as connectors between signaling pathways and function in both. For example, Ste11 is a shared MAPK kinase kinase component (28) and a point of crosstalk (29) between the fMAPK and HOG pathways. In addition, Srv2 is known to link growth signals of the Ras module to the cytoskeleton (30). The model reflects these, and other examples. In addition, new possibilities are suggested. All paths from members of the fMAPK signaling module to members of the Cdc28 cell-cycle-control module travel through a single interaction between the Mpt5 and Cdc28 proteins. Kron et al. (22) showed an extended G2 cell-cycle phase associated with cell elongation and filament formation. This delayed mitosis involves the Cdc28 cyclin-dependent kinase (31) and the upstream fMAPK pathway (32). The connection between the fMAPK pathway and Cdc28 is unknown. The model of Fig. 5 suggests that Mpt5 mediates that connection.
Discussion
Cellular networks function and are organized in a modular fashion. We developed a method to compute the modular structure of networks and applied it to protein-interaction networks. The method was validated by using functionally enriched and high-throughput data sets. We applied the method to yeast filamentation proteins and abstracted a modular network-structure model of the system. The model reduces the complexity of this network to a small number of connected units of structure and function. This simplified representation facilitates the exploration of biological system properties in terms of molecules and interactions. The structural importance and known functions of module-organizer proteins suggest that they are major determinants of the functions of modules. Interactions that link the modules are likely points of communication and crosstalk. Identification and perturbation of modules, module organizers, and intermodule connections could be especially valuable in the study and redesign of biological systems.
The conserved components and common structural features of modules like the MAPK cascades support the idea that they are evolutionarily conserved. It has been suggested that the mfMAPK pathway of yeast is particularly ancient (18). The large size and complex structure of the mfMAPK module suggests further that biological modules may evolve by the familiar processes of duplication and divergence as well as processes of accretion and reconnection. Phylogenetic module profiles, including component conservation and conservation of interactions, will provide important insights on module structure, function, and origins. A library of conserved biological modules may facilitate the redesign of complex systems in nature and the laboratory.
Acknowledgments
We thank A. Aderem, R. Aebersold, J. Aitchison, C. Aldridge, I. Avila-Campillo, B. Drees, P. Edlefsen, L. Hood, T. Ideker, G. Lake, S. Prinz, B. Schwikowski, P. Shannon, A. Siegel, V. Thorsson, and M. Zahler for their contributions. Merck & Co., Inc. supported this work. T.G. is a recipient of a Burroughs Wellcome Fund Career Award in the Biomedical Sciences.
Abbreviations
- MIPS
Munich Information Center for Protein Sequences
- MAPK
mitogen-activated protein kinase
- mfMAPK
mating/filamentation MAPK
- fMAPK
filamentation MAPK
- HOG
high-osmolarity glycerol
References
- 1.Hartwell L H, Hopfield J J, Leibler S, Murray A W. Nature. 1999;402:C47–C52. doi: 10.1038/35011540. [DOI] [PubMed] [Google Scholar]
- 2.Boulton S J, Gartner A, Reboul J, Vaglio P, Dyson N, Hill D E, Vidal M. Science. 2002;295:127–131. doi: 10.1126/science.1065986. [DOI] [PubMed] [Google Scholar]
- 3.Oliver S. Nature. 2000;403:601–603. doi: 10.1038/35001165. [DOI] [PubMed] [Google Scholar]
- 4.Schwikowski B, Uetz P, Fields S. Nat Biotechnol. 2000;18:1257–1261. doi: 10.1038/82360. [DOI] [PubMed] [Google Scholar]
- 5.Gavin A C, Bosche M, Krause R, Grandi P, Marzioch M, Bauer A, Schultz J, Rick J M, Michon A M, Cruciat C M, et al. Nature. 2002;415:141–147. doi: 10.1038/415141a. [DOI] [PubMed] [Google Scholar]
- 6.Ho Y, Gruhler A, Heilbut A, Bader G D, Moore L, Adams S L, Millar A, Taylor P, Bennett K, Boutilier K, et al. Nature. 2002;415:180–183. doi: 10.1038/415180a. [DOI] [PubMed] [Google Scholar]
- 7.Ito T, Chiba T, Ozawa R, Yoshida M, Hattori M, Sakaki Y. Proc Natl Acad Sci USA. 2001;98:4569–4574. doi: 10.1073/pnas.061034498. [DOI] [PMC free article] [PubMed] [Google Scholar]
- 8.Uetz P, Giot L, Cagney G, Mansfield T A, Judson R S, Knight J R, Lockshon D, Narayan V, Srinivasan M, Pochart P, et al. Nature. 2000;403:623–627. doi: 10.1038/35001009. [DOI] [PubMed] [Google Scholar]
- 9.Zhu H, Bilgin M, Bangham R, Hall D, Casamayor A, Bertone P, Lan N, Jansen R, Bidlingmaier S, Houfek T, et al. Science. 2001;293:2101–2105. doi: 10.1126/science.1062191. [DOI] [PubMed] [Google Scholar]
- 10.Maslov S, Sneppen K. Science. 2002;296:910–913. doi: 10.1126/science.1065103. [DOI] [PubMed] [Google Scholar]
- 11.Snel B, Bork P, Huynen M A. Proc Natl Acad Sci USA. 2002;99:5890–5895. doi: 10.1073/pnas.092632599. [DOI] [PMC free article] [PubMed] [Google Scholar]
- 12.Girvan M, Newman M E. Proc Natl Acad Sci USA. 2002;99:7821–7826. doi: 10.1073/pnas.122653799. [DOI] [PMC free article] [PubMed] [Google Scholar]
- 13.Ravasz E, Somera A L, Mongru D A, Oltvai Z N, Barabasi A L. Science. 2002;297:1551–1555. doi: 10.1126/science.1073374. [DOI] [PubMed] [Google Scholar]
- 14.Eisen M B, Spellman P T, Brown P O, Botstein D. Proc Natl Acad Sci USA. 1998;95:14863–14868. doi: 10.1073/pnas.95.25.14863. [DOI] [PMC free article] [PubMed] [Google Scholar]
- 15.Mewes H W, Frishman D, Gruber C, Geier B, Haase D, Kaps A, Lemcke K, Mannhaupt G, Pfeiffer F, Schuller C, et al. Nucleic Acids Res. 2000;28:37–40. doi: 10.1093/nar/28.1.37. [DOI] [PMC free article] [PubMed] [Google Scholar]
- 16.Costanzo M C, Crawford M E, Hirschman J E, Kranz J E, Olsen P, Robertson L S, Skrzypek M S, Braun B R, Hopkins K L, Kondu P, et al. Nucleic Acids Res. 2001;29:75–79. doi: 10.1093/nar/29.1.75. [DOI] [PMC free article] [PubMed] [Google Scholar]
- 17.Lengeler K B, Davidson R C, D'Souza C, Harashima T, Shen W C, Wang P, Pan X, Waugh M, Heitman J. Microbiol Mol Biol Rev. 2000;64:746–785. doi: 10.1128/mmbr.64.4.746-785.2000. [DOI] [PMC free article] [PubMed] [Google Scholar]
- 18.Madhani H D, Fink G R. Trends Cell Biol. 1998;8:348–353. doi: 10.1016/s0962-8924(98)01298-7. [DOI] [PubMed] [Google Scholar]
- 19.von Mering C, Krause R, Snel B, Cornell M, Oliver S G, Fields S, Bork P. Nature. 2002;417:399–403. doi: 10.1038/nature750. [DOI] [PubMed] [Google Scholar]
- 20.Kumar A, Agarwal S, Heyman J A, Matson S, Heidtman M, Piccirillo S, Umansky L, Drawid A, Jansen R, Liu Y, et al. Genes Dev. 2002;16:707–719. doi: 10.1101/gad.970902. [DOI] [PMC free article] [PubMed] [Google Scholar]
- 21.Gimeno C J, Ljungdahl P O, Styles C A, Fink G R. Cell. 1992;68:1077–1090. doi: 10.1016/0092-8674(92)90079-r. [DOI] [PubMed] [Google Scholar]
- 22.Kron S J, Styles C A, Fink G R. Mol Biol Cell. 1994;5:1003–1022. doi: 10.1091/mbc.5.9.1003. [DOI] [PMC free article] [PubMed] [Google Scholar]
- 23.Roberts R L, Fink G R. Genes Dev. 1994;8:2974–2985. doi: 10.1101/gad.8.24.2974. [DOI] [PubMed] [Google Scholar]
- 24.Cullen P J, Sprague G F., Jr Proc Natl Acad Sci USA. 2000;97:13619–13624. doi: 10.1073/pnas.240345197. [DOI] [PMC free article] [PubMed] [Google Scholar]
- 25.Ahn S H, Acurio A, Kron S J. Mol Biol Cell. 1999;10:3301–3316. doi: 10.1091/mbc.10.10.3301. [DOI] [PMC free article] [PubMed] [Google Scholar]
- 26.Jeong H, Mason S P, Barabasi A L, Oltvai Z N. Nature. 2001;411:41–42. doi: 10.1038/35075138. [DOI] [PubMed] [Google Scholar]
- 27.Toda T, Cameron S, Sass P, Zoller M, Scott J D, McMullen B, Hurwitz M, Krebs E G, Wigler M. Mol Cell Biol. 1987;7:1371–1377. doi: 10.1128/mcb.7.4.1371. [DOI] [PMC free article] [PubMed] [Google Scholar]
- 28.Posas F, Saito H. Science. 1997;276:1702–1705. doi: 10.1126/science.276.5319.1702. [DOI] [PubMed] [Google Scholar]
- 29.Cullen P J, Schultz J, Horecka J, Stevenson B J, Jigami Y, Sprague G F., Jr Genetics. 2000;155:1005–1018. doi: 10.1093/genetics/155.3.1005. [DOI] [PMC free article] [PubMed] [Google Scholar]
- 30.Freeman N L, Lila T, Mintzer K A, Chen Z, Pahk A J, Ren R, Drubin D G, Field J. Mol Cell Biol. 1996;16:548–556. doi: 10.1128/mcb.16.2.548. [DOI] [PMC free article] [PubMed] [Google Scholar]
- 31.Edgington N P, Blacketer M J, Bierwagen T A, Meyers A M. Mol Cell Biol. 1999;19:1369–1380. doi: 10.1128/mcb.19.2.1369. [DOI] [PMC free article] [PubMed] [Google Scholar]
- 32.Ahn S H, Tobe B T, Fitz Gerald J N, Anderson S L, Acurio A, Kron S J. Mol Biol Cell. 2001;12:3589–3600. doi: 10.1091/mbc.12.11.3589. [DOI] [PMC free article] [PubMed] [Google Scholar]


