Abstract
Recognition of stereotypic chemical patterns by sentinel cells of the innate immune system provokes a transient deviation from homeostasis, the acute-phase response (APR). Although APR effectors have been identified individually, the complexity of the response suggested that emergent properties would be uncovered by a more comprehensive examination. Our global assessment revealed that ≈7% of genes in the mouse are mobilized in the hepatic APR to endotoxin. Extensive metabolic adjustments include suppression of pathways for cholesterol, fatty acid, and phospholipid synthesis. Increased expression of genes for innate defense was accompanied by coordinate induction of the MHC class I antigen presentation machinery, illustrating an intersection between innate and adaptive immunity.
The immune responses of vertebrates arise from an interplay between acquired and innate defense mechanisms. Acquired immunity, which relies on the generation of antigen receptor diversity, arose with the acquisition of V(D)J recombination by jawed vertebrates some 450 million years ago (1). Innate immunity, in contrast, is a more ancient metazoan adaptation upon which acquired immunity was subsequently built (2, 3).
In higher metazoans, innate immune responses are initiated by chemical structures that are presented by invading microorganisms or revealed by damage to the host. These stereotypic shapes are detected by pattern recognition receptors, whose engagement can result in immediate activation of soluble defense factors, acquisition of specialized functions by sentinel cells, or production of proinflammatory cytokines (4).
The systemic inflammatory component of innate immunity, or the acute-phase response (APR), is a transient deviation from homeostasis, invoked when the integrity of the organism is breached. Lipopolysaccharide (LPS), for example, triggers the APR through an interaction with TLR-4, which is expressed on monocytes, macrophages, and dendritic cells (5, 6). These sentinel cells consequently produce IL-1β, tumor necrosis factor-α (TNFα), and IL-6, which activate or suppress expression of APR genes in hepatocytes, vascular endothelium, and other target cells (7, 8).
Many APR proteins fall within one of three broad groups: (i) anti-infectious agents, such as complement components, C-reactive protein (CRP), and serum amyloid P (SAP); (ii) proteins that promote increased breakdown of lipids and glycogen, fatty acid synthesis, and gluconeogenesis; and (iii) procoagulation factors (3, 7–9). Systemic inflammation is accompanied by an increase in triglyceride-rich lipoproteins, a reduction in high-density lipoprotein cholesterol, and impairment of cholesterol transport (9). These metabolic alterations, which promote atherosclerosis, may explain an epidemiologic link between chronic inflammation and cardiovascular disease (10).
Innate and acquired immunity are inseparable. Engagement of toll-like receptors induces immature dendritic cells to express the costimulatory ligands CD80 and CD86, whose activities are essential for nearly all acquired immune responses (4). Ablation of the gene for MyD88, a common component of TLR4 signaling cascades, interrupts induction of costimulatory molecules by bacterial products (11) and impairs T cell-mediated immunity (12). In the opposite direction, immunoglobulins produced by the acquired immune system can augment the ability of innate immune products, such as C3b, to stimulate uptake of microorganisms by phagocytic cells (13).
To delineate these relationships in a more comprehensive way, we have undertaken a genome-wide analysis of the hepatic inflammatory response to LPS in the mouse. Our observations document a coordinated adaptation to endotoxic challenge involving ≈7% of known genes and expressed sequence tags. Although many of the genes induced by LPS function in the recognition or effector arms of innate immunity, an extensive interface with the adaptive immune response is evident.
Materials and Methods
LPS Treatment.
Mice (129/SvJ × C57BL/6J), maintained in microisolator cages in a viral pathogen-free facility, were injected i.p. at 13–15 weeks of age with 100 μg of LPS (Escherichia coli strain 0111:B4, Difco) in 100 μl of saline as described (14). At various times after injection, mice were killed. Livers were harvested, frozen in liquid nitrogen, and stored at −140°C for future use.
RNA Isolation and Analysis.
Total RNA was extracted from livers of LPS-treated mice by using Trizol reagent (Molecular Research Center, Cincinnati). Poly(A) mRNA (total 1 μg), isolated by adsorption to oligo-dT-coated beads (Oligotex, Qiagen, Chatsworth, CA), was used as a template for synthesis of ds cDNA by using reverse transcriptase (Superscript II, Life Technologies, Rockville, MD) and a T7-(dT)24 primer. Biotin-labeled cRNA probes for array hybridization were transcribed from cDNA templates by using T7 RNA polymerase (Enzo Biochem).
For RT-PCR, total RNA (1 μg) was reverse transcribed by using AMV reverse transcriptase (Roche Molecular Biochemicals) and random hexameric primers. Reverse transcripts were amplified by the PCR. Sequences of oligonucleotide primers are provided in Table 1, which is published as supporting information on the PNAS web site, www.pnas.org.
Oligonucleotide Array Hybridization and Data Analysis.
Biotin-labeled cRNA probes were hybridized to oligonucleotide microarrays (mouse U74A v2; Affymetrix) containing 12,488 probe sets. Hybridization intensities (average differences) and assessments of the presence or absence of a given transcript (absolute call) were determined by using Affymetrix MICROARRAY SUITE.
Transcripts that were scored as present on at least one array were analyzed by using GENESPRING V.4.0 (Silicon Genetics, Redwood City, CA). The signal intensity of each of these probes was normalized to the median value of all intensities measured in the corresponding array, and then further normalized to the median of all array-normalized intensities determined for that gene over all hybridizations. Three sets of genes were selected for further study. A gene was included in the first set if (i) its normalized expression in LPS-treated samples deviated from expression in the untreated (t = 0 h) control by at least threefold at any of the time points tested, and (ii) its expression at any time point deviated from that of the untreated samples with a significance cut-off of P < 0.05 (Welch's approximate t test, applicable when samples were scored as present on two or more arrays in the control). A gene was included in the second set if it was absent from two or all control arrays but showed differential expression among the 3-, 6-, 12-, 24-, or 48-h samples with a significance cut-off of P < 0.05. A gene was included in the third set if any pairwise comparison of time points (0, 3, 6, 12, 24, and 48 h) was differential at P < 0.01, regardless of the magnitude of the difference. Hierarchical clustering (15) was performed by using the standard correlation coefficient as a distance metric.
In Situ Hybridization.
PCR-amplified segments of each gene to be assayed were cloned into pBluescript II SK(−) at the EcoRI site. Inserts were sequenced to confirm orientation. Sense and antisense RNA probes, tagged with biotin (Roche Molecular Biochemicals), were transcribed from the T7 or T3 promoters of linearized plasmids. Paraformaldehyde-fixed liver sections (5 μm) were hybridized to labeled probes overnight at 72°C. After hybridization, sections were incubated with an alkaline phosphatase-conjugated, anti-biotin antibody and developed as described (16).
Results and Discussion
A Global View of the Hepatic APR.
To provoke a systemic inflammatory response, 129/SvJ×C57BL/6 mice were injected i.p. with a sublethal dose of LPS, and liver RNA was harvested at various times up to 48 h. These RNA samples were hybridized to oligonucleotide arrays containing 12,488 oligonucleotide probe sets, each representing an expressed gene. Therefore, the arrays represented roughly one-third of the protein coding capacity of the mouse genome. The time-course experiment was replicated three times by using probes from independently injected mice.
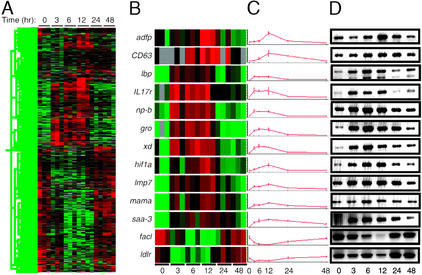
Of 8,551 markers scored as present at one or more time points, 898 genes, or ≈7% of the markers assayed, were scored as LPS-responsive by criteria described in Materials and Methods. Assuming that the sample is representative, this observation suggests that between 5% and 10% of the protein-encoding portion of the mouse genome is mobilized in response to a single inflammatory stimulus. The LPS-responsive gene set was ordered by hierarchical clustering, by using the standard correlation coefficient as a distance metric (Fig. 1A). Most genes exhibit a single upward or downward wave of expression over the time of observation; the number of up-regulated genes is similar to the number of genes whose expression is suppressed. Several kinetic patterns are appreciable. One group of genes exhibits a maximal deviation from baseline at 3–6 h after treatment. A second group shows a slightly later response that peaks at about 12 h. A third group, consisting principally of induced genes, shows a more protracted time course, responding maximally by 12–24 h.
Figure 1.
A global transcriptional view of the APR in the mouse. (A) The transcript levels of 898 genes met criteria for significant change in response to LPS administration. These genes were clustered hierarchically, based on the similarity of their expression profiles. Time after LPS administration is indicated at top. Each column represents data from an individual microarray. Red represents expression above and green represents expression below the median value; black represents expression at the median, and gray represents no detectable expression. (B–D) Confirmation of LPS-induced changes in gene expression by RT-PCR. (B) Expression data, coded as in A, from individual oligonucleotide microarrays for the markers listed at left. (C) Normalized hybridization intensities for the markers displayed in B, plotted as a function of time. Each point represents the mean of values obtained from three microarrays. (D) Total liver RNA from LPS-treated animals was reverse transcribed and used as a template for amplification of the transcripts indicated in B. Products were detected with ethidium bromide. Time (hr) after LPS treatment is indicated at bottom. Markers are described in the text.
The results obtained by microarray analysis were confirmed by RT-PCR for 11 genes that were induced by LPS-encoding adipose differentiation-related protein (Adfp), LAMP-3 (CD63), LPS-binding protein (Lbp), the IL-17 receptor (IL17r), purine-nucleoside phosphorylase (Np-b), the chemokine CXCL1 (Gro), xanthine dehydrogenase (Xd), hypoxia-inducible factor-1α (Hif1a), the proteasome subunit Lmp7 (Lmp7), the murine adherent macrophage receptor (Mama), and serum amyloid A-3 (Saa-3) and two genes that were suppressed by LPS encoding long-chain fatty acyl Co-A synthase (Facl) and low-density lipoprotein (LDL) receptor (Ldlr; Fig. 1 B–D). For all 13 markers, the expression patterns defined by using RT-PCR (Fig. 1D) were similar to those observed by microarray (Fig. 1 B and C).
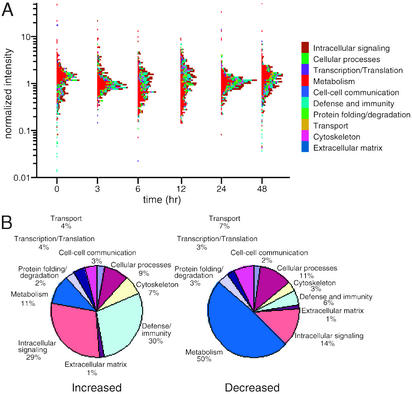
Of the 898 genes in the LPS-responsive set, 489 encode proteins of known function; these were sorted into 10 functional categories (Fig. 2), as defined by the Gene Ontology Consortium (www.geneontology.org). The three categories of defense and immunity, intracellular signaling, and metabolism account for 69% of the LPS-responsive genes. The genes in these groups, moreover, exhibit substantial biases with respect to the directionality of response. A reciprocal kinetic relationship is observed between the responses of metabolic genes and host defense genes, with maximal displacement at 6–12 h (Fig. 2A). Genes with direct roles in defense and immunity or intracellular signaling comprise 59% of the LPS-induced set but only 20% of the down-regulated group (Fig. 2B). In contrast, genes with functions in intermediary metabolism make up 50% of the set whose expression is suppressed by LPS, but only 11% of the induced group (Fig. 2B).
Figure 2.
Functional profiles of LPS-responsive genes expressed in liver. (A) Temporal variation in expression of individual transcripts, classed by function. Each gene was assigned to a single functional category as defined by the Gene Ontogeny Consortium and determined by interrogation of PubMed, Unigene, and SwissProt databases. These categories and associated color codes are listed at right. Normalized hybridization intensities, averaged over three microarrays, are plotted logarithmically for the indicated times after LPS administration. (B) Proportional representation of each functional category among LPS-responsive genes whose expression increased (Left) or decreased (Right) in response to LPS.
Effects on Genes of Lipid and Cholesterol Metabolism.
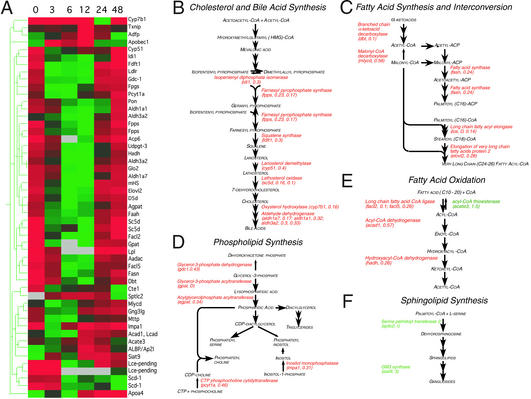
Examination of LPS-responsive markers provides insight into the widespread changes in lipid metabolism that accompany the APR (17). At least 51 effectors of lipid metabolism were observed to undergo significant alterations in expression (Fig. 3A). Metabolic pathways for fatty acid synthesis, phospholipid synthesis, fatty acid oxidation, bile acid synthesis, and later stages of cholesterol synthesis were coordinately down-regulated (Fig. 3 B–E). Expression of all but one of the LPS-responsive genes residing on these pathways was reduced; increased expression of the exceptional marker, acetyl CoA thioesterase, is expected to reinforce suppression of fatty acid oxidation (Fig. 3E). In contrast, and consistent with previous reports (18, 19), increased expression of sphingolipid and ganglioside synthetic genes was observed (Fig. 3F).
Figure 3.
Effects of LPS on genes of lipid and cholesterol metabolism. (A) Genes meeting criteria for inclusion in the LPS-responsive set with functions in lipid or cholesterol metabolism were clustered hierarchically. Each column represents the set of normalized hybridization intensities at the time point indicated above in hr, averaged over three microarrays. Markers are indicated at right. Signal intensities are represented as defined in Fig. 1. (B–F) Functional mapping of LPS-responsive genes to pathways for cholesterol and bile acid synthesis (B), fatty acid synthesis and interconversion (C), phospholipid synthesis (D), fatty acid oxidation (E), and sphingolipid synthesis (F). The name of each gene product is given in italics, followed in parentheses by the gene name as in A and the maximum fold change in transcript level after LPS treatment. D indicates a decrease in expression to an undetectable level; I indicates that expression increased from a level undetectable at 0 h. Genes whose expression increased in response to LPS are listed in green; those whose expression decreased are listed in red. Pathways are as defined at the SwissProt database link (http://www.expasy.ch/cgi-bin/search-biochem-index) to metabolic pathways.
The observed alterations in cholesterol metabolism are of particular interest. Whereas the APR is accompanied by a transient increase in the level of LDL cholesterol (20), analysis of cholesterol metabolism has suggested a discordance (21), in which transcription of HMG-CoA reductase is elevated (20) in the absence of increased expression of downstream enzymes (22). Our observations (Fig. 3B), however, document coordinate decreases in the levels of mRNA for isopentenyl diphosphate isomerase (idi1), farnesyl pyrophosphate synthase (fpps), squalene synthase (fdft1), lanosterol demethylase (cyp51), and lathosterol oxidase (sc5d); the levels of HMG-CoA reductase mRNA were variable and did not meet our test for statistical significance. Similar reductions in lathosterol oxidase and lanosterol demethylase mRNA may contribute to the increased lanosterol:cholesterol ratio observed in patients experiencing an APR to myocardial infarction (23). Although this has been interpreted to reflect increased cholesterol biosynthesis, our data suggest that flux through this pathway downstream of mevalonate is decreased.
Our observations support the view that the inflammatory increase in serum cholesterol reflects reductions in cholesterol uptake and conversion of cholesterol to bile acids. Within 3 h after administration of LPS, the level of ldlr mRNA was decreased at least fourfold (Fig. 3A and Fig. 1D). Diminished ldlr expression is expected to reduce serum cholesterol clearance, as availability of LDL receptors is the principal determinant of serum LDL half-life (24). LPS administration was followed by reductions in mRNA for aldehyde dehydrogenase isoforms (aldh1a1, aldh1a7, and aldh3a2), with roles in bile acid synthesis (Fig. 3B). LPS reduces expression of cholesterol 7α-hydroxylase (cyp7a), the initial enzyme in the classical pathway of bile acid synthesis (25); our measurements (transcripts present at 0, 24, and 48 h but absent at 3, 6, and 12 h; see Table 2, which is published as supporting information on the PNAS web site) were consistent, but did not meet criteria for inclusion of cyp7a in the LPS-responsive set. We did find, however, that transcripts encoding oxysterol 7α-hydroxylase (cyp7b), an alternative enzyme of bile acid synthesis (26), were reduced after LPS treatment (Fig. 3B). Together, these changes are consistent with a decrease in the consumption of cholesterol for bile acid synthesis, which could also contribute to increased serum cholesterol levels (27).
The elevation in serum triglyceride levels characteristic of the APR has been ascribed to increased synthesis, decreased clearance, or both (9). Our observations do not support increased endogenous production as a cause of this elevation: the mRNA levels for a number of fatty acid synthetic enzymes were decreased in response to LPS (Fig. 3C), as were the mRNA levels for glycerol-3-phosphate acyltransferase (gpat) and acylglycerolphosphate acyltransferase (agpat), which act sequentially in the synthesis of triglyceride precursors (Fig. 3D). In contrast, the expression data presented here support decreased clearance as an underlying mechanism, as mRNA for lipoprotein lipase (lp1), which plays a critical role in the cellular uptake of triglycerides, was reduced to undetectable levels by 6 h after LPS administration; reductions in lipoprotein lipase levels during an APR have been documented (28). The expression of genes for fatty acid oxidation is simultaneously decreased (Fig. 3 A and E); it is not clear whether down-regulation of this pathway contributes to the alterations in serum triglyceride levels previously described, or whether it is a consequence of decreased fatty acid uptake.
An Interface Between Innate and Adaptive Immunity.
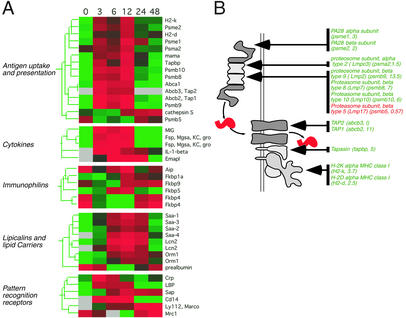
At least 58 genes with direct roles in host defense showed significant changes in expression in response to LPS (see Table 3, which is published as supporting information on the PNAS web site). Several classical APR markers were classed in this group, including serum amyloid A (SAA) proteins and other lipocalins (Fig. 4A). The innate response is self-reinforcing over a limited period after its induction by LPS, as evidenced by the sustained elevation of IL-1β expression during the first 6 h, marked increases in mRNA for IL-1β receptors type 1 and 2 (15- and 3-fold, respectively), and the later induction of pattern recognition receptors such as C-reactive protein (CRP), CD14, Lbp, Ly112, and serum amyloid P (SAP) (Fig. 4A).
Figure 4.
A functional intersection between systemic inflammation and acquired immunity. (A) LPS-responsive genes encoding components of the antigen presentation machinery, cytokines, immunophilins, lipid carriers, and pattern recognition molecules were ordered hierarchically and displayed as described in Fig. 4. (B) Functional mapping of LPS-responsive genes to a pathway for processing and presentation of endogenous antigens by MHC class I. The diagram represents the proteolytic processing of an antigenic peptide, its transport from the cytosol, and its association with an MHC class I molecule. LPS-responsive components of the machinery are listed, with abbreviated gene names and fold change in parentheses, as in Fig. 4. For details, see text.
In livers of LPS-treated mice, we observed coordinate induction of genes whose products act in concert to present endogenous antigens (Fig. 4). This wave of increased expression, sustained between 3 and 12 h after LPS administration, included genes for the specialized proteasome components LMP2 (psmb9), LMP7 (psmb8), LMP10 (psmb10), PA28α (psme1), and PA28β (psme2); the peptide transporter components Tap1 (abcb2) and Tap2 (abcb3); the accessory protein tapasin (tapbp); and MHC class II proteins (H2-k, H2-d; Fig. 4 A and B). Transcripts for the constitutive proteasome α-subunit 2 (psma2) were also increased, albeit slightly (Fig. 4 A and B). In contrast, the standard proteasome subunit LMP17 (psmb5), which is displaced during assembly of the specialized apparatus (29), was modestly down-regulated (Fig. 4B).
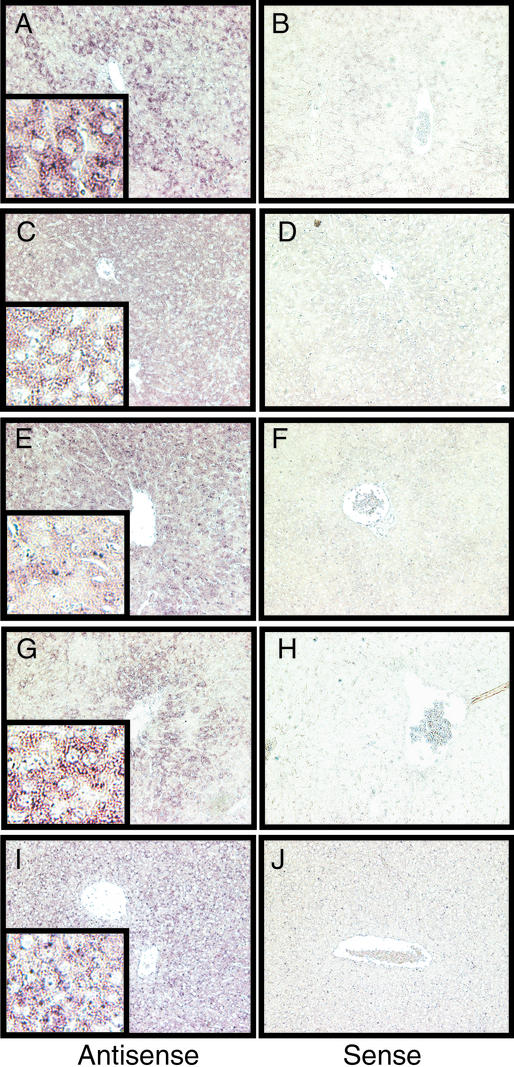
Similar changes in the expression of genes participating in MHC class I antigen presentation are observed in dendritic cells after treatment with LPS (30). Although hepatocytes account for ≈80% of liver volume, nonparenchymal cells make up ≈40% of the total cellularity (31). We asked whether the LPS-induced expression of antigen-presentation machinery in liver reflected the activity of hepatic parenchymal cells. Mice were injected i.p. with 100 μg of LPS and gene-specific transcripts were localized in liver sections by in situ hybridization (Fig. 5). Tapasin (tapbp), which has been shown to be coordinately regulated with other components of the pathway (32), was tested as a representative of the MHC class I antigen presentation machinery.
Figure 5.
Detection of tapasin transcripts in hepatic parenchymal cells of LPS-treated mice. Livers were harvested 3 h (A–F, I, and J) or 6 h (G and H) after i.p. injection of 100 μg of LPS. Sections (5 μm) were hybridized to antisense (A, C, E, G, and I) or sense (B, D, F, H, and J) probes specific for saa-3 (A and B), np-b (C and D), sap (E and F), lbp (G and H), or tapbp (tapasin; I and J). Magnification: main panels, ×200; Insets, ×800.
The distribution of tapasin transcripts was compared with that of three acute-phase markers whose expression is induced in hepatocytes (33–35): saa-3, lbp, and sap. In addition, we examined transcripts for np-b, whose levels are increased upon hepatocellular damage (36). Antisense hybridization to tapasin transcripts was detected in hepatocytes of endotoxin-treated mice (Fig. 5I); specificity was confirmed by using a sense probe (Fig. 5J). The reference markers, as expected, were also expressed predominantly in hepatocytes, although their patterns were not identical: saa-3, sap, and np-b were broadly distributed (Fig. 5 A–F), whereas lbp showed a propensity for expression in perisinusoidal hepatocytes (Fig. 5 G and H). We conclude that hepatocytes are a principal source of the tapasin transcripts we detected in LPS-treated mouse liver, although our observations do not exclude nonparenchymal sources, such as dendritic cells or macrophages.
Systemic inflammation is accompanied by the intrahepatic accumulation of activated CD8+ T cells (37, 38); local antigen presentation regulates this process (39). Previous studies have suggested that the antigen presenting capacity of hepatocytes may be modulated by infection. In a rodent hepatitis model, acute infection is accompanied by increased expression of MHC class I protein and increased levels of Tap 1 and Tap 2 mRNA (40). We have now shown that transcripts for all major components of the MHC class I-specific antigen presentation pathway accumulate in liver in response to LPS.
Although the analysis presented here does not distinguish between increased initiation of transcription and increased mRNA stability, it is important to note that all of the LPS-responsive transcripts in this group, except for the modestly induced transcripts for the constitutive proteasome α-subunit 2, are known to be regulated by IFN-γ (41–44). The local release of IFN-γ in liver, under the control of intrahepatic dendritic cells, is a prominent feature of systemic innate immune responses (45). Moreover, the modifications of MHC class I antigen presentation induced by IFN-γ are mediated principally by Stat1 (46, 47), whose expression was increased by more than 6-fold in response to LPS (see Table 3). Taken together, our results illustrate a point of intersection between innate and acquired immunity and suggest that mobilization of antigen presentation by hepatocytes through MHC class I is an intrinsic feature of the APR.
Supplementary Material
Acknowledgments
Microarray hybridization and scanning were performed by the Center for Cancer Research–Howard Hughes Medical Institute Biopolymers Laboratory at the Massachusetts Institute of Technology. This work was supported by the Howard Hughes Medical Institute.
Abbreviations
- APR
acute-phase response
- LPS
lipopolysaccharide
- Lbp
LPS-binding protein
- LDL
low-density lipoprotein
Footnotes
This paper was submitted directly (Track II) to the PNAS office.
References
- 1. Schatz, D. G. (1999) Immunol. Res.19. [DOI] [PubMed]
- 2.Medzhitov R, Janeway C A., Jr Science. 2002;296:298–300. doi: 10.1126/science.1068883. [DOI] [PubMed] [Google Scholar]
- 3.Bayne C J, Gerwick L. Dev Comp Immunol. 2001;25:725–743. doi: 10.1016/s0145-305x(01)00033-7. [DOI] [PubMed] [Google Scholar]
- 4.Medzhitov R. Nat Rev Immunol. 2001;1:135–145. doi: 10.1038/35100529. [DOI] [PubMed] [Google Scholar]
- 5.Kadowaki N, Ho S, Antonenko S, Malefyt R W, Kastelein R A, Bazan F, Liu Y J. J Exp Med. 2001;194:863–869. doi: 10.1084/jem.194.6.863. [DOI] [PMC free article] [PubMed] [Google Scholar]
- 6.Medzhitov R, Preston-Hurlburt P, Janeway C A., Jr Nature. 1997;388:394–397. doi: 10.1038/41131. [DOI] [PubMed] [Google Scholar]
- 7.Gabay C, Kushner I. N Engl J Med. 1999;340:448–454. doi: 10.1056/NEJM199902113400607. [DOI] [PubMed] [Google Scholar]
- 8.Ramadori G, Christ B. Semin Liver Dis. 1999;19:141–155. doi: 10.1055/s-2007-1007106. [DOI] [PubMed] [Google Scholar]
- 9.Khovidhunkit W, Memon R A, Feingold K R, Grunfeld C. J Infect Dis. 2000;181, Suppl. 3:S462–S472. doi: 10.1086/315611. [DOI] [PubMed] [Google Scholar]
- 10.Ross R. New Engl J Med. 1999;340:115–126. doi: 10.1056/NEJM199901143400207. [DOI] [PubMed] [Google Scholar]
- 11.Kawai T, Adachi O, Ogawa T, Takeda K, Akira S. Immunity. 1999;11:115–122. doi: 10.1016/s1074-7613(00)80086-2. [DOI] [PubMed] [Google Scholar]
- 12.Schnare M, Barton G M, Holt A C, Takeda K, Akira S, Medzhitov R. Nat Immunol. 2001;2:947–950. doi: 10.1038/ni712. [DOI] [PubMed] [Google Scholar]
- 13.Fries L F, Siwik S A, Malbran A, Frank M M. Immunology. 1987;62:45–51. [PMC free article] [PubMed] [Google Scholar]
- 14.Yoo J Y, Huso D L, Nathans D, Desiderio S. Cell. 2002;108:331–344. doi: 10.1016/s0092-8674(02)00636-0. [DOI] [PubMed] [Google Scholar]
- 15.Eisen M B, Spellman P T, Brown P O, Botstein D. Proc Natl Acad Sci USA. 1998;95:14863–14868. doi: 10.1073/pnas.95.25.14863. [DOI] [PMC free article] [PubMed] [Google Scholar]
- 16.Schaeren-Wiemers N, Gerfin-Moser A. Histochemistry. 1993;1993:431–440. doi: 10.1007/BF00267823. [DOI] [PubMed] [Google Scholar]
- 17.Hardardottir I, Grunfeld C, Feingold K R. Biochem Soc Trans. 1995;23:1013–1018. doi: 10.1042/bst0231013. [DOI] [PubMed] [Google Scholar]
- 18.Memon R A, Holleran W M, Moser A H, Seki T, Uchida Y, Fuller J, Shigenaga J K, Grunfeld C, Feingold K R. Arterioscler Thromb Vasc Biol. 1998;18:1257–1265. doi: 10.1161/01.atv.18.8.1257. [DOI] [PubMed] [Google Scholar]
- 19.Memon R A, Holleran W M, Uchida Y, Moser A H, Ichikawa S, Hirabayashi Y, Grunfeld C, Feingold K R. J Biol Chem. 1999;274:19707–19713. doi: 10.1074/jbc.274.28.19707. [DOI] [PubMed] [Google Scholar]
- 20.Feingold K R, Hardardottir I, Memon R, Krul E J, Moser A H, Taylor J M, Grunfeld C. J Lipid Res. 1993;34:2147–2158. [PubMed] [Google Scholar]
- 21.Feingold K R, Pollock A S, Moser A H, Shigenaga J K, Grunfeld C. J Lipid Res. 1995;36:1474–1482. [PubMed] [Google Scholar]
- 22.Memon R A, Shechter I, Moser A H, Shigenaga J K, Grunfeld C, Feingold K R. J Lipid Res. 1997;38:1620–1629. [PubMed] [Google Scholar]
- 23.Pfohl M, Schreiber I, Liebich H M, Haring H U, Hoffmeister H M. Atherosclerosis. 1999;142:389–393. doi: 10.1016/s0021-9150(98)00242-1. [DOI] [PubMed] [Google Scholar]
- 24.Goldstein J L, Hobbs H H, Brown M S. In: The Metabolic and Molecular Bases of Inherited Disease. Scriver C R, Beaudet A L, Sly W S, Valle D, editors. Vol. 2. New York: McGraw–Hill; 1995. pp. 1981–2030. [Google Scholar]
- 25.Feingold K R, Spady D K, Pollock A S, Moser A H, Grunfeld C. J Lipid Res. 1996;37:223–228. [PubMed] [Google Scholar]
- 26.Schwarz M, Lund E G, Russell D W. Curr Opin Lipidol. 1998;9:113–118. doi: 10.1097/00041433-199804000-00006. [DOI] [PubMed] [Google Scholar]
- 27.Memon R A, Moser A H, Shigenaga J K, Grunfeld C, Feingold K R. J Biol Chem. 2001;276:30118–30126. doi: 10.1074/jbc.M102516200. [DOI] [PubMed] [Google Scholar]
- 28.Feingold K R, Memon R A, Moser A H, Shigenaga J K, Grunfeld C. Atherosclerosis. 1999;142:379–387. doi: 10.1016/s0021-9150(98)00265-2. [DOI] [PubMed] [Google Scholar]
- 29.Akiyama K, Kagawa S, Tamura T, Shimbara N, Takashina M, Kristensen P, Hendil K B, Tanaka K, Ichihara A. FEBS Lett. 1994;343:85–88. doi: 10.1016/0014-5793(94)80612-8. [DOI] [PubMed] [Google Scholar]
- 30.Macagno A, Gilliet M, Sallusto F, Lanzavecchia A, Nestle F O, Groettrup M. Eur J Immunol. 1999;29:4037–4042. doi: 10.1002/(SICI)1521-4141(199912)29:12<4037::AID-IMMU4037>3.0.CO;2-T. [DOI] [PubMed] [Google Scholar]
- 31.Kmiec Z. Adv Anat Embryol Cell Biol. 2001;161:1–151. doi: 10.1007/978-3-642-56553-3. [DOI] [PubMed] [Google Scholar]
- 32.MacAry P A, Lindsay M, Scott M A, Craig J I, Luzio J P, Lehner P J. Proc Natl Acad Sci USA. 2001;98:3982–3987. doi: 10.1073/pnas.071477498. [DOI] [PMC free article] [PubMed] [Google Scholar]
- 33.Lowell C A, Stearman R S, Morrow J F. J Biol Chem. 1986;261:8453–8461. [PubMed] [Google Scholar]
- 34.Wan Y, Freeswick P D, Khemlani L S, Kispert P H, Wang S C, Su G L, Billiar T R. Infect Immun. 1995;63:2435–2442. doi: 10.1128/iai.63.7.2435-2442.1995. [DOI] [PMC free article] [PubMed] [Google Scholar]
- 35.Le P T, Mortensen R F. J Immunol. 1986;136:2526–2533. [PubMed] [Google Scholar]
- 36.Rao P N, Walsh T R, Makowka L, Rubin R S, Weber T, Snyder J T, Starzl T E. Hepatology. 1990;11:193–198. doi: 10.1002/hep.1840110206. [DOI] [PMC free article] [PubMed] [Google Scholar]
- 37.Huang L, Soldevila G, Leeker M, Flavell R A, Crispe I N. Immunity. 1994;1:741–749. doi: 10.1016/s1074-7613(94)80016-2. [DOI] [PubMed] [Google Scholar]
- 38.Belz G T, Altman J D, Doherty P C. Proc Natl Acad Sci USA. 1998;95:13812–13817. doi: 10.1073/pnas.95.23.13812. [DOI] [PMC free article] [PubMed] [Google Scholar]
- 39.Mehal W Z, Azzaroli F, Crispe I N. J Immunol. 2001;167:667–673. doi: 10.4049/jimmunol.167.2.667. [DOI] [PubMed] [Google Scholar]
- 40.Michalak T I, Hodgson P D, Churchill N D. J Virol. 2000;74:4483–4494. doi: 10.1128/jvi.74.10.4483-4494.2000. [DOI] [PMC free article] [PubMed] [Google Scholar]
- 41.Boes B, Hengel H, Ruppert T, Multhaup G, Koszinowski U H, Kloetzel P M. J Exp Med. 1994;179:901–909. doi: 10.1084/jem.179.3.901. [DOI] [PMC free article] [PubMed] [Google Scholar]
- 42.Fruh K, Gossen M, Wang K, Bujard H, Peterson P A, Yang Y. EMBO J. 1994;13:3236–3244. doi: 10.1002/j.1460-2075.1994.tb06625.x. [DOI] [PMC free article] [PubMed] [Google Scholar]
- 43.White L C, Wright K L, Felix N J, Ruffner H, Reis L F, Pine R, Ting J P. Immunity. 1996;5:365–376. doi: 10.1016/s1074-7613(00)80262-9. [DOI] [PubMed] [Google Scholar]
- 44.Abarca-Heidemann K, Friederichs S, Klamp T, Boehm U, Guethlein L A, Ortmann B. Immunol Lett. 2002;83:197–207. doi: 10.1016/s0165-2478(02)00104-9. [DOI] [PubMed] [Google Scholar]
- 45.Trobonjaca Z, Leithauser F, Moller P, Schirmbeck R, Reimann J. J Immunol. 2001;167:1413–1422. doi: 10.4049/jimmunol.167.3.1413. [DOI] [PubMed] [Google Scholar]
- 46.Chatterjee-Kishore M, Wright K L, Ting J P, Stark G R. EMBO J. 2000;19:4111–4122. doi: 10.1093/emboj/19.15.4111. [DOI] [PMC free article] [PubMed] [Google Scholar]
- 47.Min W, Pober J S, Johnson D R. J Immunol. 1996;156:3174–3183. [PubMed] [Google Scholar]
Associated Data
This section collects any data citations, data availability statements, or supplementary materials included in this article.


