

Abstract
The endocycle is a variant cell cycle comprised of alternating gap (G) and DNA synthesis (S) phases (endoreplication) without mitosis (M), which results in DNA polyploidy and large cell size. Endocycles occur widely in nature, but much remains to be learned about the regulation of this modified cell cycle. Here, we compared gene expression profiles of mitotic cycling larval brain and disc cells with the endocycling cells of fat body and salivary gland of the Drosophila larva. The results indicated that many genes that are positively regulated by the heterodimeric E2F1–DP or Myb–MuvB complex transcription factors are expressed at lower levels in endocycling cells. Many of these target genes have functions in M phase, suggesting that dampened E2F1 and Myb activity promote endocycles. Many other E2F1 target genes that are required for DNA replication were also repressed in endocycling cells, an unexpected result given that these cells must duplicate up to thousands of genome copies during each S phase. For some EF2-regulated genes, the lower level of mRNA in endocycling cells resulted in lower protein concentration, whereas for other genes it did not, suggesting a contribution of post-transcriptional regulation. Both knockdown and overexpression of E2F1–DP and Myb–MuvB impaired endocycles, indicating that transcriptional activation and repression must be balanced. Our data suggest that dampened transcriptional activation by E2F1–DP and Myb–MuvB is important to repress mitosis and coordinate the endocycle transcriptional and protein stability oscillators.
Keywords: Drosophila, E2F1, Endocycle, Myb
Introduction
The events of the cell division cycle are exquisitely controlled by a large number of interconnected regulatory pathways (Hochegger et al., 2008; Santos and Ferrell, 2008). Cell proliferation is also regulated by developmental pathways, which can result in variations on the canonical cell cycle program. It is important to uncover how these themes and variations in the cell cycle are regulated to achieve a deeper understanding of development and disease.
One common cell cycle variation is the endocycle, which is comprised of alternating Gap (G) and DNA synthesis (S) phases without a mitotic (M) phase or cytokinesis (Lee et al., 2009; Ullah et al., 2009). Cells switch from the canonical cell division program to endocycles in response to developmental cues. Subsequent G–S endocycle oscillations result in duplication of the genome each endocycle S phase, a process termed endoreplication (Edgar and Orr-Weaver, 2001). This regulated and periodic genome duplication is distinct from the aberrant process of DNA re-replication that results from the continuous re-initiation of DNA replication from origins during a single cell cycle (Arias and Walter, 2007; Hong et al., 2007; Lilly and Spradling, 1996; Mehrotra et al., 2008). Repeated endoreplication of the genome during G–S endocycles eventually leads to high levels of DNA polyploidy and large cell size, which supports the biosynthetic and other functions of these cells. Endocycles are widespread in nature, from single-celled organisms to humans, yet many questions remain regarding the regulation of periodic G–S endocycle oscillations and the execution of DNA endoreplication (Lee et al., 2009).
The endocycle has been extensively studied in Drosophila melanogaster where cells of many tissues switch to the endocycle (Lee et al., 2009; Painter and Reindorp, 1939; Smith and Orr-Weaver, 1991). Results from Drosophila and other organisms suggest that the endocycle oscillator is a modified version of the mitotic cell cycle. This endocycle oscillator is engaged when developmental signals repress functions required for mitosis at both transcriptional and post-transcriptional levels (Narbonne Reveau et al., 2008; Schaeffer et al., 2004; Shcherbata et al., 2004; Sigrist and Lehner, 1997; Sun and Deng, 2007; Zielke et al., 2008). The master regulator of the ensuing endocycle oscillations is Cyclin E (CycE) protein, whose periodic production activates cyclin-dependent kinase 2 (CDK2) and promotes entry into the endocycle S phase (Calvi et al., 1998; Knoblich et al., 1994; Lilly and Spradling, 1996; Sauer et al., 1995). The periodic transcription of CycE at G–S is governed by the dimeric transcription factor E2F1–DP, a central component of the endocycle transcriptional oscillator (Duronio and O'Farrell, 1995; Dynlacht et al., 1994; Sauer et al., 1995; van den Heuvel and Dyson, 2008). This leads to a E2F1–CycE positive-feedback loop wherein rising CycE–CDK2 activity phosphorylates the fly orthologs of retinoblastoma proteins (RBF1 and RBF2), relieving their repression on E2F1–DP (Du et al., 1996; Weng et al., 2003). The resulting increase in E2F1–DP activity leads to higher levels of CycE and also induces the transcription of a cadre of other E2F1 target genes whose protein products are required for DNA replication (Cayirlioglu et al., 2003; Dimova et al., 2003; van den Heuvel and Dyson, 2008). The CycE–CDK2 promotion of S phase also results in a negative-feedback loop wherein E2F1 is degraded via PCNA-dependent proteolysis (Shibutani et al., 2008). CycE–CDK2 activity is then downregulated at the end of S phase by rising levels of Dacapo, the Drosophila ortholog of the p27 cyclin-dependent kinase inhibitor (CKI), and also by the ubiquitin-mediated destruction of CycE protein (de Nooij et al., 2000; Hong et al., 2007; Ohlmeyer and Schupbach, 2003; Sauer et al., 1995; Szuplewski et al., 2009).
The only other E2F family member in Drosophila, E2F2, also binds the single Drosophila DP protein and represses the transcription of cell cycle and differentiation genes (Dimova et al., 2003; Frolov et al., 2001; Sawado et al., 1998). E2F2 functions as part of a larger, evolutionarily conserved complex called Myb–MuvB, or dREAM, whose core subunits include Myb, RBF1, RBF2 and others (Korenjak et al., 2004; Lewis et al., 2004). Although Myb–MuvB represses transcription at most promoters, it can activate it at others (Georlette et al., 2007). Compromising repression mediated by E2F2 and RBF1 can lead to constitutively high levels of CycE and other replication proteins, which can alter or completely block endocycle progression (Cayirlioglu et al., 2001; Cayirlioglu et al., 2003; Weng et al., 2003). Current evidence suggests that oscillating CDK activity is important to regulate cdh1-dependent anaphase-promoting complex (APCcdh1) and define alternating periods that are permissive for either the licensing or the activation of origins of DNA replication, resulting in genome duplication only once per endocycle (Arias and Walter, 2007; Hong et al., 2007; Narbonne Reveau et al., 2008; Su and O'Farrell, 1998; Zielke et al., 2008). This general endocycle theme might be conserved to mammals, where oscillating levels of CycE, APCcdh1 and the CKI p57 are central regulators of endocycles of the giant trophoblast cells in the placenta (Hattori et al., 2000; Ullah et al., 2008; Ullah et al., 2009). It is not fully understood, however, how endocycle regulatory feedback loops achieve this precise balance of transcriptional regulation and proteolysis, and whether it is different to that in mitotic division cycles.
Although many aspects of endocycle regulation appear to be a modified version of the mitotic cycle program, other evidence suggests important differences. In response to incomplete DNA replication or DNA damage, endocycle cells do not engage checkpoints that restrain cell cycle progression, nor do they activate apoptosis (Lilly and Spradling, 1996; Mehrotra et al., 2008). A number of other studies have suggested that some endocycling cells are less sensitive to depletion of essential replication proteins such as those of the origin recognition complex (ORC) and minichromosome maintenance (MCM) helicase complex (Feger et al., 1995; Lake et al., 2007; Park and Asano, 2008; Treisman et al., 1995). There might be fundamental differences, therefore, between mitotic cycling and endocycling cells in the core cell cycle oscillator and the execution of DNA replication.
In this study, we used expression microarrays as an entry point to gain further insight into the differences between mitotic cycling and endocycling cells in tissues of the Drosophila larva. We found that many genes that are regulated positively by Myb–MuvB and that function in mitosis were expressed at lower levels in endocycles, suggesting that reduced Myb function represses mitosis and enforces endocycles. E2F1 target genes that function in S phase were also expressed at lower levels in endocycling cells, a surprising finding given the high DNA copy number in these polyploid cells. However, only some of the proteins encoded by these genes were lower in endocycling cells, suggesting the contribution of post-transcriptional regulation. Knockdown and overexpression of E2F1 or Myb–MuvB complex subunits impaired endoreplication, implying that the balance of transcriptional repression and activation by these protein complexes is crucial. In the context of recent results from other groups, we propose that dampened Myb–MuvB and E2F1–DP activity during endocycles is important to repress mitosis and apoptosis, and to coordinate the endocycle transcriptional and protein stability oscillators.
Results
Microarray analysis of endocycling and mitotic cycling cells
Cells in a large number of Drosophila tissues switch from the mitotic cycle to the endocycle at specific developmental times. Indeed, most of the tissues of the Drosophila larva are comprised of cells in the endocycle, with larval growth occurring mostly through an increase in cell size and not cell number. This includes the larval fat body and salivary gland, which attain a maximum final ploidy of ~256C and ~2012C, respectively (Berendes and Ashburner, 1978; Butterworth and Rasch, 1986; Hammond and Laird, 1985). Other larval cells, however, proliferate by a canonical mitotic division cycle, including those of the brain and imaginal discs, which are the precursors to adult structures (Neufeld et al., 1998). To gain insight into endocycle regulation, we compared the mRNA steady state level between these mitotic cycling and endocycling cells of the larva by two-color hybridization to the DGRC-2 expression arrays, which contain oligos representing 93% of the annotated genes from Drosophila genome release 4.3 (https://dgrc.cgb.indiana.edu/microarrays/) (Bogart et al., 2006). To minimize developmental differences due to one particular tissue type, we used several tissues for mitotic cycling and endocycling samples. For mitotic cycling cells, we combined tissue from larval brain and multiple imaginal discs (B-D). For endocycling tissues, we used either salivary gland (Sg) or fat body (Fb). We hand-dissected these tissues from feeding-stage, early third-instar larvae, a time when cells in all these tissues are actively cycling, which we confirmed by BrdU labeling (data not shown) (Pierce et al., 2004). We compared the B-D mRNA steady state level separately with that from either Sg or Fb by two-color array hybridization. Array spot fluorescent intensity was normalized to total fluorescent signal in that channel, and the ratio of steady state mRNA levels between Fb and B-D (Fb/B-D), and Sg and B-D (Sg/B-D) was estimated in two and three biological replicates, respectively, for a total of five comparisons. Differentially expressed genes were defined as those with at least a twofold difference in mean expression between tissues in the Fb/B-D or Sg/B-D comparisons. This set was filtered further for those genes whose estimated mean expression in the two tissues differed with P≤0.05 by ANOVA (Fisher, 1921). Among the ~5000 genes whose expression was detected, 28% in the Sg/B-D comparison and 16% in the Fb/B-D comparison were differentially expressed between endocycle and mitotic cycle samples (±twofold and P≤0.05) (Fig. 1A and Table 1).
Fig. 1.

Gene expression differences between endocycling and mitotic cycling cells. (A) Summary of microarray gene expression ratios comparing endocycling salivary gland (Sg) or fat body (Fb) to mitotic cycling brain-disc (B-D). The number of genes with expression Sg/B-D or Fb/B-D ratios of +twofold or greater (red), or twofold lower or less (green) expression and P≤0.05 are indicated. Yellow indicates genes that did not significantly differ in expression by at least twofold or had P>0.05. (B) Scatter plot of Sg/B-D log2 ratio versus Fb/B-D ratio for all genes. The heat-color of each spot reflects the fold change in Sg/B-D ratio on the x axis. The boxes indicate those genes whose expression differed by at least twofold (log2 ≥+1 or ≤–1) for both Sg/B-D and Fb/B-D comparisons. (C) GO category representation of genes whose expression was at least twofold higher or twofold lower in both Sg/B-D and Fb/B-D comparisons (endocycling versus mitotic cycling cells). The numbers indicate the percentage of differentially expressed genes in that category versus the total number of differentially expressed genes.
Table 1.
Summary of microarray data comparing salivary gland and fat body with brain and disc

To identify genes that differed in expression in both Sg and Fb cells compared with B-D cells, we examined the intersection of the Sg/B-D and Fb/B-D data. Among the 4058 genes that were replicated in both comparisons, 426 genes were expressed at least twofold higher (with 124 of those genes having a P value of ≤0.05), and 1023 genes were expressed at least twofold lower (with 131 having a P value of ≤0.05) in both Sg and Fb compared with B-D (Fig. 1B and Table 2). For the same experiments, we also calculated mRNA ratios for pooled endocycling tissues (Sg+Fb) versus mitotic cycling samples (B-D), representing a total of five biological replicates. Among 6994 genes replicated in at least three experiments, 1185 genes (17%) were expressed at 50% lower levels and 1156 (17%) genes were expressed at twofold higher levels in endocycles with P≤0.05. After multiple hypothesis correction (q≤0.1) (Benjamini and Hochberg, 1995), this gene set was somewhat reduced to 724 (10%) genes with twofold lower levels and 755 (11%) with twofold higher expression in the endocycle (Table 2). The genes whose expression level significantly differed from B-D in both Sg and Fb in these different analyses are candidates for those that reflect an endocycle-specific transcriptional program.
Table 2.
Integrated salivary gland and fat body data compared with brain and disc data

Multiple gene ontology categories have different mRNA levels in endocycling cells reflecting their biological function and variant cell cycle
We determined which gene ontology (GO) functional categories were highly represented among the genes differentially expressed between endocycling and mitotic cycling cells (Fig. 1C; supplementary material Fig. S1) (Dennis et al., 2003; Hosack et al., 2003; Huang et al., 2009). Many of the genes that are more highly expressed in endocycling cells fall into the metabolic, biosynthetic, immunity, and cellular transport categories. This result is consistent with the biological function of the fat body and salivary glands, which grow to large size and have important functions in metabolism and immunity, transporting many proteins into the larval haemolymph or saliva (Britton and Edgar, 1998; Edgar, 2006). Among those genes expressed at lower levels in endocycling cells, the two most common GO categories were development and regulation. This also reflects the biology of these tissues because the salivary glands and fat body are differentiated, whereas the brain and disc cells are continuing to be developmentally specified and patterned during larval life (Edgar et al., 2001).
Many of the genes in the GO category ‘cell cycle’ were also expressed at lower levels in endocycling than in mitotic cycling cells (Fig. 1C, supplementary material Fig. S1 and Table S1). Some of the ‘cell cycle’ genes that were expressed at lower levels in endocycling cells are those required for the G2–M transition and M phase progression, significantly expanding the list of genes with mitotic function that are transcriptionally repressed during the mitotic to endocycle switch (Narbonne Reveau et al., 2008; Sigrist and Lehner, 1997; Sun and Deng, 2007; Zielke et al., 2008). Unexpectedly, genes that act during the G1 to S phases of the mitotic cell cycle were expressed at lower levels in endocycling cells, an observation that we validate and investigate further below.
Many genes activated by E2F1 and Myb are expressed at lower levels in endocycling cells compared with mitotic cycling cells
To gain further insight into endocycle regulation, we conducted a meta-analysis and compared our data with previously published results for important transcriptional regulators of cell division and growth. This included data sets for targets of Myc, E2F1, DP, E2F2, RBF1 and RBF2 (Cayirlioglu et al., 2003; Dimova et al., 2003; Georlette et al., 2007; Orian et al., 2005; Orian et al., 2003). We found that many of the genes activated by the E2F1 transcription factor in Drosophila SL2 cells are expressed at twofold lower levels in salivary gland and fat body compared with disc-brain (Dimova et al., 2003). E2F1–DP activity at the G1–S transition induces a pulse of transcription of many genes that are required for S phase, and also regulates some genes required for mitosis (Reis and Edgar, 2004; van den Heuvel and Dyson, 2008). Dimova and colleagues (Dimova et al., 2003) had defined five classes of genes (classes A–E) in Drosophila SL2 cells whose expression was reduced or increased after RNAi knockdown of E2F1, DP, E2F2, RBF1 and RBF2. Of the 120 previously defined genes whose expression depends on E2F1 in SL2 cells (Dimova classes ‘A–C’, see supplementary material Fig. S2 for full definitions), we had significant data for 75 in the Sg to B-D comparison, of which 61 (81%, P<10−4 by Fisher exact test) were expressed at twofold lower levels in Sg than B-D (Fig. 2A; supplementary material Fig. S2, and Table S2). For the Fb to B-D comparison, we detected 50 E2F1-dependent genes, of which 35 (70%, P<10−4) were twofold lower in Fb than B-D (Fig. 2A; supplementary material Fig. S2, Table S2). Integrating the data, we detected 46 E2F1-dependent genes in both the Sg/B-D and Fb/B-D comparisons, of which 29 (63%, P=0.0104) were expressed at levels at least twofold lower in endocycling cells (Fig. 2A; supplementary material Fig. S2, Table S2). Labeling with BrdU indicated that this lower level of mRNA for E2F1 target genes is not due to a smaller S phase fraction in endocycling cells (data not shown). The results suggest, therefore, that E2F1–DP transcriptional activation is dampened in the endocycle.
Fig. 2.

Many of the genes that are positively regulated by E2F1 and Myb in cell culture are expressed at lower levels in endocycling cells. (A) Results of meta-analysis of E2F1 target genes in S2 cells (Dimova classes A, B, C) (Dimova et al., 2003). The bar graph represents the distribution of E2F1 target genes that were at least twofold higher (green), twofold lower (red), or not significantly different (yellow) in expression for the Sg/B-D or Fb/B-D comparisons, or in both comparisons (intersection ⋂). E2F1 target genes are significantly over-represented in the twofold lower category by the Fisher exact test (***P<0.0001, **P=0.01, *P=0.02) (Fisher, 1921). (B) Results of meta-analysis of Myb–MuvB-activated genes in Kc cells (Georlette class D) (Georlette et al., 2007). Many genes that are positively regulated by Myb are expressed at lower levels in Sg and Fb. (C) QPCR analysis of gene expression for the E2F, RB, and Myb family of transcription factors. Log2-fold difference in expression in the Sg/B-D (yellow) and Fb/B-D (blue) comparisons is shown (+ s.e.m.).
We also compared our data with an extensive RNAi and chromatin immunoprecipitation (ChIP) analysis of the subunits of the Myb–MuvB complex in Drosophila Kc cells (Georlette et al., 2007). The Myb–MuvB complex, also known as dREAM, is an evolutionarily conserved regulator of transcription and DNA replication (Beall et al., 2002; Korenjak et al., 2004; Lewis et al., 2004). The Myb–MuvB complex includes core subunits Myb, Mip40, Mip120, Mip130, RBF1, RBF2, E2F2, p55Caf1 and Lin52, and binds to over 3000 loci in Drosophila where it acts as either a repressor or activator of transcription (Beall et al., 2004; Beall et al., 2007; Georlette et al., 2007; Korenjak et al., 2004; Manak et al., 2007; Wen et al., 2008). Many of the genes that are regulated by Myb–MuvB in Kc cells were differentially expressed by at least ±twofold in the Sg/B-D and Fb/B-D comparisons, including class D genes which are activated by Myb–MuvB (Fig. 2B; supplementary material Fig. S3, Table S3). Although this enrichment of class D genes in the repressed data set was not statistically significant in the fat body, it was striking that most of the class D genes that were previously defined as having functions in mitosis or cytokinesis were expressed at twofold lower levels in salivary gland and fat body (Georlette et al., 2007). Among those genes of known mitotic function for which we had array data, 12/12 in salivary gland, 7/9 in fat body and 7/9 in both tissues were expressed at levels at least twofold lower than in brain-disc (supplementary material Table S3). This suggests that dampened Myb–MuvB activation of these genes contributes to repression of mitosis and promotion of endocycles, which is consistent with previous models (Fitzpatrick et al., 2002; Manak et al., 2002; Wen et al., 2008). QPCR showed that expression of the Myb gene itself is ~sevenfold lower in Sg than in B-D and ~fivefold lower in Fb than in B-D (Fig. 2C), which is consistent with microarray data (supplementary material Table S1) and previous evidence for low level expression of Myb in salivary glands (Fitzpatrick et al., 2002).
In summary, many of the genes that are positively regulated by E2F1–DP and Myb–MuvB transcription factors in cell culture are expressed at lower levels in endocycling cells of the fat body and salivary gland. This reduced expression was most apparent in the salivary gland where the number of genes affected and magnitude of the repression was greater than in the fat body.
‘S phase’ genes are expressed at low levels in endocycling cells
Many of the E2F1-dependent genes that were expressed at lower levels in the endocycling cells encode proteins that are essential for DNA replication. For these and other ‘S phase’ genes, most were expressed at least 50% lower in salivary gland (Sg/B-D, 25/38; P<10−4) or fat body (Fb/B-D, 16/28; P=0.0003), whereas only two were expressed at higher levels (pol-δ and NDP kinase) (supplementary material Table S4). It is notable that almost all of the genes that were expressed at lower levels in fat body were also expressed at lower levels in salivary gland (Sg/B-D and Fb/B-D, 14/15; P=0.0143) (supplementary material Table S4). The repressed genes included subunits of the pre-replicative complex (pre-RC), which binds origins, and many other proteins that act at replication forks or more globally in DNA replication, including CycE, the master regulator of endocycle oscillations. We used QPCR to validate these results and extend them to DNA replication genes for which we did not have significant data from the arrays. QPCR confirmed that many of the genes that are required for genomic DNA replication were expressed at lower levels in endocycling cells of salivary gland and fat body (Fig. 3A). Exceptions to this rule included the pre-RC protein Cdc6, which was not decreased in salivary gland and slightly decreased in fat body, and the subunit of the origin recognition complex (ORC), Orc3, which was decreased in salivary gland but not in fat body. A striking result was that all six subunits of the MCM helicase complex (numbered 2–7) were expressed 8- to 12-fold lower in salivary gland, and 13- to 38-fold lower in fat body, compared with the brain-disc. Analysis of MCM3 and MCM6 expression by northern blot also showed that these genes are expressed at much lower levels in salivary glands than B-D, confirming the results of the arrays and QPCR (Fig. 3B). In summary, despite the need to duplicate hundreds to thousands of genome equivalents, endocycling cells have reduced mRNA levels for many genes that are required for DNA replication.
Fig. 3.

Many S phase genes are expressed at lower levels in endocycling cells. (A) QPCR analysis of expression ratios (means + s.e.m.) for S phase genes comparing Sg/B-D (white bars) and Fb/B-D (gray bars). (B) Northern blot analysis confirms the low abundance of MCM3 and MCM6 in endocycling salivary gland (Sg) compared with mitotic cycling brain-disc (B-D). rRNA was used as a loading control.
Protein levels for some E2F1 target genes are reduced in endocycling cells
The lower mRNA levels for many E2F1 targets in endocycling cells suggest that global E2F1 activity is lower during these variant cell cycles. It is hard to extrapolate this data, which is based on a population of cells, to interpret the activity of E2F1 in single cells. Moreover, analysis of mRNA gives no information about the levels of protein encoded by these genes. We therefore extended our analysis to evaluate protein levels for E2F1 and its targets in single cells. We reasoned that the most biologically relevant measurement is the cellular concentration of a given protein. To measure this, cells were labeled with antibodies against E2F1 and selected target gene proteins. After labeling with the appropriate fluorescent secondary antibody, pixel intensity was measured in single confocal micrograph sections. This fluorescent signal is proportional to the cellular concentration of a given protein, but, because a secondary antibody is used, is not linear with protein concentration.
We first evaluated whether the dampened activity of E2F1 was in part due to a lower level of E2F1 protein. The array and QPCR data had indicated that mRNA encoding E2F1 was perhaps only modestly less abundant in salivary gland but ~four- to eightfold lower in fat body (Fig. 2C; supplementary material Table S4). Labeling with a polyclonal anti-E2F1 antibody confirmed that E2F1 protein abundance oscillates during both mitotic cycles and endocycles (Shibutani et al., 2008). The peak amplitude of E2F1 protein concentrations in salivary gland were 66% of those in wing disc (P<10−4), suggesting that lower E2F1 protein levels contribute to its dampened activity in endocycling cells (Fig. 4A,B,I).
Fig. 4.

Quantification of protein levels in single cells indicates that E2F1 and some of its targets are expressed at lower levels in endocycling cells. Wing discs (A,C,E,G) or salivary glands (B,D,F,H) were labeled with the indicated antibodies (red) and the fluorescent DNA dye TOTO-3 (green). (A,B) anti-E2F1. (C,D) Anti-Double parked (Dup) (Whittaker et al., 2000). (E,F) Anti-Cyclin E (CycE). (G,H) Anti-Humpty dumpty (Hd) (Bandura et al., 2005). Scale bars: 20 μm. (I) Mean pixel intensity ± s.e.m. measured along lines in multiple single cells labeled with the indicated antibodies. Although E2F1, Dup and Hd levels were significantly lower in salivary glands compared with wing disc, CycE levels were not (***P<0.0001, *P<0.05).
To evaluate the effect of dampened E2F1 activity on the level of other cell cycle proteins, we next analyzed the levels of the Double-parked (Dup) protein. Dup is the fly ortholog of Cdt1, a subunit of the pre-Replicative complex that binds to origins and which is essential for DNA replication (Arias and Walter, 2007; Whittaker et al., 2000). The transcription of dup is induced by E2F1–DP, resulting in peak Dup protein levels at G1–S of mitotic cycles and G–S of endocycles (May et al., 2005; Thomer et al., 2004; Whittaker et al., 2000). Dup protein is then rapidly degraded and is undetectable during S phase in mitotic cycling and endocycling cells (Thomer et al., 2004). Importantly, Dup and E2F1 protein are both rapidly degraded at the onset of S phase by the same PCNA and CRL4cdt2 ubiquitin ligase-dependent mechanism (Arias and Walter, 2006; Arias and Walter, 2007; Higa et al., 2006; Hu and Xiong, 2006; Jin et al., 2006; Nishitani et al., 2006; Senga et al., 2006; Shibutani et al., 2008; Zhong et al., 2003). Dup protein abundance, therefore, is a reporter for rising and falling E2F1 activity during the cell cycle. The QPCR data indicated that the abundance of dup mRNA was reduced approximately sixfold in both salivary glands and fat body compared with brain-disc (Fig. 3A). In the single-cell analysis, labeling with two different polyclonal antibodies indicated that the maximum intensity of Dup labeling was lower in salivary gland than it was in disc and brain cells (44%, P<10−4), suggesting that the peak abundance of Dup protein at G–S of endocycles is lower than it is at G1–S in mitotic cycles (Fig. 4C,D,I and data not shown) (Whittaker et al., 2000). These results are consistent with the array and QPCR analysis and further suggest that the peak amplitude of E2F1 activity is lower during the G–S phase of endocycles than it is at the G1–S phase of mitotic cycles.
We wondered whether reduced E2F1 activity resulted in lower protein levels for its other target genes that are important for cell cycle regulation. We extended this analysis to humpty dumpty (hd), an E2F1 regulated gene required for S phase, whose protein product is not targeted for rapid degradation during the cell cycle (Bandura et al., 2005). Measurements showed that Hd protein levels were also lower in salivary gland than in wing disc cells (65%, P<10−4) (Fig. 4G,H,I).
Of special interest is CycE, which is both a target of and regulator of E2F1. The rise in oscillating levels of CycE protein activates CDK2 and promotes periodic endoreplication. From the array data, CycE mRNA was 6 fold less abundant in salivary gland and eightfold less abundant in fat body (supplementary material Table S4). Labeling with a polyclonal anti-CycE antibody, however, showed that CycE protein levels were perhaps slightly reduced in salivary glands compared with wing discs (82%), but this difference was not statistically significant (Fig. 4E,F,I, and data not shown).
We used western blots to validate the measurement of protein levels in single cells, and extended the analysis to fat body. Of the antibodies that we used to label fixed cells, only anti-Dup and anti-Hd reliably detected denatured protein on western blots (Fig. 5). The results confirmed the single cell measurements and showed that both Dup and Hd protein levels were lower in endocycling salivary gland than in mitotic cycling wing disc cells (Dup 13%, P<10−4; Hd 44%, P=0.015) (Fig. 5A,B). Dup protein levels were also reduced in fat body, but Hd levels were not, suggesting differences in regulation in different endocycling cell types.
Fig. 5.
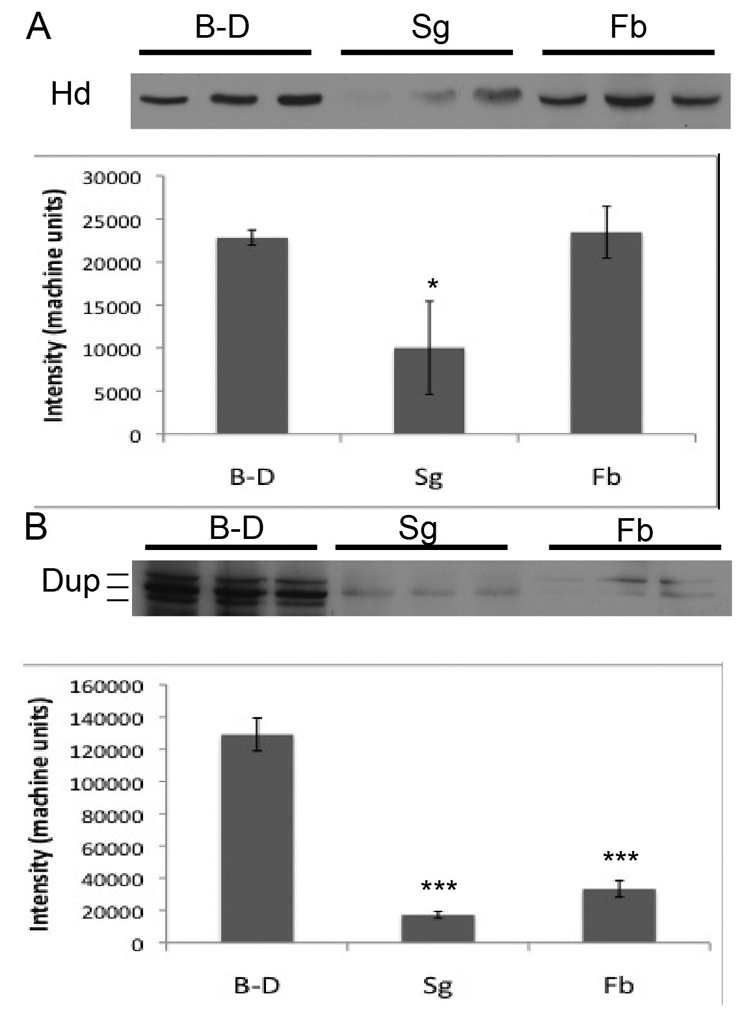
Western blot quantification of protein levels in endocycling and mitotic cycling cells. (A) Hd protein level is lower in salivary gland (SG), but not in fat body (FB), compared with brain-disc (B-D). Equal amounts of total protein extracts were loaded in triplicate and probed with anti-Hd antibody (Bandura et al., 2005). Quantification of mean band intensity ± s.d. is shown in the graph below (*P<0.05). (B) Dup protein level is lower in both SG and FB compared with B-D. Equal amounts of total protein extracts were loaded in triplicate and probed with anti-Dup antibody (Whittaker et al., 2000). Quantification of mean band intensity ± s.d. for each tissue is shown in the graph below (***P<0.001).
In sum, for some E2F1 target genes (E2F1, Dup, Hd), reduced mRNA levels correlated with their lower level of protein in most endocycling cells, with the exception that Hd was not reduced in fat body. For other target genes (CycE), however, lower mRNA levels were not reflected by a significant reduction in protein levels, suggesting an important contribution of post-transcriptional regulation to final cellular protein concentration.
Balanced E2F1 and Myb–MuvB activity is required for endocycles
The mRNA expression analysis suggested that E2F1 transcriptional activity at G–S is dampened in endocycling cells. To evaluate this question further, we modulated E2F1 and Myb–MuvB activity in salivary glands and measured the effect on endoreplication. We labeled late third-instar larvae with the fluorescent DNA dye DAPI and measured the cross-sectional area and total DAPI fluorescence of the nucleus, both of which are proportional to DNA content and the efficiency of endoreplication during the earlier endocycles (Fig. 6A,G,H) (Pierce et al., 2004; Smith and Orr-Weaver, 1991). We first used fly strains with GAL4-inducible UAS:RNAi hairpin transgenes from the Vienna Drosophila RNAi Consortium (VDRC) to knock down E2F and RB family members. The forkhead-GAL4 (Fkh:GAL4) driver was used to express these hairpin RNAi lines continuously in salivary glands beginning from when they first differentiate at 8.5 hours of embryogenesis (Andrew et al., 2000). The Fkh:GAL4 driver is specific to salivary glands and therefore obviates the potential for cell non-autonomous effects, for example, as a result of gene knockdown in other tissues important for larval physiology and growth. Fkh:GAL4 is not expressed in the fat body cells adjacent to the salivary gland, and the nuclear size and fluorescent intensity of these fat body cells served as an internal control for measurements (Fig. 6E,F,H and data not shown). Knockdown of the activating E2F1 gene resulted in significant reductions in size and fluorescent intensity of salivary gland nuclei compared with UAS:GFP controls (Fig. 6A–B,G,H). Knockdown of either E2F2 or RBF1, two subunits of the Myb–MuvB that are required for repression, also resulted in significantly smaller and less intense salivary gland nuclei (Fig. 6C,D,G,H). These results are consistent with previous evidence that E2F1, E2F2 and RBF1 are required for robust endocycles in salivary glands (Weng et al., 2003).
Fig. 6.

Reduced or elevated E2F1 and Myb activity is deleterious to salivary gland endoreplication. Salivary glands (SG) labeled with the fluorescent DNA dye DAPI, with higher magnification of one or two nuclei in the insets. (A) Control Fkh:GAL4/+; UAS:GFP/+, (B) Fkh:GAL4/+; UAS:E2F1RNAi/+, (C) Fkh:GAL4/+; UAS:E2F2RNAi/+, (D) Fkh:GAL4/+; UAS:Rbf1RNAi /+, (E) Fkh:GAL4/UAS:E2F1, UAS:Dp. The two nuclei in higher magnification inset of E show that nuclear size and chromosome morphology were variable. (F) tub:Gal80ts; hsp70:GAL4/UAS:E2F1, UAS:DP 20 hours after heat shock and shift to 29°C. Note that Fkh:GAL4 is not expressed in adjacent fat body nuclei (FB, arrows in E,F), which served as an internal control for measurements. (G) Bars represent the mean ± s.e.m. of nuclear area for salivary gland cells of the indicated genotypes. (H) Measurement of total DAPI fluorescent intensity per nucleus. Gray bars represent salivary gland nuclei and white bars represent control fat body nuclei; n>50 nuclei in the posterior of at least five glands; ***P<0.001 compared with GFP control. Scale bars: 50 μm (A–E); 10 μm (insets).
We next tested what effect elevation of E2F1 and Dp expression levels would have on salivary gland endocycles. Overexpression of UAS:E2F1 and UAS:Dp with Fkh:GAL4 compromised endoreplication even more severely than RNAi knockdown of these genes, resulting in most nuclei being very small (Fig. 6E,G,H). Nuclear size and total fluorescence was variable, however, and the larger nuclei had severely under-condensed and fragmented polytene chromosomes with a dispersed heterochromatic chromocenter (Fig. 6E, insets).
The Fkh:GAL4/UAS:E2F1, UAS:Dp phenotype represented the long-term, chronic overexpression of E2F1–DP during salivary gland development. We wanted to test what effect short-term acute overexpression of E2F1 and Dp would have on endocycling cells. Attempts to do this with heat-inducible hsp70:GAL4 failed because this driver is constitutively active in salivary glands at normal growth temperatures, as evidenced by high levels of the reporter UAS:GFP in controls (data not shown). We therefore used the GAL80ts system, which is a temperature-sensitive inhibitor of GAL4 (McGuire et al., 2004). Larvae of genotype tub:GAL80ts/+; hsp70:GAL4/UAS:E2F1, UAS:Dp were raised at 18°C, the permissive temperature for GAL80ts, which UAS:GFP controls indicated repressed hsp70:GAL4 in the salivary glands. Larvae were then heat shocked for 30 minutes during late second or early third instar and returned to 29°C, the non-permissive temperature for GAL80ts, and labeled with DAPI at different times thereafter. This acute overexpression of E2F1 and Dp resulted in profound changes in the appearance of salivary gland nuclei within 20 hours. Polytene chromosome arms were widely separated into separate nuclear domains, and some had chromosome breaks reminiscent of that seen after long-term chronic E2F1 and Dp expression (Fig. 6F and data not shown). The combined results from the knockdown and overexpression experiments suggest that a balanced level of transcriptional activation and repression by E2F1 and Myb–MuvB is crucial for normal endocycles in salivary glands.
Discussion
Endocycles are widespread in nature but their cell cycle regulation is not fully understood. We used arrays as an entry point to define the endocycle transcriptome. Although this analysis was not exhaustive, the results indicated that expression was higher in endocycling cells for many genes in the GO categories metabolism, physiology, biosynthesis, cellular transport and defense, which is consistent with the prominent role of fat body and salivary gland in these biological processes (Edgar, 2006). Further analysis of these data should motivate future experiments and provide insights into how these processes differ in endocycling cells. We focused on those genes that function in cell cycle regulation. We found that most of the genes positively regulated by E2F1–DP and Myb–MuvB are expressed at lower levels in endocycling cells (Dimova et al., 2003; Georlette et al., 2007). Although our analysis of endocyling cells in fat body and salivary gland was designed to find commonalities in regulation, it also revealed differences in that repression of E2F1- and Myb-activated genes was most pronounced in the salivary gland. This suggests that in different tissues there might be variations on the endocycle theme. Consistent with the mRNA results, protein levels for E2F1, Dup and Hd were reduced in endocycling salivary gland cells. By contrast, for the major E2F1 target gene CycE, protein levels were only slightly lower, despite much lower levels of mRNA, consistent with post-transcriptional regulation modulating the levels and activity of the proteins encoded by the target genes of E2F1–DP and Myb–MuvB. The RNAi results indicated that altering the balance of E2F1 and Myb activity perturbs endocycles. Our expression and genetic results suggest that developmental remodeling of the E2F1–DP and Myb–MuvB transcriptomes is important for endocycle entry and progression.
Many of the genes that are either repressed or activated by the Myb–MuvB/dREAM complex in Kc cells were differentially expressed in salivary glands and fat body compared with brain-disc. Notably, however, most genes that are positively regulated by Myb–MuvB (Georlette class D) and that function in the mitotic phase of the cell cycle were expressed at lower levels in salivary gland and fat body, some of which are also positively regulated by E2F1 (Dimova et al., 2003; Georlette et al., 2007; Reis and Edgar, 2004). The lower levels of expression for the Myb gene might contribute to the dampened expression of Myb targets. These findings are consistent with previous evidence that Myb protein is expressed at low levels in salivary gland cells, and that overexpression of Myb perturbs endoreplication (Fitzpatrick et al., 2002; Katzen et al., 1998). Our results are also consistent with previous evidence that the switch to the endocycle includes a transcriptional repression of genes that promote mitotic entry, but now significantly extends that list to other Myb and E2F1 target genes that function in mitotic progression, spindle assembly checkpoint and cytokinesis (Deng et al., 2001; Narbonne Reveau et al., 2008; Schaeffer et al., 2004; Sigrist and Lehner, 1997; Sun and Deng, 2005; Sun and Deng, 2007; Zielke et al., 2008). Among 12 Myb target genes with mitotic function, all were expressed at lower levels in salivary gland. In the fat body, seven out of nine of the M phase genes were expressed at lower levels, and all seven were also expressed at low levels in salivary gland. In addition to those previously identified Myb targets, it has recently been shown that the Myb–MuvB complex mediates epigenetic regulation of the genes encoding the mitotic kinase polo and those of the spindle assembly checkpoint (SAC) in Drosophila imaginal discs (Wen et al., 2008). We found that the expression of polo and the SAC gene MAD2 were expressed at 28 and 31 fold lower levels in the salivary gland relative to brain-disc, respectively, although they were not appreciably lower in fat body, revealing further diversity in endocycle programs (supplementary material Table S1). Both these genes are also positively regulated by E2F1 in SL2 cells, as are other Myb-MuvB target genes that act in mitosis (supplementary material Tables S2, S3). These data suggest that reduced activation of the Myb–MuvB and E2F1 transcriptomes represses mitosis and enforces endocycles in some tissues of Drosophila (Fig. 7). Evidence suggests that the transcriptional activation of M phase genes by the Myb–MuvB complex is conserved to humans (Nakata et al., 2007; Pilkinton et al., 2007; Schmit et al., 2007). An important prediction from our findings, therefore, is that dampened activity of E2F and Myb might also enforce mammalian endocycles.
Fig. 7.

E2F1–DP and Myb–MuvB activation of S phase and M phase genes is reduced in the endocycle relative to the mitotic cycle. Dampened E2F1 and Myb activity might be important to repress mitotic entry and apoptosis, and to coordinate endocycle oscillations.
Many of the E2F1 target genes that were expressed at lower levels in endocycling cells encode proteins that are required for the regulation and execution of S phase. This result seems paradoxical given the large amount of genomic DNA that must be duplicated in these highly polyploid cells each endocycle S phase. Previous reports have suggested, however, that certain aspects of endoreplication might be different from canonical genomic replication. For example, it has been suggested that certain subunits of the MCM and ORC complex might not be essential in salivary glands (Feger et al., 1995; Lake et al., 2007; Park and Asano, 2008; Treisman et al., 1995), and that replication fork rate is slower in endocycling cells (Spradling and Leys, 1988; Steinemann, 1981). Importantly, however, our results show that reduced mRNA levels for DNA replication genes do not always result in lower protein concentrations in endocycling cells. Therefore, the full interpretation for how reduced E2F1 activity impacts endoreplication awaits further analysis of the levels and function of other replication proteins. In a broader framework, our results highlight the importance of a kinetic analysis of protein levels in single cells, which in recent years has modified the view of cell cycle regulation (Holt et al., 2008; Mechali and Lutzmann, 2008; Sakaue-Sawano et al., 2008; Santos and Ferrell, 2008; Skotheim et al., 2008).
The molecular mechanism by which transcription of E2F1 and Myb targets are dampened in endocycling cells remains unclear. Previous evidence indicated that the balance of E2F1 activation and Myb–MuvB repression dictates expression levels for many genes and is crucial for organism viability (Beall et al., 2004; Frolov et al., 2001). Compatible with this model, we found that RNAi knockdown of both activating and repressing subunits of the E2F1–DP and Myb–MuvB complexes, as well as overexpression of E2F1–DP, all severely compromised endoreplication in salivary glands. These results are also consistent with previous evidence that repression by Myb–MuvB subunits E2F2 and Rbf1 is important for normal endocycles in larval salivary gland, bristle cells, and adult ovarian follicle cells (Cayirlioglu et al., 2001; Cayirlioglu et al., 2003; Weng et al., 2003). Most of the genes that were previously shown to be repressed by E2F2 and Rbf1 in the ovary were expressed at lower levels in salivary gland and fat body, further supporting the interpretation that E2F2-mediated transcriptional repression is important for endocycles (supplementary material Fig. S4) (Cayirlioglu et al., 2003). The lack of a one-to-one correspondence between our expression data in tissues and the previously identified targets in cell culture probably reflects the complexity of E2F1 and Myb–MuvB developmental regulation of these genes in vivo, which is consistent with previous evidence (Cayirlioglu et al., 2001; Cayirlioglu et al., 2003; Stevaux et al., 2005). An important observation, however, is that most genes that are activated by E2F1 and Myb in cell culture were expressed at lower levels in salivary gland and fat body than in disc and brain, whereas many fewer genes were expressed at higher levels. This preponderance of repression is consistent with previous immunocytogenetic evidence that Myb–MuvB subunits bind to many loci on salivary gland polytene chromosomes corresponding to silent genes (Beall et al., 2007; Korenjak et al., 2004; Manak et al., 2007). A model congruent with the data is that promoter-specific modification of E2F1 and Myb activity is important for repression in endocycling cells. The factors that influence activity at each promoter might interact directly with E2F1–DP and Myb–MuvB complexes as co-activators and co-repressors. This possibility is harmonious with the emerging picture in flies and humans for promoter-specific, developmental modulation of E2F1–DP and Myb–MuvB complexes to either activate or repress transcription (Beall et al., 2007; Blais and Dynlacht, 2007; Georlette et al., 2007; Liu et al., 2004; Tyagi et al., 2007; Tyagi and Herr, 2009; van den Heuvel and Dyson, 2008).
What is the functional significance of restrained E2F1 and Myb activity for endocycles? A cogent model discussed earlier is that the dampened E2F1–DP and Myb–MuvB activation of genes that promote mitosis enforces the developmental switch from mitotic cycles to endocycles (Fig. 7) (Georlette et al., 2007; Reis and Edgar, 2004). In addition, endocycling cells normally have stalled replication forks and DNA breaks in their heterochromatin and must block the apoptotic response to DNA lesions (Hong et al., 2007; Mehrotra et al., 2008). Because E2F1 is known to positively regulate pro-apoptotic genes, its dampened activity also might participate in repression of the apoptotic response in endocycling cells (Asano et al., 1996; Moon et al., 2008; Moon et al., 2005; Shibutani et al., 2008).
Another important consideration, however, is that reduced E2F1 activity might be critical for the dynamic regulation of endocycle G and S phase oscillations. The transcriptional component of this oscillator is defined by periodic E2F1 activity at G–S phase, which is modulated through both positive- and negative-feedback loops with CycE–CDK2 (Shibutani et al., 2008; van den Heuvel and Dyson, 2008). Evidence suggests that these feedback loops are operative in endocycling cells, but the relative contribution of these different types of feedback regulation during mitotic cycles and endocycles is not fully resolved (Duronio and O'Farrell, 1995; Follette et al., 1998; Knoblich et al., 1994; Richardson et al., 1993; Shibutani et al., 2008; Weiss et al., 1998; Weng et al., 2003). Our measurements in single cells indicated that CycE protein levels are only slightly lower in salivary gland than in brain-disc. It is possible, however, that our fixed cell methods failed to detect subtle differences in the kinetics of CycE protein and E2F1 oscillations during endocycle regulation. The proposition that restrained E2F1 activity is important for the CycE endocycle oscillator is especially attractive in light of two recent reports that show that periodic CycE–CDK2 repression of APCcdh1 is essential for proper origin regulation and endoreplication of the genome once per endocycle (Narbonne Reveau et al., 2008; Zielke et al., 2008). Moreover, some of the substrates of APCcdh1 that are important for endocycle regulation are proteins encoded by genes that are transcriptionally regulated by E2F1 (Narbonne Reveau et al., 2008; Zielke et al., 2008). One possibility, therefore, is that dampened E2F1 activity is important to achieve a balance between the transcriptional and protein stability oscillators for robust endocycle progression and the regulation of once-per-cell-cycle endoreplication. Analogous CycE–CDK2 and APC endocycle regulation might occur in giant trophoblast cells of the mammalian placenta, raising the question whether dampened E2F1 and Myb activity is an evolutionarily conserved endocycle character (Sivaprasad et al., 2007; Ullah et al., 2009).
Materials and Methods
Drosophila culture and genetics
Most D. melanogaster strains were obtained from the Bloomington Stock Center. RNAi strains were obtained from the Vienna Drosophila RNAi Consortium (VDRC). The UAS:E2F1, UAS:Dp strain was obtained from Bruce Edgar (University of Heidelberg, Germany). The y w67C23 strain was used for all RNA and protein expression analyses. Drosophila adults were put on food for 6 hours, and the resulting population of 72- to 78-hour-old larvae (feeding-stage third instar) was used for hand dissection of salivary glands, fat body and disc-brain complexes. In the RNAi and overexpression experiments, late wandering third-instar larvae were used for measurement of final salivary gland nuclear area. For acute E2F1 and Dp expression, larvae of genotype tub:GAL80ts/+; hsp70:GAL4/UAS:E2F1, UAS:Dp were raised at 18°C, the permissive temperature for GAL80ts. Larvae were then heat shocked for 30 minutes during early third instar and returned to 29°C, the non-permissive temperature for GAL80ts and labeled with DAPI at different times thereafter.
Microarrays
Gene expression analyses were performed on tissues hand dissected from yw67C23 early third-instar larval tissues collected 70–75 hours after egg laying. Standard methods were used for synthesis of cDNA and probing of the DGRC-2 oligo arrays (Bogart et al., 2006). Total RNA was isolated from early third-instar y w67C23 larvae using RNeasy Micro Kit (QIAGEN Valencia, CA 91355), and reverse transcribed and fluorescently labeled with Cy3 or Cy5 (Amersham) using Amino Allyl MessageAmp™ II aRNA Amplification Kit (Ambion, Austin, TX 78744), according to the manufacturer's instructions. This was used to probe the DGRC-2 array, aDrosophila oligonucleotide array created by the Drosophila Genomics Resource Center (DGRC) which represents ~93% of annotated Drosophila genes from genome release 4.1 (https://dgrc.cgb.indiana.edu/microarrays/support/protocols.html). Two-color microarray hybridizations were repeated with material from independent dissections representing two (fat body versus brain and imaginal disc) and three (salivary gland versus brain and imaginal disc) independent biological replicates with dye swap. Slides were scanned by GenePix 4100A (Axon Instruments, Union City, CA) and the data was extracted with Axon GenePix Pro 5 image analysis software. The spot sizes and intensities were quantified by the software and automatically flagged spot qualities were manually examined and removed if abnormal. The normalization of the intensity values from the two channels was performed using global normalizations. After normalization, data points with background subtracted median intensity signals <60% of two standard deviations (s.d.) above the overall background intensity in both channels were discarded. Further data analyses were performed using data analysis software Acuity 4 (Axon) and Microsoft Excel. The globally normalized mean intensity and standard deviation for each gene was calculated from independent biological replicates for each tissue. A complete set of microarray expression data is available at http://www.ncbi.nlm.nih.gov/geo/ under series accession number GSE19029.
Microarray data analysis
Differentially expressed genes were identified using two methods. In the first, the ratio of expression in salivary gland versus brain-disc (Sg/B-D) or fat body versus brain-disc (Fb/B-D) was calculated as the mean of the normalized ratios from each array. We first culled out genes whose standard error exceeded 30% of the mean as those whose expression level was not well estimated by the biological replicates. Among the remaining genes, those with ratios ≥+2 or ≤–2 were considered differentially expressed. The genes that gave a robust and detectable expression value in mitotic cycling but not endocycling tissue (or vice versa) were considered those with the highest differential expression. To retain this class of genes in the calculation of ratios, the intensity value was adjusted to a low value of 10 for that tissue in which the gene expression was undetectable. The differentially expressed gene set was further filtered for those with P≤0.05 after comparison of normalized gene spot intensity mean and s.d. between tissues using one-way ANOVA (Fisher, 1921). The genes that are differentially expressed in endocycling versus mitotically cycling cells were then defined as those with at least ±twofold expression difference and P≤0.05 for Sg/B-D and Fb/B-D (the intersection of the two ratio data sets). In the second method, the mean expression for each gene in endocycling cells was calculated from pooled Sg and Fb values. The Sg+Fb/B-D ratios were then calculated from the five biological replicates. Genes with a Sg+Fb/B-D of greater than ±twofold were defined as differentially expressed, and further filtered for P≤0.05 by ANOVA, and also q<0.10 after multiple hypothesis correction for false discovery (Benjamini and Hochberg, 1995). Gene expression ratios for Sg/B-D or Fb/B-D that were more than twofold and P≤0.05 were grouped into functional categories using the Gene Ontology (GO) Analysis Mining Tool at http://david.abcc.ncifcrf.gov/ (Dennis et al., 2003; Hosack et al., 2003; Huang et al., 2009).
Meta-analysis
The set of genes that were differentially expressed by at least twofold between Sg/B-D and Fb/B-D were compared with previously published reports for targets of Myc, E2F1, E2F2, Dp, RBF1, RBF2 and other subunits of the Myb–MuvB complex (Cayirlioglu et al., 2003; Dimova et al., 2003; Georlette et al., 2007; Orian et al., 2005; Orian et al., 2003). The target genes of these transcription factors for which we had significant data were then binned into those whose expression was either ±twofold, or not significantly different, in the Sg/B-D and Fb/B-D comparisons. A two-tailed Fisher exact test was used to determine the statistical significance of enrichment of these transcription factor targets into the differentially expressed classes. The null hypothesis was based on the distribution of all genes for which we had array ratio values in the tissues under comparison (Sg/B-D, Fb/B-D), or the integration of the two data sets (Sg/B-D and Fb/B-D).
Quantitative real-time PCR
Two micrograms of total RNA from tissues of ~75 early third-instar larvae (75 hours a.e.d.) were converted to cDNAs using Powerscript reverse transcriptase (BD-Biosciences) and an oligo(dT)18 primer according to the manufacturer's instructions. Each cDNA sample was diluted ten times, and 1/100th (~20 ng) was used for PCR. Equivalent amounts of total cDNA were used in each reaction for different tissues. Relative quantities of gene expression were determined using the iCycler Real-Time PCR system (Bio-Rad) using the manufacturer's instructions. dsDNA accumulation during the reaction was measured with iQ™ SYBR Green supermix (Bio-Rad). The specificity of the amplified products was determined following PCR cycling by dissociation curve as described (Pfaffl, 2001), as well as by visualization after resolving on 1.4% (w/v) agarose gels. The Ct value for each gene was determined with the iCycler software. To avoid assumptions about equal housekeeping gene expression in different tissues, the ΔCt was normalized using a rank-invariant set normalization approach (Mar et al., 2009; Tseng et al., 2001) to obtain a normalized ΔΔCt, after correction for PCR efficiency as described (Jin et al., 2006; Pfaffl, 2001; Ramakers et al., 2003).
Northern blot analysis
For MCM northern blots, total RNA was fractionated on 0.4 M formaldehyde, 1.2% agarose gels and transferred to XL Hybond N+ nylon membrane (Amersham-Pharmacia). DNA probes were made from PCR amplified fragments of selected clones using [α-32P]dCTP (dCTP: MP Biomedical, Aurora, OH). Blots were hybridized and washed according to standard procedures (Sambrook et al., 1989). rRNA abundance and hybridization to rp49 were used as loading controls. Standard methods were used for QPCR, northern blotting and western blot validation of the arrays (Sambrook et al., 1989).
Western blot analysis
Mid-third-instar y w67C23 larvae were hand dissected and protein extracts were made from different tissues by standard methods using RIPA buffer (Harlow and Lane, 1999). To avoid assumptions about equal gene expression of housekeeping genes in different tissues, we did not normalize to another protein for loading control, but instead normalized to total protein concentration as determined by standard Bradford assay in triplicate using BSA for a standard curve (BSA). Equal amounts of total protein from different tissues were loaded onto the gel in triplicate. Western blot was performed according to the standard protocol and detected using the ECL kit (Thermo Scientific) (Harlow and Lane, 1999). Hd was detected using the affinity purified polyclonal rabbit antibody at 1:10,000 (Bandura et al., 2005) and Dup was detected using a polyclonal rabbit antibody at 1:5000 (Whittaker et al., 2000). The average intensity of the bands for each sample was quantified using a Bio-Rad Chemi Doc system equipped with Quantity One software. A Student's t-test was used to calculate P values for comparison of the means for B-D versus Sg or Fb.
Immunolabeling and microscopy
Methods for immunolabeling were as previously described (Mehrotra et al., 2008). The following antibodies and concentrations were used: guinea pig anti-Dup 1:1000 (Whittaker et al., 2000), guinea pig anti-E2F1 1:500, guinea pig anti-Cyclin E 1:500 (all three antibodies generously provided by T. Orr-Weaver, Whitehead Institute, Cambridge, MA), rabbit anti-Hd 1:1000 (Bandura et al., 2005). Images were taken on a Leica SP5 confocal microscope for protein quantification of Fig. 4, or a DMR Leica widefield microscope for measurement of nuclear size and DAPI fluorescence in for Fig. 6. For quantification of protein expression, SP5 software was used to measure the intensity of immunolabeling in equally exposed, non-saturated, single confocal sections of endocycle and mitotic cycle cells. Two methods were used: (1) pixel intensity along lines drawn through individual nuclei and (2) pixel intensity within a sub-nuclear, circular region of interest. For measurement of endoreplication in Fig. 6, salivary glands were mounted under supported coverslips and images were captured on a Leica DMRA widefield microscope with CCD camera and nuclear cross-sectional area was measured using Openlab software. Alternatively, preparations were partially flattened and total DAPI intensity per nucleus was measured using the same platform and analysis software.
Supplementary Material
Acknowledgments
We thank K. Matthews and K. Cook of the Bloomington Drosophila Stock Center, the Vienna Drososphila RNAi Consortium, and B. Edgar for fly strains. Thanks to T. Orr-Weaver, M. Botchan, and S. Bell for antibodies, J. Andrews, K. Montooth, and M. Hahn for helpful discussions, and J. Marquez for technical support. A complete set of microarray expression data is available at http://www.ncbi.nlm.nih.gov/geo/ under accession GSE19029. This work was supported by ACS RSG-04-172-01-CCG and NIH R01 GM061290 to B.R.C. Deposited in PMC for release after 12 months.
Footnotes
Supplementary material available online at http://jcs.biologists.org/cgi/content/full/123/23/4095/DC1
References
- Andrew D. J., Henderson K. D., Seshaiah P. (2000). Salivary gland development in Drosophila melanogaster. Mech. Dev. 92, 5-17 [DOI] [PubMed] [Google Scholar]
- Arias E. E., Walter J. C. (2006). PCNA functions as a molecular platform to trigger Cdt1 destruction and prevent re-replication. Nat. Cell Biol. 8, 84-90 [DOI] [PubMed] [Google Scholar]
- Arias E. E., Walter J. C. (2007). Strength in numbers: preventing rereplication via multiple mechanisms in eukaryotic cells. Genes Dev. 21, 497-518 [DOI] [PubMed] [Google Scholar]
- Asano M., Nevins J. R., Wharton R. P. (1996). Ectopic E2F expression induces S phase and apoptosis in Drosophila imaginal discs. Genes Dev. 10, 1422-1432 [DOI] [PubMed] [Google Scholar]
- Bandura J. L., Beall E. L., Bell M., Silver H. R., Botchan M. R., Calvi B. R. (2005). humpty dumpty is required for developmental DNA amplification and cell proliferation in Drosophila. Curr. Biol. 15, 755-759 [DOI] [PubMed] [Google Scholar]
- Beall E. L., Manak J. R., Zhou S., Bell M., Lipsick J. S., Botchan M. R. (2002). Role for a Drosophila Myb-containing protein complex in site-specific DNA replication. Nature 420, 833-837 [DOI] [PubMed] [Google Scholar]
- Beall E. L., Bell M., Georlette D., Botchan M. R. (2004). Dm-myb mutant lethality in Drosophila is dependent upon mip130: positive and negative regulation of DNA replication. Genes Dev. 18, 1667-1680 [DOI] [PMC free article] [PubMed] [Google Scholar]
- Beall E. L., Lewis P. W., Bell M., Rocha M., Jones D. L., Botchan M. R. (2007). Discovery of tMAC: a Drosophila testis-specific meiotic arrest complex paralogous to Myb-Muv B. Genes Dev. 21, 904-919 [DOI] [PMC free article] [PubMed] [Google Scholar]
- Benjamini Y., Hochberg Y. (1995). Controlling the false discovery rate: a practical and powerful approach to multiple testing. J. R. Stat. Soc. Ser. B 57, 289-300 [Google Scholar]
- Berendes H. D., Ashburner M. (1978). The salivary glands. In The Genetics and Biology of Drosophila, Vol. 2c (ed. Ashburner M., Wright T. R. F.), pp. 453-498 New York: Academic Press; [Google Scholar]
- Blais A., Dynlacht B. D. (2007). E2F-associated chromatin modifiers and cell cycle control. Curr. Opin. Cell Biol. 19, 658-662 [DOI] [PMC free article] [PubMed] [Google Scholar]
- Bogart K., Costello J., Eads E., Bohuski B. E., Andrews J. (2006). Amino Allyl Labeling and Hybridization Protocol. Center for Genomics and Bioinformatics Technical Report 2006-06, Indiana University. doi:10. 2506/cgbtr-200606
- Britton J. S., Edgar B. A. (1998). Environmental control of the cell cycle in Drosophila: nutrition activates mitotic and endoreplicative cells by distinct mechanisms. Development 125, 2149-2158 [DOI] [PubMed] [Google Scholar]
- Butterworth F. M., Rasch E. M. (1986). Adipose tissue of Drosophila melanogaster: VII. Distribution of nuclear DNA amounts along the anterior-posterior axis in the larval fat body. J. Exp. Zool. 239, 77-85 [DOI] [PubMed] [Google Scholar]
- Calvi B. R., Lilly M. A., Spradling A. C. (1998). Cell cycle control of chorion gene amplification. Genes Dev. 12, 734-744 [DOI] [PMC free article] [PubMed] [Google Scholar]
- Cayirlioglu P., Bonnette P. C., Dickson M. R., Duronio R. J. (2001). Drosophila E2f2 promotes the conversion from genomic DNA replication to gene amplification in ovarian follicle cells. Development 128, 5085-5098 [DOI] [PubMed] [Google Scholar]
- Cayirlioglu P., Ward W. O., Silver Key S. C., Duronio R. J. (2003). Transcriptional repressor functions of Drosophila E2F1 and E2F2 cooperate to inhibit genomic DNA synthesis in ovarian follicle cells. Mol. Cell. Biol. 23, 2123-2134 [DOI] [PMC free article] [PubMed] [Google Scholar]
- de Nooij J. C., Graber K. H., Hariharan I. K. (2000). Expression of the cyclin-dependent kinase inhibitor Dacapo is regulated by cyclin E. Mech. Dev. 97, 73-83 [DOI] [PubMed] [Google Scholar]
- Deng W. M., Althauser C., Ruohola-Baker H. (2001). Notch-Delta signaling induces a transition from mitotic cell cycle to endocycle in Drosophila follicle cells. Development 128, 4737-4746 [DOI] [PubMed] [Google Scholar]
- Dennis G., Jr, Sherman B. T., Hosack D. A., Yang J., Gao W., Lane H. C., Lempicki R. A. (2003). DAVID: Database for Annotation, Visualization, and Integrated Discovery. Genome Biol. 4, P3 [PubMed] [Google Scholar]
- Dimova D. K., Stevaux O., Frolov M. V., Dyson N. J. (2003). Cell cycle-dependent and cell cycle-independent control of transcription by the Drosophila E2F/RB pathway. Genes Dev. 17, 2308-2320 [DOI] [PMC free article] [PubMed] [Google Scholar]
- Du W., Vidal M., Xie J. E., Dyson N. (1996). RBF, a novel RB-related gene that regulates E2F activity and interacts with cyclin E in Drosophila. Genes Dev. 10, 1206-1218 [DOI] [PubMed] [Google Scholar]
- Duronio R. J., O'Farrell P. H. (1995). Developmental control of the G1 to S transition in Drosophila: cyclin Eis a limiting downstream target of E2F. Genes Dev. 9, 1456-1468 [DOI] [PubMed] [Google Scholar]
- Dynlacht B. D., Brook A., Dembski M., Yenush L., Dyson N. (1994). DNA-binding and trans-activation properties of Drosophila E2F and DP proteins. Proc. Natl. Acad. Sci. USA 91, 6359-6363 [DOI] [PMC free article] [PubMed] [Google Scholar]
- Edgar B. A. (2006). How flies get their size: genetics meets physiology. Nat. Rev. Genet. 7, 907-916 [DOI] [PubMed] [Google Scholar]
- Edgar B. A., Orr-Weaver T. L. (2001). Endoreplication cell cycles: more for less. Cell 105, 297-306 [DOI] [PubMed] [Google Scholar]
- Edgar B. A., Britton J., de la Cruz A. F., Johnston L. A., Lehman D., Martin-Castellanos C., Prober D. (2001). Pattern- and growth-linked cell cycles in Drosophila development. Novartis Found. Symp. 237, 3-12, discussion 12-8, 36-42 [DOI] [PubMed] [Google Scholar]
- Feger G., Vaessin H., Su T., Wolff E., Jan L., Jan Y. (1995). dpa, a member of the MCM family, is required for mitotic DNA replication but not endoreplication in Drosophila. EMBO J. 14, 5387-5398 [DOI] [PMC free article] [PubMed] [Google Scholar]
- Fisher R. (1921). Studies in crop variation. I. An examination of the yield of dressed grain from Broadbalk. J. Agric. Sci. 11, 107-135 [Google Scholar]
- Fitzpatrick C. A., Sharkov N. V., Ramsay G., Katzen A. L. (2002). Drosophila myb exerts opposing effects on S phase, promoting proliferation and suppressing endoreduplication. Development 129, 4497-4507 [DOI] [PubMed] [Google Scholar]
- Follette P. J., Duronio R. J., O'Farrell P. H. (1998). Fluctuations in cyclin E levels are required for multiple rounds of endocycle S phase in Drosophila. Curr. Biol. 8, 235-238 [DOI] [PMC free article] [PubMed] [Google Scholar]
- Frolov M. V., Huen D. S., Stevaux O., Dimova D., Balczarek-Strang K., Elsdon M., Dyson N. J. (2001). Functional antagonism between E2F family members. Genes Dev. 15, 2146-2160 [DOI] [PMC free article] [PubMed] [Google Scholar]
- Georlette D., Ahn S., MacAlpine D. M., Cheung E., Lewis P. W., Beall E. L., Bell S. P., Speed T., Manak J. R., Botchan M. R. (2007). Genomic profiling and expression studies reveal both positive and negative activities for the Drosophila Myb MuvB/dREAM complex in proliferating cells. Genes Dev. 21, 2880-2896 [DOI] [PMC free article] [PubMed] [Google Scholar]
- Hammond M. P., Laird C. D. (1985). Control of DNA replication and spatial distribution of defined DNA sequences in salivary gland cells of Drosophila melanogaster. Chromosoma 91, 279-286 [DOI] [PubMed] [Google Scholar]
- Harlow E., Lane D. (1999). Using Antibodies: A Laboratory Manual. Cold Spring Harbor: Cold Spring Harbor Laboratory Press; [Google Scholar]
- Hattori N., Davies T. C., Anson-Cartwright L., Cross J. C. (2000). Periodic expression of the cyclin-dependent kinase inhibitor p57(Kip2) in trophoblast giant cells defines a G2-like gap phase of the endocycle. Mol. Biol. Cell 11, 1037-1045 [DOI] [PMC free article] [PubMed] [Google Scholar]
- Higa L. A., Banks D., Wu M., Kobayashi R., Sun H., Zhang H. (2006). L2DTL/CDT2 interacts with the CUL4/DDB1 complex and PCNA and regulates CDT1 proteolysis in response to DNA damage. Cell Cycle 5, 1675-1680 [DOI] [PubMed] [Google Scholar]
- Hochegger H., Takeda S., Hunt T. (2008). Cyclin-dependent kinases and cell-cycle transitions: does one fit all? Nat. Rev. Mol. Cell Biol. 9, 910-916 [DOI] [PubMed] [Google Scholar]
- Holt L. J., Krutchinsky A. N., Morgan D. O. (2008). Positive feedback sharpens the anaphase switch. Nature 454, 353-357 [DOI] [PMC free article] [PubMed] [Google Scholar]
- Hong A., Narbonne-Reveau K., Riesgo-Escovar J., Fu H., Aladjem M. I., Lilly M. A. (2007). The cyclin-dependent kinase inhibitor Dacapo promotes replication licensing during Drosophila endocycles. EMBO J. 26, 2071-2082 [DOI] [PMC free article] [PubMed] [Google Scholar]
- Hosack D. A., Dennis G., Jr, Sherman B. T., Lane H. C., Lempicki R. A. (2003). Identifying biological themes within lists of genes with EASE. Genome Biol. 4, R70 [DOI] [PMC free article] [PubMed] [Google Scholar]
- Hu J., Xiong Y. (2006). An evolutionarily-conserved function of PCNA for Cdt1 degradation by the Cul4-Ddb1 ubiquitin ligase in response to DNA damage. J. Biol. Chem. 281, 3753-3756 [DOI] [PubMed] [Google Scholar]
- Huang D., Sherman B., Lempicki R. (2009). Systematic and integrative analysis of large gene lists using DAVID bioinformatics resources. Nat. Protoc. 4, 44-57 [DOI] [PubMed] [Google Scholar]
- Jin J., Arias E. E., Chen J., Harper J. W., Walter J. C. (2006). A family of diverse Cul4-Ddb1-interacting proteins includes Cdt2, which is required for S phase destruction of the replication factor Cdt1. Mol. Cell 23, 709-721 [DOI] [PubMed] [Google Scholar]
- Katzen A. L., Jackson J., Harmon B. P., Fung S. M., Ramsay G., Bishop J. M. (1998). Drosophila myb is required for the G2/M transition and maintenance of diploidy. Genes Dev. 12, 831-843 [DOI] [PMC free article] [PubMed] [Google Scholar]
- Knoblich J. A., Sauer K., Jones L., Richardson H., Saint R., Lehner C. F. (1994). Cyclin E controls S phase progression and its down regulation during Drosophila embryogenesis is required for the arrest of cell proliferation. Cell 77, 107-120 [DOI] [PubMed] [Google Scholar]
- Korenjak M., Taylor-Harding B., Binne U. K., Satterlee J. S., Stevaux O., Aasland R., White-Cooper H., Dyson N., Brehm A. (2004). Native E2F/RBF complexes contain Myb-interacting proteins and repress transcription of developmentally controlled E2F target genes. Cell 119, 181-193 [DOI] [PubMed] [Google Scholar]
- Lake C. M., Teeter K., Page S. L., Nielsen R., Hawley R. S. (2007). A genetic analysis of the Drosophila mcm5 gene defines a domain specifically required for meiotic recombination. Genetics 176, 2151-2163 [DOI] [PMC free article] [PubMed] [Google Scholar]
- Lee H. O., Davidson J. M., Duronio R. J. (2009). Endoreplication: polyploidy with purpose. Genes Dev. 23, 2461-2477 [DOI] [PMC free article] [PubMed] [Google Scholar]
- Lewis P. W., Beall E. L., Fleischer T. C., Georlette D., Link A. J., Botchan M. R. (2004). Identification of a Drosophila Myb-E2F2/RBF transcriptional repressor complex. Genes Dev. 18, 2929-2940 [DOI] [PMC free article] [PubMed] [Google Scholar]
- Lilly M., Spradling A. (1996). The Drosophila endocycle is controlled by Cyclin E and lacks a checkpoint ensuring S-phase completion. Genes Dev. 10, 2514-2526 [DOI] [PubMed] [Google Scholar]
- Liu K., Luo Y., Lin F. T., Lin W. C. (2004). TopBP1 recruits Brg1/Brm to repress E2F1-induced apoptosis, a novel pRb-independent and E2F1-specific control for cell survival. Genes Dev. 18, 673-686 [DOI] [PMC free article] [PubMed] [Google Scholar]
- Manak J. R., Mitiku N., Lipsick J. S. (2002). Mutation of the Drosophila homologue of the Myb protooncogene causes genomic instability. Proc. Natl. Acad. Sci. USA 99, 7438-7443 [DOI] [PMC free article] [PubMed] [Google Scholar]
- Manak J. R., Wen H., Van T., Andrejka L., Lipsick J. S. (2007). Loss of Drosophila Myb interrupts the progression of chromosome condensation. Nat. Cell Biol. 9, 581-587 [DOI] [PubMed] [Google Scholar]
- Mar J. C., Kimura Y., Schroder K., Irvine K. M., Hayashizaki Y., Suzuki H., Hume D., Quackenbush J. (2009). Data-driven normalization strategies for high-throughput quantitative RT-PCR. BMC Bioinformatics 10, 110 [DOI] [PMC free article] [PubMed] [Google Scholar]
- May N. R., Thomer M., Murnen K. F., Calvi B. R. (2005). Levels of the origin-binding protein Double parked and its inhibitor Geminin increase in response to replication stress. J. Cell Sci. 118, 4207-4217 [DOI] [PubMed] [Google Scholar]
- McGuire S. E., Mao Z., Davis R. L. (2004). Spatiotemporal gene expression targeting with the TARGET and gene-switch systems in Drosophila. Sci. STKE 2004, pl6 [DOI] [PubMed] [Google Scholar]
- Mechali M., Lutzmann M. (2008). The cell cycle: now live and in color. Cell 132, 341-343 [DOI] [PubMed] [Google Scholar]
- Mehrotra S., Maqbool S. B., Kolpakas A., Murnen K., Calvi B. R. (2008). Endocycling cells do not apoptose in response to DNA rereplication genotoxic stress. Genes Dev. 22, 3158-3171 [DOI] [PMC free article] [PubMed] [Google Scholar]
- Moon N. S., Frolov M. V., Kwon E. J., Di Stefano L., Dimova D. K., Morris E. J., Taylor-Harding B., White K., Dyson N. J. (2005). Drosophila E2F1 has context-specific pro- and antiapoptotic properties during development. Dev. Cell 9, 463-475 [DOI] [PubMed] [Google Scholar]
- Moon N. S., Di Stefano L., Morris E. J., Patel R., White K., Dyson N. J. (2008). E2F and p53 induce apoptosis independently during Drosophila development but intersect in the context of DNA damage. PLoS Genet. 4, e1000153 [DOI] [PMC free article] [PubMed] [Google Scholar]
- Nakata Y., Shetzline S., Sakashita C., Kalota A., Rallapalli R., Rudnick S. I., Zhang Y., Emerson S. G., Gewirtz A. M. (2007). c-Myb contributes to G2/M cell cycle transition in human hematopoietic cells by direct regulation of cyclin B1 expression. Mol. Cell. Biol. 27, 2048-2058 [DOI] [PMC free article] [PubMed] [Google Scholar]
- Narbonne Reveau K., Senger S., Pal M., Herr A., Richardson H. E., Asano M., Deak P., Lilly M. A. (2008). APC/CFzr/Cdh1 promotes cell cycle progression during the Drosophila endocycle. Development 135, 1451-1461 [DOI] [PubMed] [Google Scholar]
- Neufeld T. P., de la Cruz A. F., Johnston L. A., Edgar B. A. (1998). Coordination of growth and cell division in the Drosophila wing. Cell 93, 1183-1193 [DOI] [PubMed] [Google Scholar]
- Nishitani H., Sugimoto N., Roukos V., Nakanishi Y., Saijo M., Obuse C., Tsurimoto T., Nakayama K. I., Nakayama K., Fujita M., et al. (2006). Two E3 ubiquitin ligases, SCF-Skp2 and DDB1-Cul4, target human Cdt1 for proteolysis. EMBO J. 25, 1126-1136 [DOI] [PMC free article] [PubMed] [Google Scholar]
- Ohlmeyer J. T., Schupbach T. (2003). Encore facilitates SCF-Ubiquitin-proteasome-dependent proteolysis during Drosophila oogenesis. Development 130, 6339-6349 [DOI] [PubMed] [Google Scholar]
- Orian A., van Steensel B., Delrow J., Bussemaker H. J., Li L., Sawado T., Williams E., Loo L. W., Cowley S. M., Yost C., et al. (2003). Genomic binding by theDrosophila Myc, Max, Mad/Mnt transcription factor network. Genes Dev. 17, 1101-1114 [DOI] [PMC free article] [PubMed] [Google Scholar]
- Orian A., Grewal S. S., Knoepfler P. S., Edgar B. A., Parkhurst S. M., Eisenman R. N. (2005). Genomic binding and transcriptional regulation by the Drosophila Myc and Mnt transcription factors. Cold Spring Harbor Symp. Quant. Biol. 70, 299-307 [DOI] [PubMed] [Google Scholar]
- Painter T. S., Reindorp E. (1939). Endomitosis in the nurse cells of the ovary of Drosophila melanogaster. Chromosoma 1, 276-283 [Google Scholar]
- Park S. Y., Asano M. (2008). The origin recognition complex is dispensable for endoreplication in Drosophila. Proc. Natl. Acad. Sci. USA 105, 12343-12348 [DOI] [PMC free article] [PubMed] [Google Scholar]
- Pfaffl M. W. (2001). A new mathematical model for relative quantification in real-time RT-PCR. Nucleic Acids Res. 29, e45 [DOI] [PMC free article] [PubMed] [Google Scholar]
- Pierce S. B., Yost C., Britton J. S., Loo L. W., Flynn E. M., Edgar B. A., Eisenman R. N. (2004). dMyc is required for larval growth and endoreplication in Drosophila. Development 131, 2317-2327 [DOI] [PubMed] [Google Scholar]
- Pilkinton M., Sandoval R., Colamonici O. R. (2007). Mammalian Mip/LIN-9 interacts with either the p107, p130/E2F4 repressor complex or B-Myb in a cell cycle-phase-dependent context distinct from the Drosophila dREAM complex. Oncogene 26, 7535-7543 [DOI] [PubMed] [Google Scholar]
- Ramakers C., Ruijter J. M., Deprez R. H., Moorman A. F. (2003). Assumption-free analysis of quantitative real-time polymerase chain reaction (PCR) data. Neurosci. Lett. 339, 62-66 [DOI] [PubMed] [Google Scholar]
- Reis T., Edgar B. A. (2004). Negative regulation of dE2F1 by cyclin-dependent kinases controls cell cycle timing. Cell 117, 253-264 [DOI] [PubMed] [Google Scholar]
- Richardson H. E., O'Keefe L. V., Reed S. I., Saint R. (1993). A Drosophila G1-specific cyclin E homolog exhibits different modes of expression during embryogenesis. Development 119, 673-690 [DOI] [PubMed] [Google Scholar]
- Sakaue-Sawano A., Kurokawa H., Morimura T., Hanyu A., Hama H., Osawa H., Kashiwagi S., Fukami K., Miyata T., Miyoshi H., et al. (2008). Visualizing spatiotemporal dynamics of multicellular cell-cycle progression. Cell 132, 487-498 [DOI] [PubMed] [Google Scholar]
- Sambrook J., Fritsch E. F., Maniatis T. (1989). Molecular Cloning: A Laboratory Manual. Cold Spring Harbor, NY: Cold Spring Harbor Laboratory Press; [Google Scholar]
- Santos S. D., Ferrell J. E. (2008). Systems biology: on the cell cycle and its switches. Nature 454, 288-289 [DOI] [PMC free article] [PubMed] [Google Scholar]
- Sauer K., Knoblich J. A., Richardson H., Lehner C. F. (1995). Distinct modes of cyclin E/cdc2c kinase regulation and S-phase control in mitotic and endoreduplication cycles of Drosophila embryogenesis. Genes Dev. 9, 1327-1339 [DOI] [PubMed] [Google Scholar]
- Sawado T., Yamaguchi M., Nishimoto Y., Ohno K., Sakaguchi K., Matsukage A. (1998). dE2F2, a novel E2F-family transcription factor in Drosophila melanogaster. Biochem. Biophys. Res. Commun. 251, 409-415 [DOI] [PubMed] [Google Scholar]
- Schaeffer V., Althauser C., Shcherbata H. R., Deng W. M., Ruohola-Baker H. (2004). Notch-dependent Fizzy-related/Hec1/Cdh1 expression is required for the mitotic-to-endocycle transition in Drosophila follicle cells. Curr. Biol. 14, 630-636 [DOI] [PubMed] [Google Scholar]
- Schmit F., Korenjak M., Mannefeld M., Schmitt K., Franke C., von Eyss B., Gagrica S., Hanel F., Brehm A., Gaubatz S. (2007). LINC, a human complex that is related to pRB-containing complexes in invertebrates regulates the expression of G2/M genes. Cell Cycle 6, 1903-1913 [DOI] [PubMed] [Google Scholar]
- Senga T., Sivaprasad U., Zhu W., Park J. H., Arias E. E., Walter J. C., Dutta A. (2006). PCNA is a co-factor for Cdt1 degradation by CUL4/DDB1 mediated N-terminal ubiquitination. J. Biol. Chem. 281, 6246-6252 [DOI] [PubMed] [Google Scholar]
- Shcherbata H. R., Althauser C., Findley S. D., Ruohola-Baker H. (2004). The mitotic-to-endocycle switch in Drosophila follicle cells is executed by Notch-dependent regulation of G1/S, G2/M and M/G1 cell-cycle transitions. Development 131, 3169-3181 [DOI] [PubMed] [Google Scholar]
- Shibutani S. T., de la Cruz A. F., Tran V., Turbyfill W. J., 3rd, Reis T., Edgar B. A., Duronio R. J. (2008). Intrinsic negative cell cycle regulation provided by PIP box- and Cul4Cdt2-mediated destruction of E2f1 during S phase. Dev. Cell 15, 890-900 [DOI] [PMC free article] [PubMed] [Google Scholar]
- Sigrist S. J., Lehner C. F. (1997). Drosophila fizzy-related down-regulates mitotic cyclins and is required for cell proliferation arrest and entry into endocycles. Cell 90, 671-681 [DOI] [PubMed] [Google Scholar]
- Sivaprasad U., Machida Y. J., Dutta A. (2007). APC/C-the master controller of origin licensing? Cell Div. 2, 8 [DOI] [PMC free article] [PubMed] [Google Scholar]
- Skotheim J. M., Di Talia S., Siggia E. D., Cross F. R. (2008). Positive feedback of G1 cyclins ensures coherent cell cycle entry. Nature 454, 291-296 [DOI] [PMC free article] [PubMed] [Google Scholar]
- Smith A., Orr-Weaver T. (1991). The regulation of the cell cycle during Drosophila embryogenesis: the transition to polyteny. Development 112, 997-1008 [DOI] [PubMed] [Google Scholar]
- Spradling A., Leys E. (1988). Slow replication fork movement during Drosophila chorion gene amplification. In Cancer Cells (ed. Kelly T., Stillman B.), pp. 305-309 Cold Spring Harbor: Cold Spring Harbor Laboratory Press; [Google Scholar]
- Steinemann M. (1981). Chromosomal replication in Drosophila virilis. III. Organization of active origins in the highly polytene salivary gland cells. Chromosoma 82, 289-307 [DOI] [PubMed] [Google Scholar]
- Stevaux O., Dimova D. K., Ji J. Y., Moon N. S., Frolov M. V., Dyson N. J. (2005). Retinoblastoma family 2 is required in vivo for the tissue-specific repression of dE2F2 target genes. Cell Cycle 4, 1272-1280 [DOI] [PubMed] [Google Scholar]
- Su T. T., O'Farrell P. H. (1998). Chromosome association of minichromosome maintenance proteins in Drosophila endoreplication cycles. J. Cell Biol. 140, 451-460 [DOI] [PMC free article] [PubMed] [Google Scholar]
- Sun J., Deng W. M. (2005). Notch-dependent downregulation of the homeodomain gene cut is required for the mitotic cycle/endocycle switch and cell differentiation in Drosophila follicle cells. Development 132, 4299-4308 [DOI] [PMC free article] [PubMed] [Google Scholar]
- Sun J., Deng W. M. (2007). Hindsight mediates the role of notch in suppressing hedgehog signaling and cell proliferation. Dev. Cell 12, 431-442 [DOI] [PMC free article] [PubMed] [Google Scholar]
- Szuplewski S., Sandmann T., Hietakangas V., Cohen S. M. (2009). Drosophila Minus is required for cell proliferation and influences Cyclin E turnover. Genes Dev. 23, 1998-2003 [DOI] [PMC free article] [PubMed] [Google Scholar]
- Thomer M., May N. R., Aggarwal B. D., Kwok G., Calvi B. R. (2004). Drosophila double-parked is sufficient to induce re-replication during development and is regulated by Cyclin E/CDK2. Development 131, 4807-4818 [DOI] [PubMed] [Google Scholar]
- Treisman J., Follette P., O'Farrell P., Rubin G. (1995). Cell proliferation and DNA replication defects in a Drosophila MCM2 mutant. Genes Dev. 9, 1709-1715 [DOI] [PubMed] [Google Scholar]
- Tseng G. C., Oh M. K., Rohlin L., Liao J. C., Wong W. H. (2001). Issues in cDNA microarray analysis: quality filtering, channel normalization, models of variations and assessment of gene effects. Nucleic Acids Res. 29, 2549-2557 [DOI] [PMC free article] [PubMed] [Google Scholar]
- Tyagi S., Herr W. (2009). E2F1 mediates DNA damage and apoptosis through HCF-1 and the MLL family of histone methyltransferases. EMBO J. 28, 3185-3195 [DOI] [PMC free article] [PubMed] [Google Scholar]
- Tyagi S., Chabes A. L., Wysocka J., Herr W. (2007). E2F activation of S phase promoters via association with HCF-1 and the MLL family of histone H3K4 methyltransferases. Mol. Cell 27, 107-119 [DOI] [PubMed] [Google Scholar]
- Ullah Z., Kohn M. J., Yagi R., Vassilev L. T., Depamphilis M. L. (2008). Differentiation of trophoblast stem cells into giant cells is triggered by p57/Kip2 inhibition of CDK1 activity. Genes Dev. 22, 3024-3036 [DOI] [PMC free article] [PubMed] [Google Scholar]
- Ullah Z., Lee C. Y., Lilly M. A., DePamphilis M. L. (2009). Developmentally programmed endoreduplication in animals. Cell Cycle 8, 1501-1509 [DOI] [PMC free article] [PubMed] [Google Scholar]
- van den Heuvel S., Dyson N. J. (2008). Conserved functions of the pRB and E2F families. Nat. Rev. Mol. Cell Biol. 9, 713-724 [DOI] [PubMed] [Google Scholar]
- Weiss A., Herzig A., Jacobs H., Lehner C. F. (1998). Continuous Cyclin E expression inhibits progression through endoreduplication cycles in Drosophila. Curr. Biol. 8, 239-242 [DOI] [PubMed] [Google Scholar]
- Wen H., Andrejka L., Ashton J., Karess R., Lipsick J. S. (2008). Epigenetic regulation of gene expression by Drosophila Myb and E2F2-RBF via the Myb-MuvB/dREAM complex. Genes Dev. 22, 601-614 [DOI] [PMC free article] [PubMed] [Google Scholar]
- Weng L., Zhu C., Xu J., Du W. (2003). Critical role of active repression by E2F and Rb proteins in endoreplication during Drosophila development. EMBO J. 22, 3865-3875 [DOI] [PMC free article] [PubMed] [Google Scholar]
- Whittaker A. J., Royzman I., Orr-Weaver T. L. (2000). Drosophila double parked: a conserved, essential replication protein that colocalizes with the origin recognition complex and links DNA replication with mitosis and the down-regulation of S phase transcripts. Genes Dev. 14, 1765-1776 [PMC free article] [PubMed] [Google Scholar]
- Zhong W., Feng H., Santiago F. E., Kipreos E. T. (2003). CUL-4 ubiquitin ligase maintains genome stability by restraining DNA-replication licensing. Nature 423, 885-889 [DOI] [PubMed] [Google Scholar]
- Zielke N., Querings S., Rottig C., Lehner C., Sprenger F. (2008). The anaphase-promoting complex/cyclosome (APC/C) is required for rereplication control in endoreplication cycles. Genes Dev. 22, 1690-1703 [DOI] [PMC free article] [PubMed] [Google Scholar]
Associated Data
This section collects any data citations, data availability statements, or supplementary materials included in this article.