Abstract
The use of bone structural allografts for reconstruction following tumor resection is widespread, although successful incorporation and regeneration remains uncertain. There are few noninvasive methods to fully assess the progress of graft incorporation. Computed tomography and MRI provide information on the morphology of the graft/host interface. Limited information is also available from DXA and ultrasound. Only few techniques can provide information on the metabolic status of the graft, such as the mineral and matrix composition of the regenerated tissue that may provide early indications of graft success or failure. To address this challenge, we discuss here the implementation of Raman spectroscopy for in-vivo assessment of allograft implantation in a rat model.
An array of optical fibers was developed to allow excitation and collection of Raman spectra through the skin of rat at various positions around the rat’s tibia. The system is calibrated against locally-constructed phantoms that mimic the morphology, optics and spectroscopy of the rat. The system was evaluated by carrying out transcutaneous Raman measurement on rat. Bone mineral and matrix Raman bands are successfully recovered. This new technology provides a non-invasive method for in-vivo monitoring of bone graft osseointegration.
Introduction
Tissues transplantation has been used for many decades to repair or replace damaged and diseased anatomical structures.1 Bone is one of the most commonly transplanted tissues in human with an estimated 500,000 – 600,000 bone grafting procedures performed annually in the United Sates and over 2.2 million worldwide.1–3 Bone grafts are frequently used for a variety of repair and reconstructive approaches in orthopaedic procedures. These include reconstruction of skeletal defects, such as traumatic bone loss, comminuted fractures delayed unions and non-unions, corrective osteotomy, spinal surgery for segmental fusion or deformity, bone loss following failed joint arthoplasty and malignant bone tumor resection.1,4–6
Bone grafts are classified as autografts, allografts, xenografts, synthetic grafts and combination grafts.1,7 The successful incorporation of these grafts depends on biological interactions between the recipient bed and the donor tissue along with the stimulation of osteogenic activities to the transplantation site to facilitate bone healing.4
Amongst bone grafts, allografts are easily accessible, however, they are characterized by failure rates that range between 16–50%, 4,8 which mainly occur due to limited incorporation, resorption and infections.8 Also, the sequence of biological events following allograft transplantation is not fully understood. 4,9–10 This is due in part to the reliance on radiological methods for assessing the outcome of graft incorporation in addition to the histological and physiological measures of bone-graft biology, 11 which provide limited information. For example, computed tomography (CT) and magnetic resonance imaging (MRI) provide information on the morphologic and geometric properties of the graft or graft/host interface. Limited information is also available from dual X-ray absorptiometry (DXA) and ultrasound. There are few techniques to provide information on metabolic status of the grafts, such as the mineral and matrix composition of the regenerated tissue that may provide early indication of graft success or failure. Consequently, there is significant need for non-invasive methods to monitor the fate of these construct. Such method should utilize no ionizing radiation and should be a lower cost procedure to facilitate routine monitoring of the time course of bone graft incorporation for early detection of failure and subsequent provision of appropriate remedial action.
Raman spectroscopy can provide information about molecular structures and composition of bone, such as protein secondary structure and bone mineral crystallinity. It is also known that Raman signatures for bone mineral and matrix change with tissue health and pathologies and can be monitored non-invasively in-vivo. The use of fiber-optic probes for transcutaneous Raman spectroscopy of bone tissue have been demonstrated and bone Raman signal has been recovered through 1 – 4 cm of overlaying soft tissue.12–16 Therefore a combination of appropriate fiber-optic probes assembly with Raman spectroscopy could provide a suitable method for monitoring the progress of graft incorporation in a non-invasive and in-vivo fashion.
In this paper, we present the design and implementation of a non-invasive Raman spectroscopy technique for in-vivo assessment of allograft incorporation in animal model. A custom designed fiber-optic probe consisting of nineteen illumination and fifty collection fibers was positioned around the perimeter of the leg of a Sprague-Dawley rat using a customized fiber-optic probe holder such that excitation and collection of Raman spectra through the skin at various positions around the tibia was achieved. Geometrically accurate gelatin-based rat tissue phantoms that mimic the morphology, optics and spectroscopy of the rat were locally constructed and used for calibrating the Raman-probes system. The system was further evaluated by carrying out Raman measurements on rat cadavers to recover Raman parameters such as mineral/matrix, carbonate/phosphate and cross-linking. These experiments are intended to demonstrate proof-of-principle that the system could be used to monitor bone graft incorporation in an animal model.
Methodology
Fiber-optic probes for non-invasive Raman spectroscopy
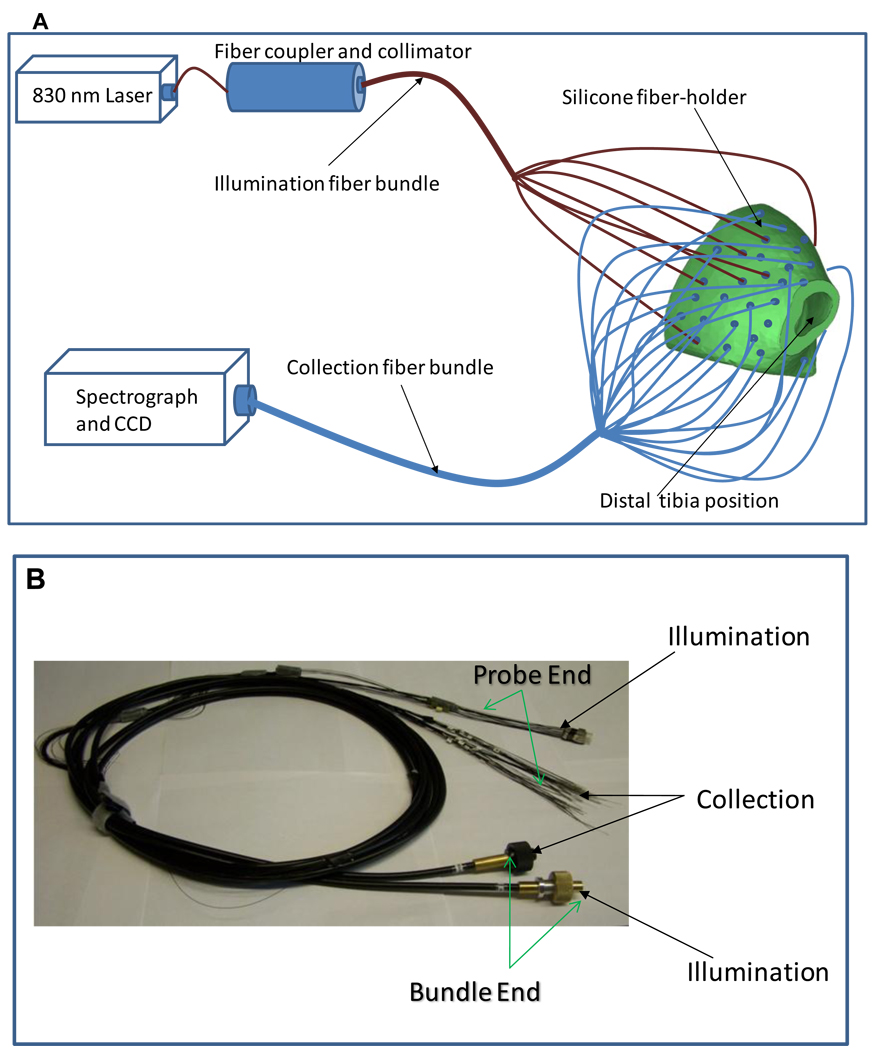
The schematic representation of the experimental set-up for transcutaneous Raman measurement on rat leg is shown in Figure 1. A custom designed fiber-optic probe was constructed (FiberTech Optica Inc., Kitchener ON, Canada) for transcutaneous Raman measurement on a rat leg. The probe consisted of 19 illumination fibers, with each having a core diameter of 200 µm and 50 collection fibers with each having a core diameter of 100 µm. All fibers were individually encased and each terminated in a stainless steel ferrule that provided an outer diameter of 220 µm for each fiber terminus (see Figure 1b). The stainless steel ferrules were 3 cm long to allow for easy insertion into pre-determined positions in a custom designed probe holder (see Figure 1a). The probe holder is cast in silicone from molds that were made from micro-CT images of a Sprague-Dawley rat using rapid prototyping system (Z Corporation, Burlington, MA). The probe holder conforms to the geometry and orientation of the rat leg and forms a bracelet on the rat’s leg with all the fibers in contact with the skin of the rat. Both the collection and illumination fibers were separately bundled at the distal ends (see Figure 1b) into a linear array for the collection fibers and a disc for the illumination fibers. The geometry allows easy coupling of the collection fibers to the Raman spectrograph and the illumination fibers to the laser source (see Figure 1a). A PhAT probe fiber connector assembly (RXN-FCA-PhAT, Kaiser Optical Systems Inc., Ann Arbor, MI) was used to couple the collection fiber bundle to the Raman spectrograph. The Raman instrument used for the study is an axial-transmissive Raman spectrograph that is equipped with an 830 nm excitation laser, a 256×1024 front illuminated CCD (pixel size = 16 × 16 µm) and optimized for collection of near-infrared signal (RamanRxn1, Kaiser Optical Systems Inc.). The excitation laser light with peak power = 600 mW at the output end (Innovative Photonics Solutions, Monmouth Junction, NJ) was coupled through a 100 µm core diameter fiber into the illumination fiber bundle (see Figure 1a). This assembly was used for the transcutaneous Raman measurement.
Figure 1.
(A) A schematic representation of the set-up of fiber bundles for transcutaneous Raman measurement on rat leg; the excitation laser (power = 600 mW) are coupled through an optical fiber (core diameter = 100 µm) and a collimator to the illumination fiber bundle, which distributed the laser into the illumination fibers located at different points around the circumference of the rat leg (Not all fibers are shown). The resulting Raman signals are collected from different points around the circumference of the rat leg and coupled to the Raman spectrograph. Both illumination and collection fibers are held in contact with the skin of the rat by the silicone probe holder, which surrounds the rat leg. (B) Photograph of the fiber bundles; the fibers are arranged to form a linear array at the bundle end to allow coupling to the spectrograph. The illumination fibers are arranged in a disc at the bundle end for coupling to the laser source.
Rat tissue phantom for probe calibration
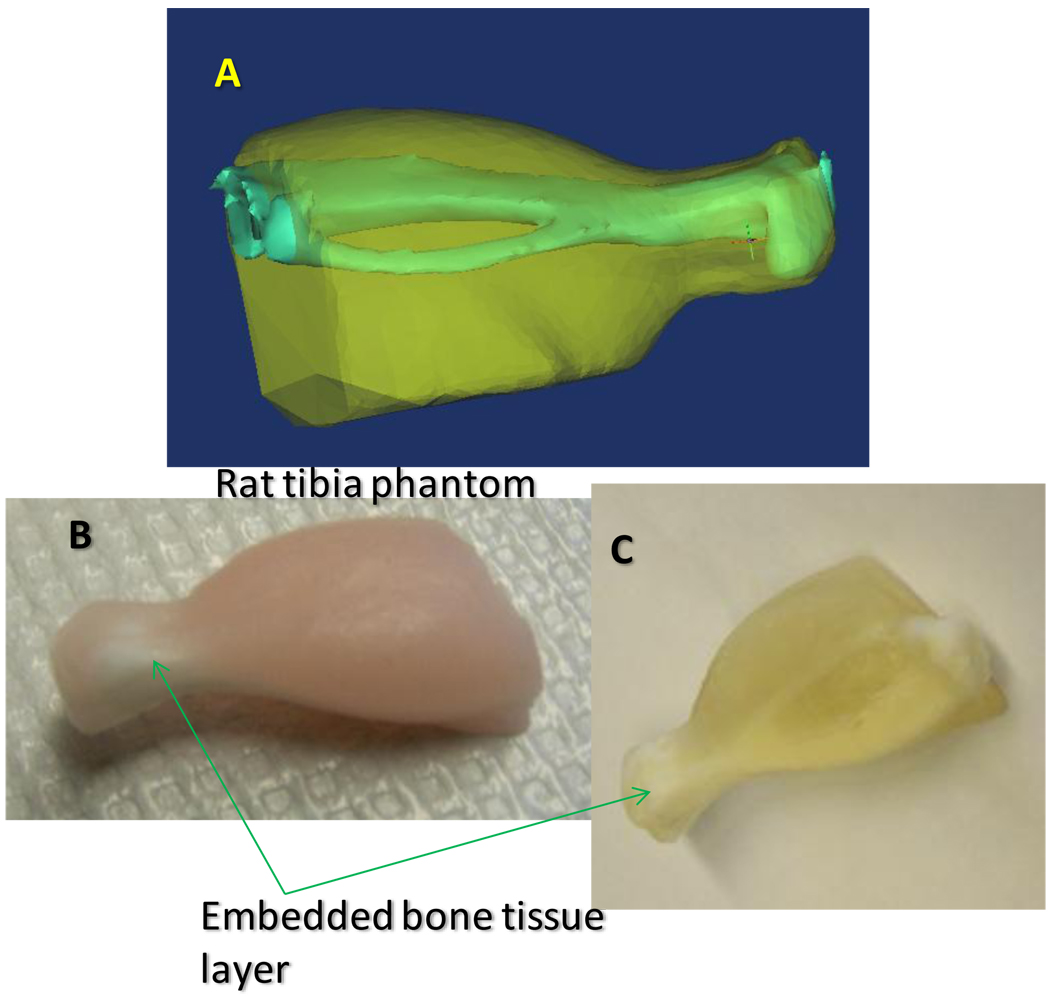
Geometrically accurate gelatin-based solid tissue phantoms representing the hind limb of Sprague-Dawley rat (rat tibia) were constructed (see Figure 2) using silicone rubber molds in a multi-step casting process. A detailed procedure for the preparation of the tissue phantom is described elsewhere. Briefly, the silicone molds were produced in a three-step casting process: first, a 3D model of the hind limb of Sprague Dawley rat was generated from micro-CT images of a Sprague-Dawley rat and printed into a plaster model using a Spectrum Z510 rapid prototyping instrument (Z Corporation, Burlington, MA). The plaster print was replicated as a urethane mold using room temperature vulcanization. The silicone mold was cast from the urethane mold and used for preparing the multi-layer rat tissue phantom. The phantom (see Figure 2) incorporates materials that model bone mineral Raman scatter (hydroxyapatite, bone matrix and connective tissue Raman scatter (gelatin), light scattering (IntraLipid), light absorption (hemoglobin) and fluorescence (hemoglobin and hydroxyapatite).
Figure 2.
(A) Computer rendering of the rat tissue phantom showing the rat bone (tibia and fibula) and the soft tissue modeled from CT scans of the rat leg. (B) Rat tissue phantom reconstructed from the rat leg model. (C) Rat tissue phantom reconstructed as in (B) but with hemoglobin and intralipid omitted to make the bone layer visible.
Raman instrument calibration for data processing
Calibration spectra from a neon emission source and NIST-traceable white light source were collected on the Raman spectrograph using the Kaiser HoloSpec Calibration Accessory (HCA, Kaiser Optical Systems Inc., Ann Arbor, MI). Each spectral measurement was 10 image frames with each image frame acquired with exposure time of 60 second. A Raman spectrum of Teflon was also collected for calibration and validation of the laser wavelength. White light images were individually collected from all collection fibers and intensity profiles of each collection fiber were determined using a least-squares fitting of the measured white-light image. Raman spectrum of silica was also measured by reflecting the excitation laser from a roughened aluminum surface.
Raman measurement on rat cadaver
Cadaveric Sprague-Dawley rats were acquired from the University of Michigan Medical School. Transcutaneous Raman measurements were carried out on the rats using the previously calibrated Raman probe. Prior to Raman measurement, a rat leg was shaved to remove hair and to expose the skin. Glycerol was topically applied on the skin as an optical clearing agent and allowed to soak for 15 minutes, after which a fresh layer of glycerol was again applied. The probe holder with the probe was positioned on the rat’s leg to excite and collect Raman signal from the rat’s tibia. After transcutaneous Raman measurement was completed, the rat’s leg was dissected and the overlaying soft tissue was removed to expose the bone. Raman spectra of the exposed bone were collected using a pen-like fiber optic probe.17
Raman data processing
All Raman images acquired including calibration spectra consisted of 256×1024 CCD pixels and were collected using the Andor Solis software. The images were converted to ASCII format and imported into MATLAB (The Math Works, Natick, MA) for processing using in-house written software codes.18 Preprocessing of the images involved correction for cosmic rays, 19 image transformation using a technique adapted from the field of remote sensing,20–21 which allow the application of a polynomial field curvature correction to remove imperfections in the camera rotation, as well as dispersion nonlinearities and slit-image curvature. Following image transformation, intensity detected at each fiber was determined using a least-squares fitting of measured white calibration images. Silica contributions to the measured spectra were removed using a derivative subtraction of the measured silica spectra.22
Results and discussion
The first rule of thumb in transcutaneous Raman measurement is the creation of adequate offset (spatial offset) between the excitation laser and the point of Raman signal collection.13,23–24 The degree of spatial offset determines the depth from which Raman signal can be collected.24 Provision was made for this important factor in our instrument design by employing a silicone-based probe holder that facilitated easy placement of illumination and collection fibers in various positions for bone Raman recovery. Another important consideration for successful Raman signal recovery is minimizing silica contribution to the measured Raman spectra. Although, silica background can be subtracted from the measured spectra, it is also important that the detection system is not saturated by such interference signals. The used of a 100 µm core collection fibers (length = 3 meter) in our probe design reduced silica contribution to keep signal acquisition within the dynamic range of the detection system. Generally, Raman signals are weak and could easily be obscured by stray-light, therefore all our Raman measurements were performed in dark rooms.
Raman spectroscopy of phantom
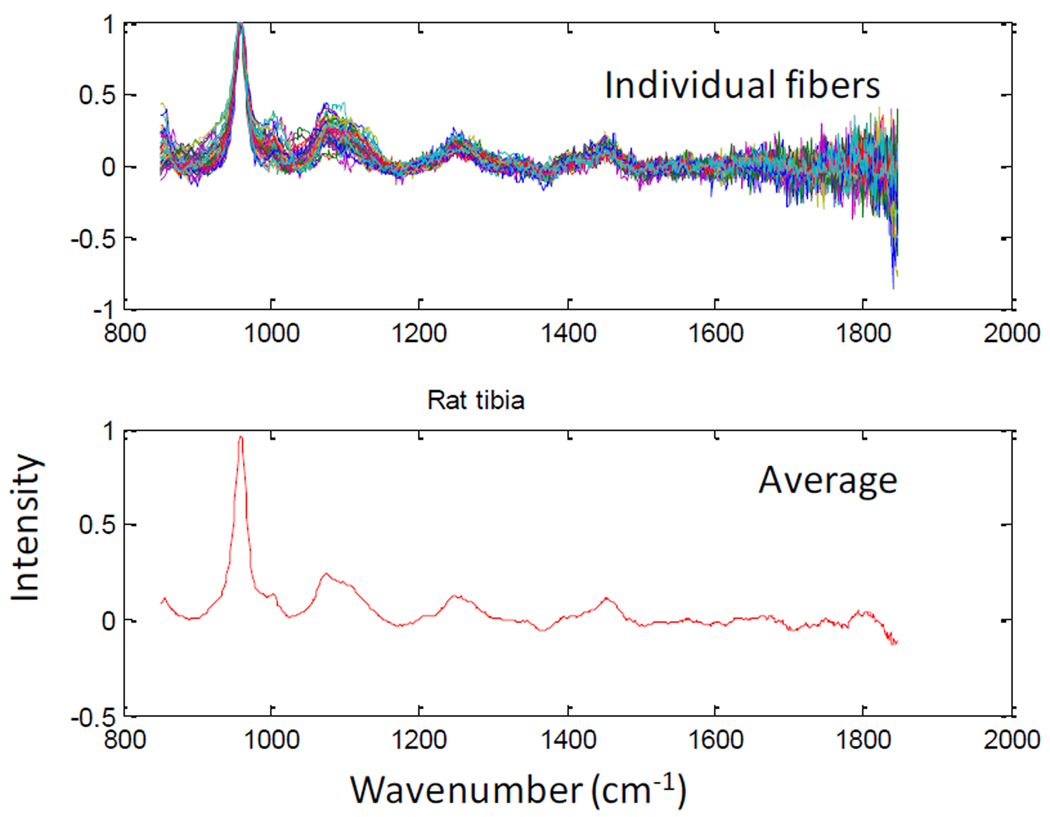
Transcutaneous Raman measurements were carried out on the rat tissue phantom to recover Raman signal from the hydroxyapatite bone layer (see Figure 2) for each fiber. This was done iteratively to optimize fiber positions for efficient recovery of Raman signal by following three steps; first, Raman spectra collected from all fibers were carefully examined for bone mineral Raman signal/peak; second, fibers with low or no mineral signatures were re-positioned and the first step above was repeated; third, fiber re-positioning continued until all fibers generated reasonable level of bone mineral Raman signal/peak using the phosphate P-O stretch at 960 cm−1 as a marker. The optimal positions registered were marked and used for all Raman measurements. Figure 3 showed a typical transcutaneous Raman spectra acquired from the phantom for individual fibers as well as the averaged spectrum. A careful examination of Figure 3 reveals major bone Raman signals representing the hydroxyapatite layer of the phantom. The phosphate ν1 band at 960 cm−1 is clearly visible with high intensity as well as the phenylalanine ring breathing mode at 1002 cm−1. Other bands of interest are the amide1 band (1665 cm−1 and 1685 cm−1) from the gelatin matrix and the carbonate band at 1070 cm−1 from the carbonated hydroxyapatite. This result demonstrated successful recovery of deep tissue Raman bands through transcutaneous Raman measurement and provides a suitable platform for subsurface in-vivo Raman measurement on animals.
Figure 3.
Rat tissue phantom transcutaneous Raman spectra: Top Pane; Recovered Raman spectra of bone-layer from individual fibers (47 fibers shown). Bottom Pane; Averaged spectrum of all fibers showing major Raman bands.
Raman spectroscopy of rat cadaver
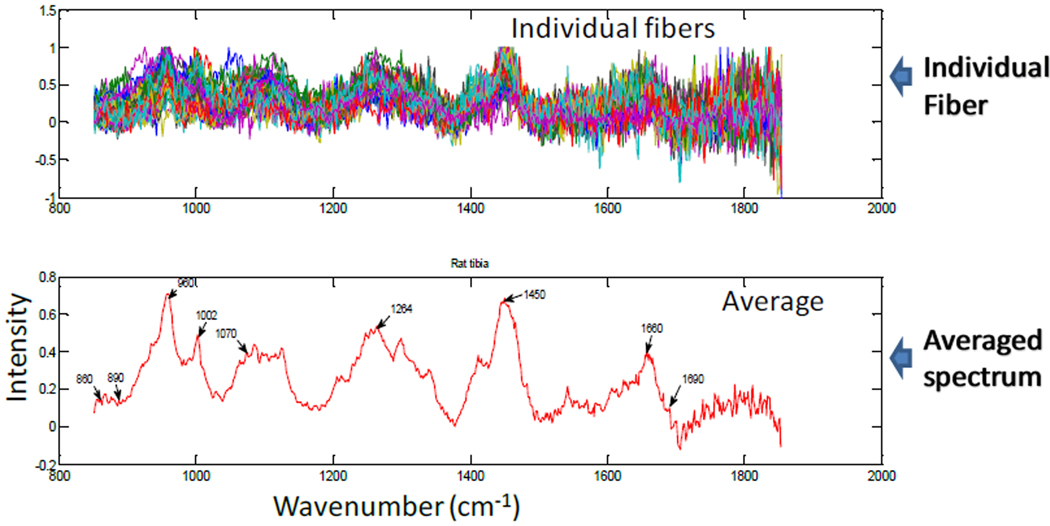
The fiber-optic Raman probe with the fibers in their optimized positions in the probe holder was used for transcutaneous Raman measurements on the tibia of a rat cadaver. The recovered bone Raman signal for the individual fibers is shown in Figure 4. Although, Raman bands arising from soft tissue lipids including the 1300 cm−1 and 1435 cm−1 are evident in the spectra (see Figure 4 bottom pane), the bone mineral Raman bands (phosphate ν1 at 960 cm−1 and carbonate at 1070 cm−1) and matrix bands (collagen protein ring breathing at 1002 cm−1, proline/hydroxyproline at 860 cm−1 and 890 cm−1, amide 1 at 1660 cm−1 and 1690cm−1 and CH2 wagging at 1450 cm−1) are clearly visible, thus indicating successful recovery of bone Raman signals. As stated previously, Raman spectroscopy was also carried out on the exposed bone (rat tibia) after the overlying tissue was removed. The result of the exposed bone Raman measurement is shown in Figure 5. The bone mineral Raman bands at 960 cm−1 appeared similar to those from the transcutaneous measurement, and as expected, the spectrum (see Figure 5) revealed differences mainly in the region 1100 cm−1 – 1800 cm−1, which corresponds to the organic matrix of bone. This region contains bands that were interferences from overlying tissue components in the transcutaneous measurement (see Figure 4). Further examination of the transcutaneous Raman data using principal components analysis should improve the recovery of bone Raman bands and resolve the matrix bands as well. These results suggest that commonly reported bone mineral metrics (such as; mineral/matrix, phosphate/carbonate, crosslink ratio and crystallinity),25–26 which define the quality and metabolic status of bone can be extracted and used to monitor bone quality during fracture site healing.
Figure 4.
Rat cadaver transcutaneous Raman: Top Pane; Recovered Raman spectra of bone tissue from individual fibers (47 fibers shown). Bottom Pane; Averaged spectrum of all fibers showing major bone tissue Raman signals
Figure 5.
Raman spectra of excised rat tibia: Top Pane; Recovered Raman spectra of bone tissue from individual fibers (47 fibers shown). Bottom Pane; Averaged spectrum of all fibers showing major bone tissue Raman signals
Conclusion
A non-invasive Raman spectroscopy technique suitable for in-vivo Raman measurements on animals was developed. Geometrically accurate rat tissue phantoms that mimic the optics and spectroscopy of rat’s limb were also developed to calibrate the non-invasive Raman system for use with rat legs. Our preliminary results show successful recovery of transcutaneous bone Raman signals and demonstrate proof-of-principle that fiber-optic Raman probes can be used to monitor bone quality non-invasively. This technology will be further explored in rat models to monitor the progress of bone graft osseointegration.
Acknowledgements
The authors acknowledge support of this work through National Institutes of Health grant R01AR055222 and R01AR056646, and the Michigan Institute for Clinical and Health Research.
References
- 1.Kaveh K, Ibrahim R, Abu Bakar MZ, Ibrahim TA. J. Anim. Vet. Adv. 2010;9:1055. [Google Scholar]
- 2.Lewandrowski KU, Gresser JD, Wise DL, Trantolo DJ. Biomaterials. 2000;21:757. doi: 10.1016/s0142-9612(99)00180-5. [DOI] [PubMed] [Google Scholar]
- 3.Laurencin C, Khan Y, El-Amin SF. Expert. Rev. Med. Devices. 2006;3:49. doi: 10.1586/17434440.3.1.49. [DOI] [PubMed] [Google Scholar]
- 4.Graham SM, Leonidou A, Aslam-Pervez N, Hamza A, Panteliadis P, Heliotis M, Mantalaris A, Tsiridis E. Expert. Opin. Biol. Therapy. 2010;10:885. doi: 10.1517/14712598.2010.481669. [DOI] [PubMed] [Google Scholar]
- 5.Yu WD, Bernstein RM, Watts HG. Spine. 2003;28:699. doi: 10.1097/01.BRS.0000051922.96037.C4. [DOI] [PubMed] [Google Scholar]
- 6.Hanna SA, Sewell MD, Aston WJS, Pollock RC, Skinner JA, Cannon SR, Briggs TWR. J. Bone Joint Surg. Brit.Vol. 2010;92B:867. doi: 10.1302/0301-620X.92B6.23449. [DOI] [PubMed] [Google Scholar]
- 7.Bauer TW, Muschler GF. Clin. Orthop. Relat. Res. 2000:10. [PubMed] [Google Scholar]
- 8.Horowitz MC, Friedlaender GE. J. Bone Joint Surg. Am. 1991;73A:1157. [PubMed] [Google Scholar]
- 9.Tomford WW. J. Bone Joint Surg. Am. 1995;77A:1742. doi: 10.2106/00004623-199511000-00017. [DOI] [PubMed] [Google Scholar]
- 10.Gocke DJ. Clin. Orthop. Relat. Res. 2005:17. doi: 10.1097/01.blo.0000167252.33787.a4. [DOI] [PubMed] [Google Scholar]
- 11.Friedlander GE, Strong DM, Tomford WW, Mankin HJ. Orthop. Clin. North Am. 1999;30:583. doi: 10.1016/s0030-5898(05)70111-5. [DOI] [PubMed] [Google Scholar]
- 12.Schulmerich MV, Dooley KA, Morris MD, Vanasse TM, Goldstein SA. J. Biomed. Opt. 2006;11:060502. doi: 10.1117/1.2400233. [DOI] [PubMed] [Google Scholar]
- 13.Matousek P. Appl. Spectrosc. 2006;60:1341. doi: 10.1366/000370206778999102. [DOI] [PubMed] [Google Scholar]
- 14.Schulmerich MV, Cole JH, Dooley KA, Kreider JM, Goldstein SA, Morris MD. J. Biomed. Opt. 2008;2:021108. doi: 10.1117/1.2892687. [DOI] [PMC free article] [PubMed] [Google Scholar]
- 15.Schulmerich MV, Cole JH, Dooley KA, Morris MD, Kreider JM, Goldstein SA, Srinivasan S, Pogue BW. J.Biomed. Opt. 2008;2:020506. doi: 10.1117/1.2904940. [DOI] [PMC free article] [PubMed] [Google Scholar]
- 16.Srinivasan S, Schulmerich M, Cole JH, Dooley KA, Kreider JM, Pogue BW, Morris MD, Goldstein SA. Opt. Express. 2008;16:12190. doi: 10.1364/oe.16.012190. [DOI] [PMC free article] [PubMed] [Google Scholar]
- 17.Esmonde-White FWL, Esmonde-White KA, Morris MD. Proc. SPIE. 2010;7548:75484D. [Google Scholar]
- 18.Esmonde-White FWL, Schulmerich MV, Esmonde-White KA, Morris MD. Proc. SPIE. 2009;7166:716605. doi: 10.1117/12.809436. [DOI] [PMC free article] [PubMed] [Google Scholar]
- 19.Horne K. Publ. Astron. Soc. Pac. 1986;98:609. [Google Scholar]
- 20.Richards JA, Jia X. 3rd ed. Berlin, Germany: Springer-Verlag; 1999. [Google Scholar]
- 21.Schowengerdt RA. 2nd ed. San Diego, CA: Academic Press; 1997. [Google Scholar]
- 22.Banerjee S, Li D. Appl. Spectrosc. 1991;6:1047. [Google Scholar]
- 23.Schulmerich MV, Dooley KA, Vanasse TM, Goldstein SA, Morris MD. Appl. Spectrosc. 2007;61:671. doi: 10.1366/000370207781393307. [DOI] [PubMed] [Google Scholar]
- 24.Schulmerich MV, Cole JH, Kreider JM, Esmonde-White F, Dooley KA, Goldstein SA, Morris MD. Appl. Spectrosc. 2009;63:286. doi: 10.1366/000370209787599013. [DOI] [PMC free article] [PubMed] [Google Scholar]
- 25.Morris MD. Emerging Raman Applications and Techniques in Biomedical and Pharmaceutical Fields. Springer; 2009. p. 347. [Google Scholar]
- 26.Gourion-Arsiquaud S, Burket JC, Havill LM, DiCarlo E, Doty SB, Mendelsohn R, van der Meulen MCH, Boskey AL. J. Bone Miner. Res. 2009;24:1271. doi: 10.1359/JBMR.090201. [DOI] [PMC free article] [PubMed] [Google Scholar]


