Abstract
The goal of this study was to determine if impairments detected by the test of variables of attention (TOVA) may be used to predict early attention complaints and memory impairments accurately in a clinical setting. We performed a statistical analysis of outcomes in a patient population screened for attention deficit hyperactivity disorder or attention complaints, processing errors as measured by TOVA and the Wechsler Memory Scale (WMS-III) results. Attention deficit disorder (ADD) checklists, constructed using the Diagnostic and Statistical Manual of Mental Disorders 4th Edition criteria, which were completed by patients at PATH Medical, revealed that 72.8% of the patients had more than one attention complaint out of a total of 16 complaints, and 41.5% had more than five complaints. For the 128 males with a significant number of ADD complaints, individuals whose scores were significantly deviant or borderline (SDB) on TOVA, had a significantly greater number of attention complaints compared with normals for omissions (P < 0.02), response time (P < 0.015), and variability (P < 0.005), but not commissions (P > 0.50). For males, the mean scores for auditory, visual, immediate, and working memory scores as measured by the WMS-III were significantly greater for normals versus SDBs on the TOVA subtest, ie, omission (P < 0.01) and response time (P < 0.05), but not variability or commissions. The means for auditory, visual, and immediate memory scores were significantly greater for normals versus SDBs for variability (P < 0.045) only. In females, the mean scores for visual and working memory scores were significantly greater for normals versus SDBs for omissions (P < 0.025). The number of SDB TOVA quarters was a significant predictor for “impaired” or “normal” group membership for visual memory (P < 0.015), but not for the other three WMS-III components. For males, the partial correlation between the number of attention complaints and the number of SDB TOVA quarters was also significant (r = 0.251, P < 0.005). For the 152 females with a significant number of attention complaints, no significant differences between SDBs and normals were observed (P > 0.15). This is the first report, to our knowledge, which provides evidence that TOVA is an accurate predictor of early attention complaints and memory impairments in a clinical setting. This finding is more robust for males than for females between the ages of 40 and 90 years.
Keywords: attention complaints, dementia, TOVA, Wechsler Memory Scale
Introduction
This study suggests that the test of variables of attention (TOVA), a continuous performance test used to measure the speed and accuracy of attentional processing,1 may correlate with memory impairments as measured by certain memory tests, such as the Wechsler Memory Scale (WMS-III)2 and early attention complaints selected from the Diagnostic and Statistical Manual of Mental Disorders 4th Edition (DSM-IV) in a clinical setting. It is a follow-up to our previous work on declines in neurological processing speed and correlations with TOVA errors.3
Attention deficit hyperactivity disorder (ADHD), a common disorder among children, is a neuropsychiatric disorder characterized by symptoms of inattention, impulsivity, psychomotor delays, and hyperactivity. Some studies estimate that 3%–4% of the adult population have symptoms of ADHD. More importantly, a much larger percentage of adults have attention complaints, ie, they meet some of the DSM-IV criteria for attention deficit disorder (ADD)/ADHD but do not have ADD/ADHD with and without comorbid psychiatric disorders. This population is the focus of our investigation.4
Attention problems have a multimodal dimension. ADHD, including attention complaints, is related to memory, as well as neuroelectrophysiologic and psychiatric factors. Attention complaints also have advanced psychiatric disease (Axis I) sources (DSM-IV), such as anxiety disorders, depression, and schizophrenia.5 Sometimes the sources of attention problems include variations in intelligence quotient.6 There is also a well documented genetic component to ADHD. Up to this point, research has identified genetic associations with candidate genes from known biologic pathways.7
TOVA has been successfully used to diagnose ADHD and its many subtypes.8–12 These subtypes include pure inattention, impulsivity, attentional failure due to depression or psychomotor retardation, and inconsistency. Each of these four categories correlates with a TOVA error subscale. The TOVA will be described in more detail in the methods section, but for the purposes of this discussion, the four subtypes of TOVA errors will be generalized here as follows: omission errors occurring when the patient fails to respond to the appropriate stimulus; commission errors occurring when the patient responds to an inappropriate stimulus; slowed reaction time occurring when there is an unusually long delay in response time after the appropriate stimulus is displayed; and response time variability as a measure of the consistency between all response times for the patient. In terms of describing the subtypes of ADHD, pure inattention correlates with omission errors on the TOVA, impulsivity correlates with commission errors, psychomotor retardation correlates with slowed reaction time, and inconsistency correlates with high variability in response time on the TOVA.
Interestingly, diagnoses of ADHD are becoming increasingly prevalent among the adult population, and have been designated “adult ADD” (AADD), although there are some differences, including a less pronounced or absent hyperactivity component.13,14 AADD is recognized as a disability under US federal legislation, including the Rehabilitation Act of 1973 and the Americans with Disabilities Act (National Institutes of Health).
The high prevalence of AADD and attention complaints is manifested in accidental injury statistics. In 2004 there were over 112,000 deaths due to such injuries, which are by their very nature tied to issues of attention.15 From an employer’s point of view, such accidents and other forms of risk to self and others incur high human capital costs. Adequate diagnosis and treatment would lead to greater productivity.16 The increasing need for early recognition and understanding of these problems prompted our present investigation.
Our earlier work involved correlation of increased P300 brain wave latency (a measure of neurologic processing speed that may be used to measure cognitive decline) with abnormalities on the TOVA.3 As a follow-up to our findings, we performed a statistical analysis to correlate outcomes on the TOVA with a modified DSM-IV screening tool (attention complaints), with additional correlations made with memory function as determined by the WMS-III. We intended to determine the utility of TOVA in ADD recognition, and to establish a link between attention complaints and the beginnings of cognitive decline.
Methods
Participant population and testing conditions
A total of 975 patients were evaluated in this study, comprising 465 males and 510 females, with an average age of 50.0 and 51.6 years, respectively. Participants were primarily Caucasian, although Black, Asian, and Hispanic participants were included as well. These patients were selected from an outpatient private clinical practice (medical and neuropsychiatric) and research foundation in New York City, where the TOVA is used regularly in the standard cognitive testing battery. Two hundred eighty patients who had been screened for attention complaints using a modified 16-item checklist derived from the DSM-IV diagnostic criteria for ADHD were included. These patients may or may not have been screened with TOVA and/or WMS-III. Additionally, patients with WMS-III and/or TOVA results were included in the study. In total, 344 females with TOVA results were included, as well as 324 with WMS-III results. One hundred and fifty-eight females had both WMS-III and TOVA results for a total of 510 females included. Three hundred and twelve males with TOVA results, as well as 310 with WMS-III results, were included. One hundred and fifty-seven males had both TOVA and WMS-III results for a total of 465 males included.
Patients were made aware that their results would be kept confidential and signed consent forms approved by the institution review board for participation in this study were obtained. All subjects were part of an ongoing study involving brain electrical activity mapping and aging research, which received institutional review board and ethics board approval from the PATH Foundation. Psychometric technicians trained inWMS-III and TOVA administration and interpretation via tutorial conducted the tests. All test interpreters were blinded to other patient results.
TOVA measurement
This study assessed 656 patients with TOVA data between 40 and 89 years of age. The TOVA was developed in the 1960s, with the current version Number 7 being released in 1997. The TOVA is an age- and gender-normalized17 computer-based assessment of inattention, approximately 21.6 minutes in duration. Its lengthy run allows it to measure attention deficits effectively. The subject is situated in front of a computer screen where a flashing square is presented for 1/10th of a second in two-second intervals. The square will flash in either the top portion of a larger square or it will be presented in the bottom portion of the square. If the small box appears on the top, it is labeled as the target and, if at the bottom, it is labeled as the nontarget. Each time the target box appears, the person is instructed to press a small microswitch as soon as they see the target. Every time the nontarget box appears, the person is instructed to refrain from pressing the microswitch. Omission errors signify the number of times the patient failed to click the microswitch when the target was presented. Commission errors signify the number of times the patient clicked the microswitch at the incorrect time, (ie, “jumped the gun”). Response time is the amount of time it took the patient to press the microswitch when the target was presented. Variability is the consistency of the patient’s response times.
In order for a score in any of the four measurement categories to be significantly deviant on the TOVA, it must be less than −1.33 (ie, 1.33 standard deviations [SD] below normal).18,19 We will use the term “significantly deviant or borderline” (SDB) on the TOVA to indicate any score between −1.00 and −1.33. Subjects scoring above −1.0 were considered “normal”.
Memory assessment on Wechsler Memory Scale
WMS-III is the most widely used standardized measure to assess memory abilities. This study assessed 634 patients 40–89 years of age with WMS-III data. Results are organized into summary index scores, reflecting verbal, visual, immediate, and working memory, and interpreted accordingly. A score of 130 and above demonstrates very superior abilities; 120–129 is considered superior; 110–119 demonstrates high average abilities; 90–109 indicates average abilities; an index score of 80–89 is considered low average; 70–79 indicates borderline abilities; and ≤69 demonstrates memory impairment. These scores were standardized based on a sample of 1250 individuals aged 16–89 years.2
Statistical analysis
Spearman rank correlations were used to check for associations of the TOVA error subtypes, stratified by age decade and correlating with the WMS-III components. Spearman correlations that resulted in an r-squared of 0.10 or more were considered to have clinical significance.
Comparison of males and females for TOVA scores were made by using Mann–Whitney tests, and for clinical measures by using Student’s t-tests, with P < 0.05 considered to be statistically significant.
For each TOVA error subtype, comparisons using unpaired Student’s t-tests (with P < 0.05 considered significant) of age and WMS-III were made between subjects who had an SD (below −1.33) score versus subjects that scored 0 or better. Using this approach, subjects with a TOVA quarter (that is, a quarter of the duration of the test during which a particular score is observed in any of the four error subtypes) that produced a “marginal” score (below 0 but not significantly deviant in any of the four error subtypes) were excluded so that comparisons of impaired versus normal subjects as defined by the TOVA quarter score could be performed. Partial age-controlled correlations between the number of ADD complaints in self report assessments, TOVA, and WMS-III scores, were performed.20
TOVA and WMS-II scores
This analysis was performed separately for males and females aged 40–89 years. Unpaired Student’s t-tests were performed to check for differences between SDBs and normals for each TOVA quarter, comparing scores for each of the four WMSIII index measures. Also, WMS-III scores were classified as “impaired” (< 80) versus “normal” (> 99) so that Chi-square tests could be performed. Finally, the total number of SDB TOVA quarters was calculated. Partial correlations between the number of SDB quarters and WMS-III scores, controlling for age, were performed, and logistic regression was performed to determine if the number of SDB quarters was a significant predictor for WMS-III “impaired” or “normal” group membership. Also, one-way analyses of variance (ANOVAs) with post hoc Bonferroni-adjusted Student’s t-tests were performed to check if the means of WMS-III scores were significantly different for the total number of SDB TOVA quarters.
Attention deficit disorder complaints and TOVA
This analysis was performed separately for males and females aged 40–89 years. Mann–Whitney U tests comparing the number of ADD complaints for SDBs versus normals for each TOVA quarter were performed. Also, the correlation between the number of SDB TOVA quarters and the number of ADD complaints controlling for age was calculated.
Attention deficit disorder complaints and WMS-II index scores
This analysis was performed separately for males and females aged 40–89 years. Partial correlations between the number of ADD complaints and WMS-III scores controlling for age were performed. Also, Mann–Whitney U tests comparing the number of ADD complaints for “impaired” versus “normal” for each WMS-III component were performed.
Results
TOVA and WMS-II scores
Males
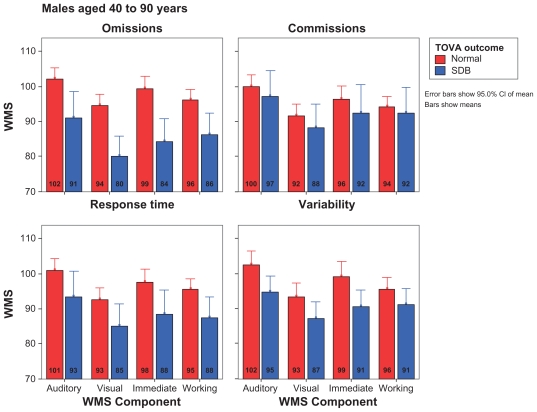
Of 157 males with both TOVA and WMS-III data, the means for auditory, visual, immediate, and working memory scores were significantly greater for normals versus SDBs for omission errors (P < 0.010) and response time (P < 0.050). The mean scores for auditory, visual, and immediate memory scales were significantly greater for normals versus SDBs for variability (P < 0.045). No significant differences among WMS-III scores were observed for normals versus SDBs for commission errors (P > 0.30, Table 1, Figures 1 and 2).
Table 1.
Wechsler Memory Scale data
| Age group | Female |
Male |
||||
|---|---|---|---|---|---|---|
| Subjects (n) | Mean | Standard deviation | Subjects (n) | Mean | Standard deviation | |
| Auditory | ||||||
| 40–49 | 69 | 102.03 | 19.96 | 89 | 101.15 | 17.5 |
| 50–59 | 89 | 106.82 | 19.26 | 67 | 103.4 | 18.24 |
| 60–69 | 69 | 102.09 | 19.21 | 66 | 100.21 | 19.1 |
| 70–93 | 99 | 92.71 | 20.51 | 88 | 94.69 | 20.27 |
| Total | 326 | 100.52 | 20.45 | 310 | 99.6 | 19.01 |
| Visual | ||||||
| 40–49 | 69 | 100.03 | 18.23 | 89 | 96.17 | 17.63 |
| 50–59 | 89 | 104.4 | 20.28 | 67 | 96.24 | 20.69 |
| 60–69 | 69 | 96.1 | 18.91 | 66 | 90.95 | 17.43 |
| 70–93 | 98 | 89.98 | 20.38 | 89 | 85.38 | 19.05 |
| Total | 325 | 97.36 | 20.32 | 311 | 91.99 | 19.18 |
| Immediate memory | ||||||
| 40–49 | 69 | 99.16 | 22.01 | 89 | 98.9 | 20.5 |
| 50–59 | 89 | 106.37 | 21.95 | 67 | 100.31 | 18.91 |
| 60–69 | 69 | 99.43 | 26.24 | 66 | 95.89 | 20.01 |
| 70–93 | 99 | 89.34 | 22.19 | 89 | 88.6 | 19.88 |
| Total | 326 | 98.21 | 23.81 | 311 | 95.62 | 20.34 |
| Working memory | ||||||
| 40–49 | 69 | 94.68 | 16.79 | 89 | 96.66 | 13.73 |
| 50–59 | 88 | 94.73 | 17.16 | 67 | 97.07 | 20.69 |
| 60–69 | 69 | 90.39 | 14.96 | 65 | 96.46 | 15.01 |
| 70–93 | 98 | 90.1 | 19.07 | 89 | 90.64 | 15.61 |
| Total | 324 | 92.4 | 17.32 | 310 | 94.98 | 16.4 |
Figure 1.
Weschler Memory Scale comparisons across test of variables of attention (TOVA) outcome in males.
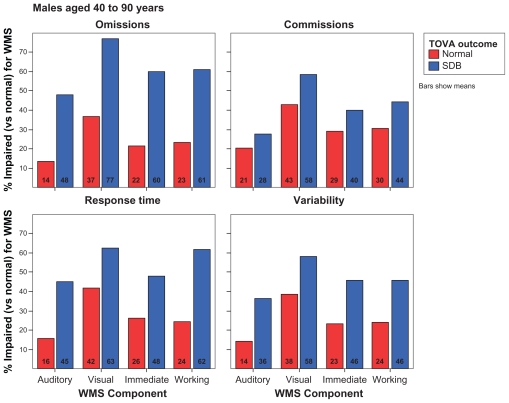
Figure 2.
Classification of Weschler memory impairment across test of variables of attention (TOVA) outcome in males.
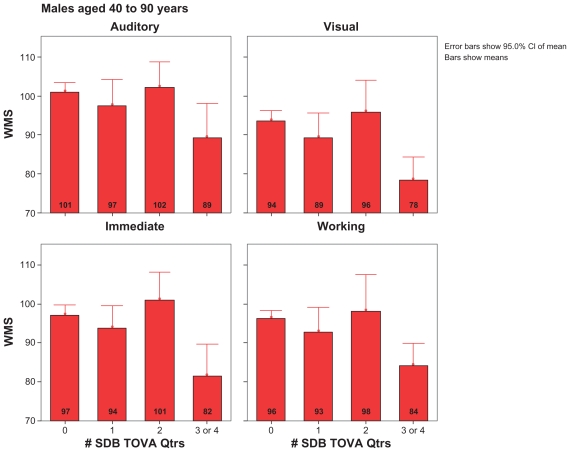
The Chi-square results generally reflected the t-test results. For example, males who were SDB for omission subtests were more likely than normals to be classified as “impaired” on the auditory, visual, immediate, and working memory sections of the WMS-III (P < 0.001). The number of SDB TOVA quarters (or quarters of the duration of the test during which SDB TOVA errors were observed) was significantly correlated with auditory (r = −0.224, P < 0.005), visual (r = −0.269, P < 0.001), compiling immediate memory ability (r = −0.275, P < 0.001), as well as with the working memory subtest (r = −0.205, P < 0.010) groups (Figure 3).
Figure 3.
Weschler Memory Scale comparisons across number of significantly deviant or borderline test of variables of attention (TOVA) quarters in males.
Females
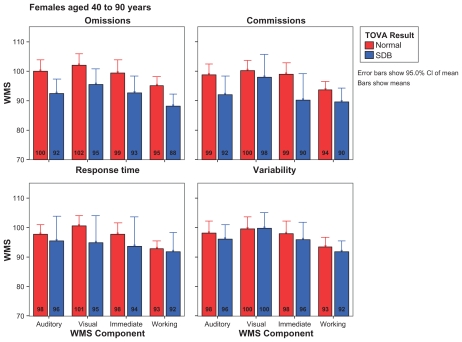
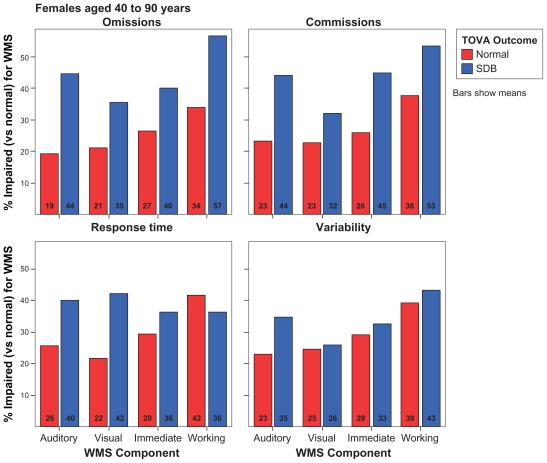
Of 158 females with both WMS-III and TOVA data, the means for visual and working memory scores were significantly greater for normals versus SDBs for omissions (P < 0.025). Also, females who were SDB for omission were more likely to be classified as “impaired” for visual memory (P < 0.010) than normals, and females who were SDB for commission errors were more likely to be classified as “impaired” for visual (P < 0.035) and immediate memory (P < 0.045) than normals. No other significant differences were observed for females (P > 0.05, Table 1, Figures 4 and 5).
Figure 4.
Weschler Memory Scale comparisons across test of variables of attention (TOVA) outcome in females.
Figure 5.
Classification of Weschler memory impairment across test of variables of attention (TOVA) outcome in females.
Abbreviation: SDB, significantly deviant or borderline
The number of SDB TOVA quarters was not significantly correlated with any of the WMS-III components, and all r-squares were less than 0.02 (P > 0.08).
Attention deficit disorder complaints and TOVA
Of 280 patients evaluated, 63.2% reported attention complaints as measured by self report checklists designed using the DSM-IV diagnostic criteria for ADD and ADHD, and 38.6% reported four or more complaints out of 16 (Table 3). Therefore, we decided to utilize this population to determine whether there were associations with ADD complaints, TOVA quarters and subtests, and WMS-III index scores.
Table 3.
Attention complaint data
| Age | None | Mild 1–3 | Moderate 4–6 | Severe ≥7 | Total |
|---|---|---|---|---|---|
| Females | |||||
| 40–49 | 12 (26.7%) | 15 (33.3%) | 9 (20.0%) | 9 (20.0%) | 45 |
| 50–59 | 19 (40.4%) | 9 (19.1%) | 8 (17.0%) | 11 (23.4%) | 47 |
| 60–69 | 9 (36.0%) | 11 (44.0%) | 3 (12.0%) | 2 (8.0%) | 25 |
| 70–93 | 25 (71.4%) | 5 (14.3%) | 2 (5.7%) | 3 (8.6%) | 35 |
| All ages | 65 (42.8%) | 40 (26.3%) | 22 (14.5%) | 25 (16.4%) | 152 |
| Males | |||||
| 40–49 | 11 (22.0%) | 10 (20.0%) | 14 (28.0%) | 15 (30.0%) | 50 |
| 50–59 | 6 (16.7%) | 10 (27.8%) | 9 (25.0%) | 11 (30.6%) | 36 |
| 60–69 | 9 (47.4%) | 3 (15.8%) | 6 (31.6%) | 1 (5.3%) | 19 |
| 70–93 | 12 (52.2%) | 6 (26.1%) | 2 (8.7%) | 3 (13.0%) | 23 |
| All ages | 38 (29.7%) | 29 (22.7%) | 31 (24.2%) | 30 (23.4%) | 128 |
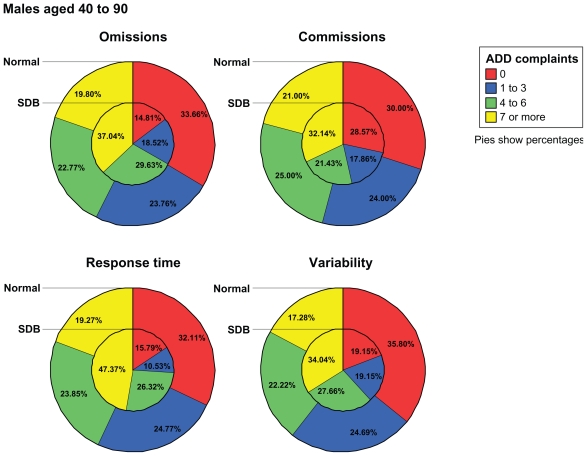
For the 128 males with a recorded number of ADD complaints, SDBs had a significantly greater number of ADD complaints compared with normals for omissions (P < 0.020), response time (P < 0.015), and variability (P < 0.005), but not commissions (P > 0.50). The partial correlation between the number of ADD complaints and the number of SDB TOVA quarters was also significant (r = 0.251, P < 0.005). For the 152 females with a recorded number of ADD complaints, no significant differences between SDBs and normals were observed (P > 0.15). The partial correlation between the number of ADD complaints and the number of SDB TOVA quarters was also not significant, with r-squares less than 0.02 (P > 0.15) (Figure 6).
Figure 6.
Number of ADD complaints across TOVA outcome in males. Percentages represent the percentage of males in each group having 0, 1–3, 4–6, and ≥ 7 ADD complaints for a total of 100% per group. Percentages for males with normal TOVAs are shown in the outer part of the pie cluster, and percentages for males with significantly deviant or borderline TOVAs are shown in the inner part of the pie cluster.
Abbreviations: ADD, attention deficit disorder; SDB, significantly deviant or borderline; TOVA, test of variables of attention.
Number of attention complaints and WMS-II
Of the 78 males with attention complaints and WMS-III data, no significant partial correlations were observed between the number of ADD complaints reported for WMS-III scores, with all r-squares less than 0.02 (P > 0.35). The number of ADD complaints reported was not significantly different for “impaired” versus “normal” for any of the four WMS-III components (P > 0.70). Of the 68 females with data for both measures, no significant partial correlations were observed between the number of ADD complaints reported or WMS-III scores, with all r-squares less than 0.05 (P > 0.070). The number of ADD complaints reported was not significantly different for “impaired” versus “normal” for any of the four WMS-III components (P > 0.40, Table 3).
Discussion
In a previous paper, Braverman and Blum19 evaluating 1506 subjects (71% Caucasian, 21% Black, 7% Hispanic, and less than 1% Asian) found that the P300 latency event-related potential was an accurate predictor of cognitive decline. They further went on to show that increased P300 latency has a positive association with decreased attentional processing as measured by TOVA. In the present study we took the concept of early detection to another important level, ie, correlating attentional processing with the standard subjective measures of attention disorders (complaints) and memory function as measured by WMS-III.
We found no reliable connection between ADD and WMS-III complaints. However, decreased TOVA performance correlated more reliably with both WMS-III and ADD complaints (more obvious in males than in females). Thus, our findings seem to indicate that involvement of the TOVA in ADD diagnostics leads to a more accurate description of specific impairments experienced by the patient.
Genetic studies appear to confirm our associations of memory function and TOVA results. While many genes are involved in ADHD, the etiology involves dopamine function. Stimulants, such as methylphenidate, seem to calm ADHD patients by indirectly influencing the dopaminergic system (DRD2, DRD3, and DRD4, among other genes, as mentioned earlier).21–23 Interestingly, the DRD4 exon III repeat region has been shown to have a significant correlation with TOVA results. Patients with this DRD4 exon III repeat region performed poorly on several areas of the TOVA.24 Dopamine also seems to play an important role in working memory, which is another dimension of attention and was measured on the WMS-III.25
Conclusion
Our results suggest that TOVA may be an important screening indicator (and more valuable than self report scales) of early impaired attentional processing problems, serving as an objective rather than a subjective indicator. This may lead to a better way to predict attention problems early on, and thus develop early intervention methodologies for the prevention and treatment of ADHD and other attentional disorders, including dementia. Furthermore, the established correlations with poor performance on the TOVA (not necessarily accompanied by attention complaints) and increased P300 latency, as well as decreased memory functions as measured by WMS-III, imply that impaired attentional processing may be indicative of the beginnings of cognitive decline. Our research supports the importance of a multimodal approach to diagnosis and evaluation of which specific functions are impaired. Additional scientific evidence is required, including genetic/genomic determinants in both diagnosis and therapeutic targeting.
Table 2.
TOVA data: TOVA Quarter Significantly Deviant or Borderline (SDB)
| Gender | Age by Decade | Omission | Commissions | Response Time | Variability | |
|---|---|---|---|---|---|---|
| Females | 40–49 | % SDB | 30.30% | 16.16% | 12.12% | 41.41% |
| with TOVA data | 99 | 99 | 99 | 99 | ||
| with SDB TOVA | 30 | 16 | 12 | 41 | ||
| 50–59 | % SDB | 31.91% | 19.15% | 11.70% | 46.81% | |
| with TOVA data | 94 | 94 | 94 | 94 | ||
| with SDB TOVA | 30 | 18 | 11 | 44 | ||
| 60–69 | % SDB | 33.33% | 19.05% | 15.87% | 36.51% | |
| with TOVA data | 63 | 63 | 63 | 63 | ||
| with SDB TOVA | 21 | 12 | 10 | 23 | ||
| 70–93 | % SDB | 32.95% | 23.86% | 22.73% | 42.05% | |
| with TOVA data | 88 | 88 | 88 | 88 | ||
| with SDB TOVA | 29 | 21 | 20 | 37 | ||
| Total | % SDB | 31.98% | 19.48% | 15.41% | 42.15% | |
| with TOVA data | 344 | 344 | 344 | 344 | ||
| with SDB TOVA | 110 | 67 | 53 | 145 | ||
| Males | 40–49 | % SDB | 20.95% | 20.95% | 31.43% | 51.43% |
| with TOVA data | 105 | 105 | 105 | 105 | ||
| with SDB TOVA | 22 | 22 | 33 | 54 | ||
| 50–59 | % SDB | 28.40% | 29.63% | 8.64% | 48.15% | |
| with TOVA data | 81 | 81 | 81 | 81 | ||
| with SDB TOVA | 23 | 24 | 7 | 39 | ||
| 60–69 | % SDB | 35.59% | 32.20% | 13.56% | 33.90% | |
| with TOVA data | 59 | 59 | 59 | 59 | ||
| with SDB TOVA | 21 | 19 | 8 | 20 | ||
| 70–93 | % SDB | 28.36% | 17.91% | 11.94% | 26.87% | |
| with TOVA data | 67 | 67 | 67 | 67 | ||
| with SDB TOVA | 19 | 12 | 8 | 18 | ||
| Total | % SDB | 27.24% | 24.68% | 17.95% | 41.99% | |
| with TOVA data | 312 | 312 | 312 | 312 | ||
| with SDB TOVA | 85 | 77 | 56 | 131 |
Acknowledgment
This paper was presented at the Alzheimer’s Association International Conference on Prevention of Dementia held on June 18–21, 2005, in Washington, DC.
Footnotes
Disclosure
The authors report no conflicts of interest in this work.
References
- 1.Greenberg LM. Test of Variables of Attention. Los Alamitos, CA: The Tova Company; 1991. [Google Scholar]
- 2.Wechsler D. Wechsler Adult Intelligence Scale. 3rd edition. San Antonio, TX: Psychological Corporation; 1997. [Google Scholar]
- 3.Braverman ER, Chen TJ, Schoolfield J, et al. Delayed P300 latency correlates with abnormal test of variables of attention (TOVA) in adults and predicts early cognitive decline in a clinical setting. Adv Ther. 2006;23:582–600. doi: 10.1007/BF02850047. [DOI] [PubMed] [Google Scholar]
- 4.Walker AJ, Shores EA, Trollor JN, Lee T, Sachdev PS. Neuropsychological functioning of adults with attention deficit hyperactivity disorder. J Clin Exp Neuropsychol. 2000;22:115–124. doi: 10.1076/1380-3395(200002)22:1;1-8;FT115. [DOI] [PubMed] [Google Scholar]
- 5.Kooij JJ, Aeckerlin LP, Buitelaar JK. Functioning, comorbidity and treatment of 141 adults with attention deficit hyperactivity disorder (ADHD) at a psychiatric outpatient department. Ned Tijdschr Geneeskd. 2001;145:1498–1501. [PubMed] [Google Scholar]
- 6.Murphy KR, Barkley RA, Bush T. Executive functioning and olfactory identification in young adults with attention deficit-hyperactivity disorder. Neuropsychology. 2001;15:211–220. doi: 10.1037//0894-4105.15.2.211. [DOI] [PubMed] [Google Scholar]
- 7.Neale BM, Lasky-Su J, Anney R, et al. Genome-wide association scan of attention deficit hyperactivity disorder. Am J Med Genet B Neuropsychiatr Genet. 2008;147B:1337–1344. doi: 10.1002/ajmg.b.30866. [DOI] [PMC free article] [PubMed] [Google Scholar]
- 8.Riccio CA, Garland BH, Cohen MJ. Relations between the test of variables of attention (TOVA) and the Children’s Memory Scale (CMS) J Atten Disord. 2007;11:167–171. doi: 10.1177/1087054706295653. [DOI] [PubMed] [Google Scholar]
- 9.Weyandt LL, Mitzlaff L, Thomas L. The relationship between intelligence and performance on the test of variables of attention (TOVA) J Learn Disabil. 2002;35:114–120. doi: 10.1177/002221940203500203. [DOI] [PubMed] [Google Scholar]
- 10.Llorente AM, Voigt R, Jensen CL, Fraley JK, Heird WC, Rennie KM. The test of variables of attention (TOVA): Internal consistency (Q(1) vs Q (2) and Q (3) vs Q (4)) in children with attention deficit/hyperactivity disorder [ADHD]) Child Neuropsychol. 2007;3:1–9. doi: 10.1080/09297040701563578. [DOI] [PubMed] [Google Scholar]
- 11.Wada N, Yamashita Y, Matsuishi T, Ohtani Y, Kato H. The test of variables of attention (TOVA) is useful in the diagnosis of Japanese male children with attention deficit hyperactivity disorder. Brain Dev. 2000;22:378–382. doi: 10.1016/s0387-7604(00)00168-6. [DOI] [PubMed] [Google Scholar]
- 12.Forbes GB. Clinical utility of the test of variables of attention (TOVA) in the diagnosis of attention-deficit/hyperactivity disorder. J Clin Psychol. 1998;54:461–476. doi: 10.1002/(sici)1097-4679(199806)54:4<461::aid-jclp8>3.0.co;2-q. [DOI] [PubMed] [Google Scholar]
- 13.Adler LA, Chua HC. Management of ADHD in adults. J Clin Psychiatry. 2002;63:29–35. [PubMed] [Google Scholar]
- 14.Doyle BB. Understanding and Treating Adults with Attention Deficit Hyperactivity Disorder. 1st edition. Washington, DC: American Psychiatric Publishing; 2006. [Google Scholar]
- 15.National Safety Council. Odds of Death Due to Injury. United States: 2004. [Accessed Jul 24, 2010]. Available from: http://www.nsc.org/research/odds.aspx. [Google Scholar]
- 16.Kessler RC, Lane M, Stang PE, van Brunt DL. The prevalence and workplace costs of adult attention deficit hyperactivity disorder in a large manufacturing firm. Psychol Med. 2008;21:1–11. doi: 10.1017/S0033291708003309. [DOI] [PubMed] [Google Scholar]
- 17.Greenberg LM, Waldman ID. Developmental normative data on the test of variables of attention (TOVA) J Child Psychol Psychiatry. 1993;34:1019–1030. doi: 10.1111/j.1469-7610.1993.tb01105.x. [DOI] [PubMed] [Google Scholar]
- 18.Corman C, Greenberg L. About Attention. Universal Attention Disorders, Inc; 2001. [Accessed Jul 24, 2010]. Available: www.tovatest.com. [Google Scholar]
- 19.Braverman ER, Blum K. P300 (Latency) event-related potential: An accurate predictor of memory impairment. Clin Electroencephalogr. 2003;34:124–139. doi: 10.1177/155005940303400306. [DOI] [PubMed] [Google Scholar]
- 20.Cesana BM, Antonelli P, Chiumello D. Statistical methods for evidence-based medicine: The diagnostic test. Part I. Minerva Anestesiol. 2008;74:431–437. [PubMed] [Google Scholar]
- 21.Brown K. New attention to ADHD genes. Science. 2003;301:160–161. doi: 10.1126/science.301.5630.160. [DOI] [PubMed] [Google Scholar]
- 22.Retz W, Rosler M, Supprian T, Retz-Junginger P, Thome J. Dopamine D3 receptor gene polymorphism and violent behavior relation to impulsiveness and ADHD-related psychopathology. J Neural Transm. 2003;110:561–572. doi: 10.1007/s00702-002-0805-5. [DOI] [PubMed] [Google Scholar]
- 23.Quist JF, Barr CL, Schachar R, et al. The serotonin 5-HT1B receptor gene and attention deficit hyperactivity disorder. Mol Psychiatry. 2003;8:98–102. doi: 10.1038/sj.mp.4001244. [DOI] [PubMed] [Google Scholar]
- 24.Manor I, Tyano S, Eisenberg J, Bachner-Melman R, Kotler M, Ebstein RP. The short DRD4 repeats confer risk to attention deficit hyperactivity disorder in a family-based design and impair performance on a continuous performance test (TOVA) Mol Psychiatry. 2002;7:790–794. doi: 10.1038/sj.mp.4001078. [DOI] [PubMed] [Google Scholar]
- 25.Kimberg DY, D’Esposito M, Farah MJ. Effects of bromocriptine on human subjects depend on working memory capacity. Neuroreport. 1997;8:3581–3585. doi: 10.1097/00001756-199711100-00032. [DOI] [PubMed] [Google Scholar]


