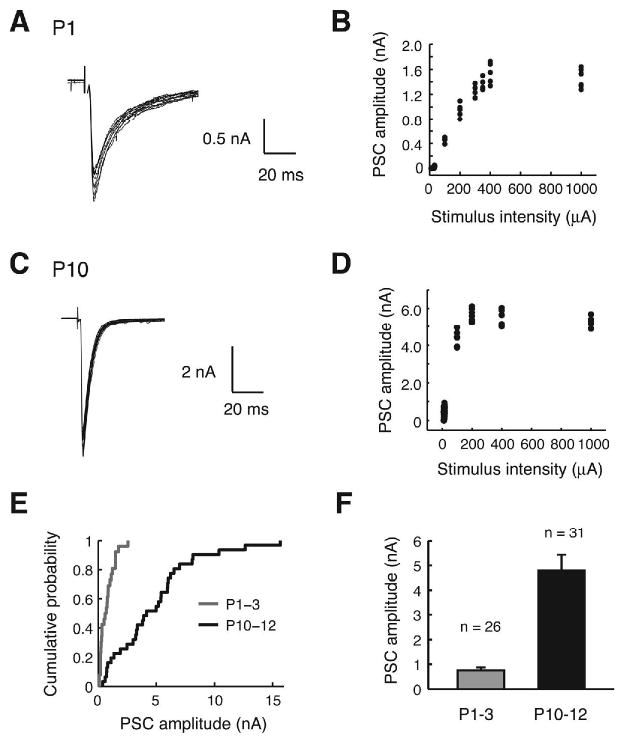
Fig. 2.

Maximal MNTB-evoked responses. (A) Example of maximal PSCs elicited by MNTB stimulation in a P1 LSO neuron (overlay of 10 traces) and (B) the corresponding stimulus-response relationship. (C-D) Example of maximal PSCs in a P10 neuron (overlay of 19 traces) and the corresponding stimulus-response relationship. (E) Cumulative probability distribution of maximal PSC amplitudes. (F) Mean maximal PSC amplitudes in both age groups (P < 0.01, Student's t test).
