Abstract
We describe a noninvasive, quantitative, and tomographic method to visualize lymphocytes within the whole animal. We used positron-emission tomography (PET) to follow the localization of adoptively transferred immune T lymphocytes. Splenic T cells from animals that had rejected a Moloney murine sarcoma virus/Moloney murine leukemia virus (M-MSV/M-MuLV)-induced tumor were marked with a PET reporter gene, injected into tumor-bearing mice, and imaged in a microPET by using a substrate specific for the reporter. Specific localization of immune T cells to the antigen-positive tumor was detected over time, by sequential imaging of the same animals. Naive T cells did not localize to the tumor site, indicating that preimmunization was required. Autoradiography and immunohistochemistry analysis corroborated the microPET data. The method we have developed can be used to assess the effects of immunomodulatory agents intended to potentiate the immune response to cancer, and can also be useful for the study of other cell-mediated immune responses, including autoimmunity.
Efficient elimination of tumors requires the generation of antigen-specific T lymphocytes that migrate to the tumor site, exert lytic activity, and destroy the tumor (1). Cellular immunotherapy protocols are directed at enhancing the migration and activity of antigen-specific T cells (2). Methods used to determine efficacy of treatment rely on invasive techniques such as tumor biopsies, or on detection of cytokines secreted by immune cells or proteins shed by tumor cells (3). These assays provide only a snapshot in time and space, and do not reflect the plasticity of the immune system. Therefore it is critical to develop noninvasive whole-body imaging methods to track the spatial distribution of T cells within the tumor and lymphoid organs. The ability to follow cells of interest within the same living subject would permit assessment of the antitumor response over time.
Positron-emission tomography (PET) (4) is a highly sensitive, quantitative, and noninvasive detection method that provides three-dimensional information within the whole animal or patient. PET imaging using 2-[18F]fluoro-2-deoxy-d-glucose ([18F]FDG), which detects glucose metabolic activity, is used in clinical practice to assess the location(s) of tumors for diagnosis, presurgical staging, and monitoring for recurrence or response to various treatments (5). The development of a microPET scanner (6) enables this technology to be used with small animals such as the mouse. The cells of interest are marked with a PET reporter gene, injected into a test subject, and imaged by injection of the animals with radiolabeled substrates specific for expression of the reporter gene. Repeated imaging of the same animals provides kinetic quantitative information on cell migration, localization and expansion.
We assessed whether microPET imaging technology could be used to follow the specific localization and expansion of adoptively transferred immune T lymphocytes to the antigen-positive tumor and other sites within the animal. We used a well-characterized virally induced sarcoma tumor model (7). One hundred percent of BALB/c or C57BL/6 mice challenged with the Moloney murine sarcoma virus (M-MSV)/Moloney murine leukemia virus (M-MuLV) reject the tumor (8, 9). Rejection is mediated by CD8+ cytolytic T cells, which recognize peptides from the gag and env proteins of M-MuLV (8, 10), and it is more efficient in the presence of CD4+ T cells (11).
Splenic T lymphocytes were transduced with the HSV1-sr39TK PET reporter gene (HSV1, herpes simplex virus 1; TK, thymidine kinase) (12) and transferred into immunodeficient tumor-bearing mice. Tumor-bearing animals were imaged with microPET several times after T cell injection, visualizing marked T cells by using 9-[4-[18F]fluoro-3-(hydroxymethyl)butyl]guanine ([18F]FHBG) (13), a radioactive substrate for sr39TK. We established that transferred immune T cells localized to the tumor, whereas naive T cells were not detected at the tumor site.
The key elements of this method, developed in rodents, are the ability to label cells of interest ex vivo with a reporter gene, reintroduce them into the living animal, and subsequently follow their movement in vivo by a sensitive, noninvasive, quantitative tomographic imaging system.
Materials and Methods
Animals and Cells.
Immunocompetent BALB/c and immunodeficient CB.17SCID/SCID mice were bred and maintained according to the guidelines of the Department of Laboratory Animal Medicine at the University of California, Los Angeles. The murine mastocytoma cell line P815 was passaged in vitro.
Construction of Plasmids.
The 1.0-kb sr39TK fragment was released by EcoRI digestion from the PET23a(+):TK vector and cloned into the promoter-proximal EcoRI site of MSCV-IRES-GFP (MSCV, murine stem cell virus; IRES, internal ribosomal entry site).
Generation of Virus Stocks.
M-MSV/M-MuLV stock was isolated from viable M-MSV/M-MuLV-induced tumors generated in irradiated C57BL/6 mice. The ecotropic retrovirus MSCV-sr39TK-IRES-GFP was generated by transient transfection of HEK- 293T cells. Fresh viral supernatant was used for infection of T lymphocytes.
Generation of Immune and Tumor-Bearing Mice.
Five- to 10-week-old female BALB/c and CB.17SCID/SCID mice were challenged intramuscularly in the left forelimb with M-MSV/M-MuLV in 100 μl. Between 5 × 10⁵ and 1 × 10⁶ control P815 tumor cells were injected s.c. near the right shoulder either in the same animal or in separate animals. Tumor growth was monitored by caliper measurements every 3–4 days. Animals were killed when they were moribund or the tumor had reached a volume of 1.5 cm3.
Purification and Retroviral Infection of T Lymphocytes.
Mouse splenocytes were depleted of B cells by using anti-(α)-B220-coated magnetic beads (Dynal, Great Neck, NY). T cell purity (>90%) was determined by staining with α-B220, α-CD8, and α-CD4 antibodies (1:200, Tricolor-conjugated; Caltag, South San Francisco, CA). Purified T cells were stimulated with plate-bound α-CD3 and α-CD28 (1 μg/ml) at 3 × 10⁶ cells per well in X-VIVO medium (BioWhittaker). Twenty-four to 36 hr after stimulation, the cells were infected (3-hr spin, 1,800 rpm in a Beckman CS-6R tabletop centrifuge, then overnight at 37°C) were infected with MSCV-sr39TK-IRES-GFP virus supernatant (1:1 with culture medium containing 1.6 μg/ml Polybrene). Twenty-four to 36 hr after infection GFP expression and relative infection of CD8+ and CD4+ cell populations were analyzed on a FACScan (Becton Dickinson) using lysis ii software.
Adoptive Transfer of T Lymphocytes.
Between 1.5 × 10⁶ and 5 × 10⁶ sr39TK-marked T lymphocytes were harvested 24–36 hr after infection and injected i.p. into tumor-bearing animals in culture medium. As a source of immune help, 1 × 10⁷ splenocytes depleted of CD8+ T cells (α-CD8 magnetic beads, Dynal) were also injected i.p. More than 90% of CD8+ T cells were depleted in each experiment.
MicroPET Imaging of Tumor-Bearing Animals.
Animals were injected i.v. with ≈200 μCi (1 μCi = 37 kBq) of [18F]FHBG and sedated [ketamine (200 mg/kg) and xylazine (10 mg/kg) i.p.] after 1 hr of uptake and clearance of unbound radioactivity. The animal was placed in a spread prone position on the scanner bed after manual emptying of the bladder to minimize background signal from clearance of unincorporated tracer, and scanned for 56 min (7 bed positions, 8 min per bed). Images were reconstructed by using filtered back projection for quantitation and map algorithm for image presentation. For [18F]FDG scans, the mice were sedated before i.p. injection of ≈200 μCi of [18F]FDG.
Digital Whole-Body Autoradiography (DWBA).
Animals were injected with 2 μCi of 14C-labeled 1-(2′-deoxy-2′-fluoro-β-d-arabinofuranosyl)-5-iodouracil (FIAU) and killed 24 hr later. DWBA was performed by using previously described methods (14). Coronal whole body mouse sections (45 μm thick) were exposed for 7 days and then developed on a Fuji BAS 5000 Imager at 100-μm spatial resolution.
Immunohistochemistry.
Tumors were harvested and fixed in 4% paraformaldehyde/PBS, protected in sucrose, and embedded in OCT medium. Cryostat sections (5 μm) were fixed with acetone and blocked with 0.3% H2O2/PBS followed by 5% normal goat serum. Antibody (α-CD3 or control, 6 μg/ml, PharMingen) was added overnight at 4°C, followed by incubation for 1 hr with goat α-hamster IgG conjugated with horseradish peroxidase (room temperature, 1:500, Jackson ImmunoResearch). Reactions were developed with diaminobenzidine. Sections were counterstained with hematoxylin and mounted.
Results
M-MSV/M-MuLV-Induced Tumors Are Highly Immunogenic and Are Rejected by Immunocompetent Mice.
BALB/c mice injected intramuscularly with the M-MSV/M-MuLV complex develop >1-cm3 tumors by day 10 after virus challenge (11). A strong CD8+ cytolytic T cell response against M-MSV/M-MuLV antigens causes rejection of the tumor by 15–17 days after antigenic challenge. One hundred percent of BALB/c mice reject the tumor and so provide a reliable source of antigen-specific immune T lymphocytes (ref. 9, and data not shown).
Introduction of the PET Reporter Gene by Retroviral Infection.
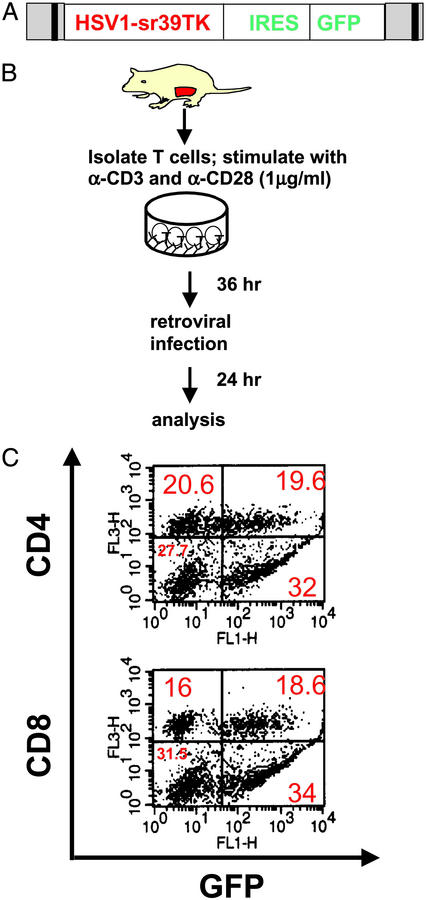
Efficient transfer and expression of the PET reporter gene into the target cell is critical to the success of this method. We introduced the HSV1-sr39TK PET reporter gene into primary splenic T cells by retroviral infection, using a bicistronic MSCV retrovirus carrying the reporter gene in the upstream position, and GFP downstream of an encephalomyocarditis virus IRES (Fig. 1A). HSV1-sr39TK, a mutant of HSV1 TK, displays higher affinity for radioactive acycloguanosines and their derivatives compared with wild-type HSV1 TK (12). Splenic T lymphocytes were harvested from female BALB/c mice 3–5 weeks after tumor rejection, when memory T cells are present in the spleen. Because retroviral integration is dependent on cell division (15), purified T cells were stimulated with α-CD3 and α-CD28, (Fig. 1B) (16), resulting in infection of ≈30–50% of the T cells. Flow cytometry analysis showed that the infected population consisted of both CD8+ (53% GFP+, CD8+) and CD4+ (48% GFP+, CD4+) T cells (Fig. 1C).
Figure 1.
Splenic T cells are efficiently infected with retrovirus. (A) MSCV-sr39TK-IRES-GFP retroviral construct used for infection of total splenic T lymphocytes. (B) Purified T cells were stimulated to proliferate, then infected with the MSCV-sr39TK-IRES-GFP retrovirus. (C) Infected T cells were stained with α-CD4 or α-CD8 antibodies then analyzed by two-color flow cytometry.
T Cell Localization to the Antigen-Positive Tumor Requires Preimmunization.
We predicted that prior exposure to the antigen was required for T cell migration to the tumor site, and that adoptively transferred naive T cells would not localize to the M-MSV/M-MuLV tumor as strongly or rapidly as immune T cells. Immunodeficient CB-17SCID/SCID female mice bearing tumors at least 0.25 cm3 in size were injected i.p. with 3–5 × 10⁶ sr39TK-marked T cells. Because CD4+ T cells are required for efficient tumor rejection (11), 1 × 10⁷ CD8-depleted unmarked splenocytes from the same group of immune animals as above were also injected i.p. as a source of help. No recombinant cytokine was provided.
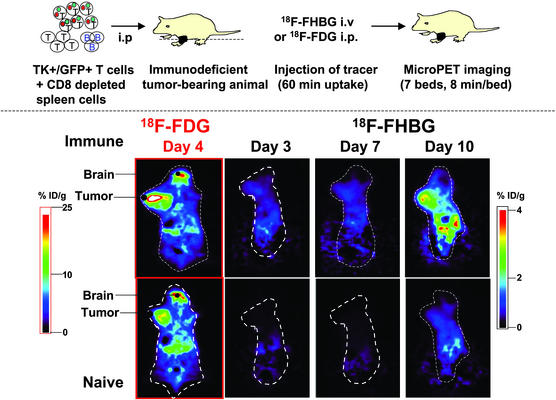
The tumor-bearing animals were imaged several times from day 3 to day 10 after T cell transfer (Fig. 2). Accumulated data were reconstructed (17) and analyzed. The three-dimensional image was divided into 64 coronal (cross-sectional) planes. The images presented are an average of five consecutive planes that showed the strongest signal in the region of interest. A statistically significant signal (as compared with background) was detected at the tumor site in animals that received immune T cells (Fig. 2 Upper Right). In contrast, the tumor signal was not significantly different from background in the animal that received naive T cells (Fig. 2 Lower Right). [18F]FDG imaging (5), which detects glucose uptake activity, showed that both tumors were viable, metabolically active, and similar in size (Fig. 2 Left). Highly metabolic areas in the animal such as the brain are also detected by [18F]FDG imaging. The accumulation of [18F]FHBG increased until day 10 in animals that received immune, but not naive, T cells. At this time, the animals were moribund, and were killed. Ten animals that received immune T cells and five animals that received naive T cells were imaged in five independent experiments on days 10–13. These data show that previously immunized T lymphocytes migrate to the established tumor much faster than naive T lymphocytes, despite the presence of CD4+ T cells that can provide cytokine help.
Figure 2.
Immune, but not naive, lymphocytes migrate to the M-MSV/M-MuLV tumor. Immunodeficient CB-17SCID/SCID female mice were injected with M-MSV/M-MuLV. HSV1-sr39TK-marked T cells (1.5–5 × 10⁶) were injected i.p. when tumors measured at least 0.25 cm3. As a source of help, 1 × 10⁷ CD8+ T cell-depleted splenocytes (immune or naive) were also injected i.p. For microPET imaging, animals were injected i.v. with [18F]FHBG and i.p. with [18F]FDG, then imaged as described in Materials and Methods. [18F]FHBG and [18F]FDG scans were performed at least 24 hr apart. Data were reconstructed by using the map algorithm for image presentation (17) and filtered back projection for quantitation. % ID/g, percent ID per gram of tissue. Each pair of images is an average of five consecutive planes with the greatest signal in the region of interest, and is presented on the same common global maximum. The highest pixel values on the image are shown by white, and the lowest pixel values are shown by black.
Nonphosphorylated [18F]FHBG is removed by hepatobiliary and renal clearance, generating a background signal in the gut and bladder (14). Emptying of the bladder just before the scan reduces the background. Some background signal is also produced from unphosphorylated [18F]FHBG present in cells, as well as minimal phosphorylation of the probe by mammalian TK.
To confirm the location of the signal detected by microPET imaging to the tumor site, digital whole-body autoradiography (DWBA) (14) was performed by using [14C]FIAU as the TK substrate. Because of the longer half-life of the 14C isotope, the abdominal and bladder background signal is greatly reduced by imaging at delayed times, which allows for better clearance of nonphosphorylated substrate. DWBA has a spatial resolution of ≈1003 μm3, in contrast to microPET (≈8 mm3) (14), providing greater discrimination.
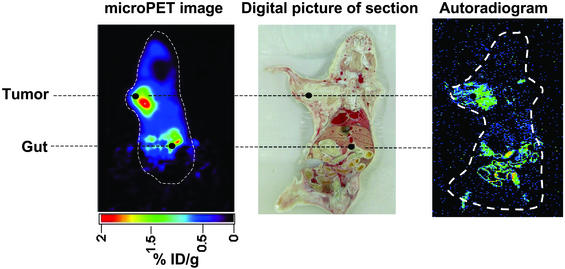
MicroPET imaging using [18F]FHBG on day 12 after T cell transfer detected a significant and specific signal at the tumor site in an animal that received immune T cells (Fig. 3 Left). Cross-sectional whole-body autoradiographic sections of the animal detected a signal in the tumor (Fig. 3 Right). A digital picture of the section (Fig. 3 Center) provided anatomic registration of the autoradiographic signal at the tumor.
Figure 3.
Anatomical corroboration of the microPET signal by digital whole-body autoradiography. On day 11 after T cell transfer, one animal injected with immune T cells was injected in the tail vein with 2 μCi of [14C]FIAU. After 24 hr had been allowed for uptake of the tracer and removal of untrapped radioactivity from the bloodstream and other tissues, a microPET scan using [18F]FHBG was performed on day 12. The PET camera does not detect the incorporated [14C]FIAU. The animal was then killed and processed for autoradiography. When sections were exposed to the imaging plate the [18F]FHBG signal had decayed and did not interfere with the [14C]FIAU signal. (Left) Day 12 microPET image. (Center) Digital picture of the section exposed to the autoradiography plate. (Right) Autoradiogram image exposed to the plate for 7 days. The highest amount of radioactivity present in the image is indicated by red, and the lowest amount of radioactivity present is indicated by black.
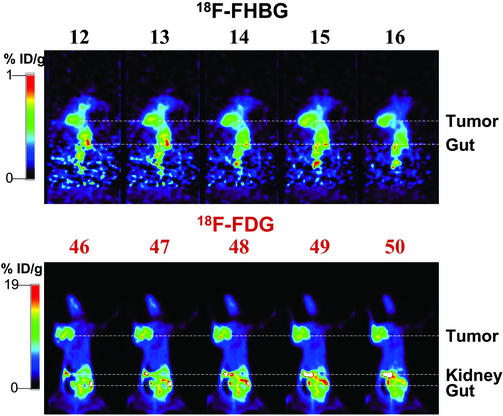
MicroPET data provides a three-dimensional tomographic image, allowing digital reconstruction of the distribution of marked T cells. Thus, differences in signal intensity within a tissue of interest can be determined. Fig. 4 shows images of an animal that bore an M-MSV/M-MuLV-induced tumor and received HSV1-sr39TK-marked immune T cells. Fig. 4 Upper shows five consecutive planes in the middle of the tumor, of an [18F]FHBG image on day 5 after T cell transfer. The magnitude of the signal is slightly decreased from left to right. [18F]FDG imaging of the same mouse (Fig. 4 Lower) shows the size and metabolic activity of the tumor. Comparison of the areas of the tumor outlined by each compound suggests that T cells are distributed throughout the tumor.
Figure 4.
Analysis of sequential panels of [18F]FHBG and [18F]FDG images demonstrating the three-dimensional capacity of microPET analysis. Shown are [18F]FHBG and [18F]FDG images of a M-MSV/M-MuLV tumor-bearing animal injected with immune HSV1-sr39TK-marked T cells. [18F]FHBG (Upper) and [18F]FDG (Lower) images show five consecutive planes in the region of the tumor. Slices through serial planes of interest allow three-dimensional image analysis. Images presented were reconstructed by using the MAP algorithm.
Adoptively Transferred Immune T Lymphocytes Are Detected Only at the Antigen-Positive Tumor.
To determine whether the localization of the M-MSV/M-MuLV-immune T cells was antigen-specific, CB17SCID/SCID mice were injected with the M-MSV/M-MuLV in the left forelimb and with P815 tumor cells s.c. near the right forelimb. P815 is a mastocytoma of DBA/2 origin (H-2d, histocompatible with BALB/c) and is not lysed by murine leukemia virus-specific T cells (18). Both tumors developed 10–14 days after injection and were visible at the time of T cell transfer (0.25–0.5 cm3). Three animals were injected with both the M-MSV/M-MuLV and the P815 tumor, whereas five animals bore either the antigen-positive tumor or the control tumor alone.
A significant signal was visible at the site of the M-MSV/M-MuLV-induced tumor on day 4 after T cell transfer (data not shown), and the signal was much higher by day 13 (Fig. 5). In contrast, the control P815 tumor was not significantly different from background, whether it was present in the same animal (Fig. 5) or in a different animal (data not shown). These data demonstrate that adoptively transferred immune T cells rapidly and preferentially localize to the antigen-positive tumor.
Figure 5.
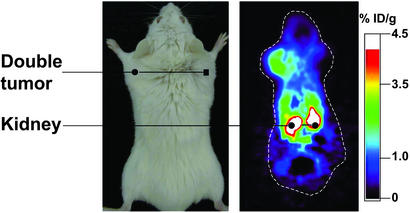
Immune T cells migrate specifically to the antigen-positive tumor. (Right) An animal bearing the M-MSV/M-MuLV-induced tumor and P815 tumor was imaged by using [18F]FHBG. A stronger signal was detected in the antigen-positive tumor. The average of five planes that had the greatest signal in the region of interest is presented. (Left) For orientation, a picture of the tumor-bearing animal.
Visual determination of the magnitude of signal is a qualitative assessment. A strong advantage of PET is the ability to calculate the amount of radioactivity specifically sequestered in a region of interest (ROI), allowing quantitative determinations of differences in signal intensity. The amount of signal at the tumor site was determined by selecting the part of the image encompassing the tumor, and calculating the proportion of radioactivity present there compared with the total amount injected into the animal. ROIs were drawn over the tumor on decay-corrected whole-body coronal (cross-sectional) images, and percent injected dose (ID) per gram of tissue (% ID/g tissue) was calculated as described (19).
The ID/g of tissue accumulated at the M-MSV/M-MuLV tumor in animals that received immune T cells was 2.0 ± 1.25% (Table 1). In contrast, one-fourth as much radioactivity accumulated at the tumor in naive T cell recipients (0.57 ± 0.17% ID/g) or animals bearing the P815 tumor (P < 0.05). The control animals were killed earlier because they usually became moribund much sooner because of the tumor burden. Therefore, a smaller number of animals bearing the control tumor or receiving naive T cells were imaged between days 10 and 13.
Table 1.
Immune T lymphocytes preferentially home to the antigen-positive tumor
| Tumor | % ID/g
|
|
|---|---|---|
| Immune T cells | Naive T cells | |
| M-MSV/M-MuLV | 2.0 ± 1.25 (10) | 0.57 ± 0.17 (5) |
| P815 | 0.5 ± 0.23 (5) | ND |
Compiled from scans performed on days 10–13 after T cell transfer. Number of animals is indicated in parentheses. P = 0.03. ND, not done.
α-CD3 Staining of Tumor Sections Detects T Cells Only in the Antigen-Positive Tumor.
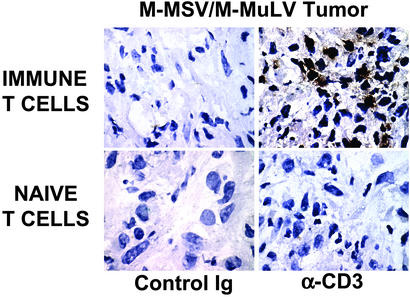
To determine whether the greater microPET signal correlated with a larger number of immune T cells at the tumor site, tumors were harvested at the end of the experiment, and sections were stained with α-CD3 (Fig. 6). Counting of positive cells in five fields (×100 objective) showed 20-fold more T cells in the animals injected with immune T cells compared with the animals injected with naive T cells (Table 2) and 10-fold more T cells present in the antigen-positive versus the antigen-negative tumor (Table 2), confirming the results of the microPET analysis.
Figure 6.
α-CD3 staining of tumor sections detects greater numbers of immune T cells in the antigen-positive tumor. Shown is staining of tumor sections from animals that bore the M-MSV/M-MuLV tumor. More T cells are detected in the tumor of the animal that received immune T cells than in the animal that received naive T cells. (×1,000.)
Table 2.
Immunohistochemical analysis of tumor sections detects immune T cells only at the antigen-positive tumor
| Tumor | No. of T cells
|
|
|---|---|---|
| Immune T cells | Naive T cells | |
| M-MSV/M-MuLV | 22 × 106 ± 0.1 × 10⁶ | 1 × 10⁶ ± 0.01 × 10⁶ |
| P815 | 2.1 × 10⁶ ± 0.01 × 10⁶ | |
The number of cells in five high-power (×100) fields (0.9 mm2 per field) was counted, and the average per mm2 was multiplied by the thickness of the section (5 μm) and the volume of the tumor (mm3). Tumors were harvested on days 10–13 after T cell transfer.
The 10- to 20-fold greater numbers of T cells detected by immunohistochemistry, compared with the 4-fold greater signal detected by microPET imaging, probably reflects the localization to the tumor of unmarked immune splenocytes that were introduced into the animal as a source of help.
Discussion
The trafficking of murine antigen-specific T lymphocytes in vivo has been studied by invasive methods, such as injection and recovery of radiolabeled T cells, and intravital fluorescence microscopy (20–23). These methods require the use of multiple animals to accumulate data at several time points, and provide limited three-dimensional information.
Several noninvasive imaging methods are currently in use. Optical imaging using the cooled charge coupled-device (CCD) camera (24–26) provides two-dimensional images by detection of fluorescence and bioluminescence. This method has recently been used to detect T cells in an experimental model of autoimmunity (27). The optical signal is attenuated by body mass, hemoglobin levels, skin and hair, limiting quantitative analysis of the visible signal. Signal emitted from tissues >1–2 cm beneath the surface cannot be discerned, making quantitation difficult.
The greatest degree of sensitivity and resolution at all depths is provided by radioisotopic imaging methods that provide three-dimensional tomographic information. Single-photon emission computed tomography (SPECT) detects γ-emitting radioisotopes (28, 29). PET detects positron emitters, has 10- to 100-fold more detection sensitivity than SPECT, and offers better spatial resolution (30).
We demonstrate that spatial and kinetic information on the homing and expansion of an immune response can be obtained by using PET imaging. We studied the localization of lymphocytes that had previously seen the tumor antigen because this resembles the situation in a tumor-bearing animal (31). The expansion of immune T lymphocytes at the antigen-positive tumor was detected as an increased microPET signal, corroborated by an increased percent ID of radioactivity per gram of tissue and greater numbers of T cells detected by α-CD3 staining of tumor sections.
Our experiments were conducted in immunodeficient mice and it is possible that in immunocompetent mice T cell localization to the tumor site may display different kinetics and/or strength of signal. Our method can assess whether immunomodulatory agents that potentiate the activity of T cells, such as α-CTLA-4 antibody (32), or their migration, such as IFN-γ (33), will lead to a change in signal intensity detectable by microPET imaging. The ability to rapidly and noninvasively follow the results of modulating the immune system will allow for the design of more effective clinical studies (34) designed to achieve tumor rejection.
Limiting dilution analysis of M-MSV/M-MuLV immune T cells showed that ≈1 in 2,000 of the transferred immune CD8+ T cells are specific for the viral antigens (8). The remaining transferred cells travel through the circulation and may settle in lymphoid organs such as the spleen. The lack of a specific signal from the spleen or lymph nodes could be attributed to high background attributable to tracer clearance, the position of the spleen in the abdomen, or insufficient numbers of TK-marked cells within the organs.
Cellular immunotherapy using in vitro cultured tumor infiltrating lymphocytes or allogeneic bone marrow transplantation is currently in use for the treatment of human cancers such as leukemia, renal cell carcinoma, and melanoma (35–37) and would greatly benefit from the use of PET imaging to study the factors that determine the localization of these cells to the tumor site. This technique can be adapted to use in humans. The source of T cells could be peripheral blood instead of splenic lymphocytes. Infection of human lymphocytes will necessitate use of different viral coat proteins resulting in retroviruses with broader host range. Human T lymphocytes and bone marrow cells can be efficiently infected with retroviruses (38). The safety and lack of toxicity of [18F]FHBG has been tested in human volunteers, and thus this compound can be used repeatedly in the same patient (39). PET reporter gene evaluation of T cell responses should have broad applicability to the study of microbial pathogens and autoimmunity as well as tumor immunotherapy.
Acknowledgments
We are grateful to Judy Edwards and Dr. Waldemar Ladno for assistance with microPET imaging and the chemists and cyclotron crew for production of radioisotope. We especially thank Dr. Ladno for help with i.v. injections of radioactive tracers. We acknowledge help from David Stout, Andy Loening, Xiaoman Lewis, Dr. Melissa Spencer, and Dr. James Tidball. We thank Dr. Qianwa Liang, Dr. Harvey Herschman, and Dr. Margaret Black (Washington State University) for the gift of the PET23(a)sr39TK vector, Dr. Naomi Rosenberg for a gift of α-gag monoclonal antibody, Stephane Wong for a gift of MSCV-IRES-GFP vector, and Maria Avina and Ping Fu of the Human Tissue Resource Center at the University of California (Los Angeles) for cutting tissue sections. We thank Drs. Michael Teitell, Melissa Spencer, and James Tidball for critical review of the manuscript and J. C. White for help with manuscript preparation. We are grateful to Dr. Michael Phelps for his inspiration and support. This work was partially supported by funds from National Cancer Institute In Vivo Cellular and Molecular Imaging Center Grants P50 (to O.N.W., J.B., and S.S.G.) and R0-1 CA82214 (to S.S.G.), Small Animal Imaging Resource Program Grant R24 CA92865 (to S.S.G.), Department of Energy Cooperative Agreement DE-FC03-87ER60615 (to S.S.G. and O.N.W.), the Granet Mantle Cell Lymphoma Foundation (to J.B.), the Jonsson Comprehensive Cancer Center (to J.B.), and CaP CURE (to J.B., O.N.W., and S.S.G.). O.N.W. is an Investigator of the Howard Hughes Medical Institute. P.D. was a fellow of the Cancer Research Institute (1998–2001) and is supported by a CaP CURE Young Investigator Award. H.S. is supported by the University of California Los Angeles Tumor Cell Biology Predoctoral Training Grant.
Abbreviations
- PET
positron-emission tomography
- [18F]FDG
2-[18F]fluoro-2-deoxy-d-glucose
- [18F]FHBG
9-[4-[18F]fluoro-3-(hydroxymethyl)butyl]guanine
- FIAU
1-(2′-deoxy-2′-fluoro-β-d-arabinofuranosyl)-5-iodouracil
- M-MSV
Moloney murine sarcoma virus
- M-MuLV
Moloney murine leukemia virus
- HSV1
herpes simplex virus 1
- TK
thymidine kinase
- MSCV
murine stem cell virus
- IRES
internal ribosomal entry site
- α-
anti-
- ID
injected dose
References
- 1.Schreiber H. In: Fundamental Immunology. Paul W E, editor. Philadelphia: Lippincott-Raven; 1999. pp. 1237–1270. [Google Scholar]
- 2.Rosenberg S A. Nature. 2001;411:380–384. doi: 10.1038/35077246. [DOI] [PubMed] [Google Scholar]
- 3.Ross J S, Sheehan C E, Fisher H A, Kauffman R A, Dolen E M, Kallakury B V. Expert Rev Mol Diagn. 2002;2:129–142. doi: 10.1586/14737159.2.2.129. [DOI] [PubMed] [Google Scholar]
- 4.Gambhir S S. Nat Rev Cancer. 2002;2:683–693. doi: 10.1038/nrc882. [DOI] [PubMed] [Google Scholar]
- 5.Phelps M E. Proc Natl Acad Sci USA. 2000;97:9226–9233. doi: 10.1073/pnas.97.16.9226. [DOI] [PMC free article] [PubMed] [Google Scholar]
- 6.Cherry S R, Gambhir S S. ILAR J. 2001;42:219–232. doi: 10.1093/ilar.42.3.219. [DOI] [PubMed] [Google Scholar]
- 7.Fefer A, McCoy J L, Glynn J P. Cancer Res. 1967;27:1626–1631. [PubMed] [Google Scholar]
- 8.Milan G, Zambon A, Cavinato M, Zanovello P, Rosato A, Collavo D. J Virol. 1999;73:2280–2287. doi: 10.1128/jvi.73.3.2280-2287.1999. [DOI] [PMC free article] [PubMed] [Google Scholar]
- 9.Gorczynski R M, Knight R A. Eur J Immunol. 1975;5:148–155. doi: 10.1002/eji.1830050214. [DOI] [PubMed] [Google Scholar]
- 10.Flyer D C, Burakoff S J, Faller D V. Nature. 1983;305:815–818. doi: 10.1038/305815a0. [DOI] [PubMed] [Google Scholar]
- 11.Biasi G, Facchinetti A, Panozzo M, Zanovello P, Chieco-Bianchi L, Collavo D. J Immunol. 1991;147:2284–2289. [PubMed] [Google Scholar]
- 12.Gambhir S S, Bauer E, Black M E, Liang Q, Kokoris M S, Barrio J R, Iyer M, Namavari M, Phelps M E, Herschman H R. Proc Natl Acad Sci USA. 2000;97:2785–2790. doi: 10.1073/pnas.97.6.2785. [DOI] [PMC free article] [PubMed] [Google Scholar]
- 13.Alauddin M M, Conti P S. Nucl Med Biol. 1998;25:175–180. doi: 10.1016/s0969-8051(97)00160-1. [DOI] [PubMed] [Google Scholar]
- 14.Gambhir S S, Barrio J R, Wu L, Iyer M, Namavari M, Satyamurthy N, Bauer E, Parrish C, MacLaren D C, Borghei A R, et al. J Nucl Med. 1998;39:2003–2011. [PubMed] [Google Scholar]
- 15.Goff S P. Annu Rev Genet. 1992;26:527–544. doi: 10.1146/annurev.ge.26.120192.002523. [DOI] [PubMed] [Google Scholar]
- 16.Ledbetter J A, Imboden J B, Schieven G L, Grosmaire L S, Rabinovitch P S, Lindsten T, Thompson C B, June C H. Blood. 2002;75:1531–1539. [PubMed] [Google Scholar]
- 17.Qi J, Leahy R M, Cherry S R, Chatziioannou A, Farquhar T H. Phys Med Biol. 1998;43:1001–1013. doi: 10.1088/0031-9155/43/4/027. [DOI] [PubMed] [Google Scholar]
- 18.Kiessling R, Klein E, Wigzell H. Eur J Immunol. 1975;5:112–117. doi: 10.1002/eji.1830050208. [DOI] [PubMed] [Google Scholar]
- 19.Adonai N, Nguyen K N, Walsh J, Iyer M, Toyokuni T, Phelps M E, McCarthy T, McCarthy D W, Gambhir S S. Proc Natl Acad Sci USA. 2002;99:3030–3035. doi: 10.1073/pnas.052709599. [DOI] [PMC free article] [PubMed] [Google Scholar]
- 20.Hamann A, Klugewitz K, Austrup F, Jablonski-Westrich D. Eur J Immunol. 2000;30:3207–3218. doi: 10.1002/1521-4141(200011)30:11<3207::AID-IMMU3207>3.0.CO;2-L. [DOI] [PubMed] [Google Scholar]
- 21.Finke D, Acha-Orbea H. Eur J Immunol. 2001;31:2603–2611. doi: 10.1002/1521-4141(200109)31:9<2603::aid-immu2603>3.0.co;2-8. [DOI] [PubMed] [Google Scholar]
- 22.Ali S A, Rees R C, Anderson D Q, Reed M W, Goepel J R, Brown N J. Br J Cancer. 2000;83:1061–1068. doi: 10.1054/bjoc.2000.1403. [DOI] [PMC free article] [PubMed] [Google Scholar]
- 23.Weninger W, Crowley M A, Manjunath N, von Andrian U H. J Exp Med. 2001;194:953–966. doi: 10.1084/jem.194.7.953. [DOI] [PMC free article] [PubMed] [Google Scholar]
- 24.Ray P, Bauer E, Iyer M, Barrio J R, Satyamurthy N, Phelps M E, Herschman H R, Gambhir S S. Semin Nucl Med. 2001;31:312–320. doi: 10.1053/snuc.2001.26209. [DOI] [PubMed] [Google Scholar]
- 25.Hooper C E, Ansorge R E, Browne H M, Tomkins P. J Biolumin Chemilumin. 1990;5:123–130. doi: 10.1002/bio.1170050208. [DOI] [PubMed] [Google Scholar]
- 26.Bhaumik S, Gambhir S S. Proc Natl Acad Sci USA. 2002;99:377–382. doi: 10.1073/pnas.012611099. [DOI] [PMC free article] [PubMed] [Google Scholar]
- 27.Costa G L, Sandora M R, Nakajima A, Nguyen E V, Taylor-Edwards C, Slavin A J, Contag C H, Fathman C G, Benson J M. J Immunol. 2001;167:2379–2387. doi: 10.4049/jimmunol.167.4.2379. [DOI] [PubMed] [Google Scholar]
- 28.Weissleder R. Nat Rev Cancer. 2002;2:11–18. doi: 10.1038/nrc701. [DOI] [PubMed] [Google Scholar]
- 29.Sharma V, Luker G D, Piwnica-Worms D. J Magn Reson Imaging. 2002;16:336–351. doi: 10.1002/jmri.10182. [DOI] [PubMed] [Google Scholar]
- 30.Gambhir S S, Herschman H R, Cherry S R, Barrio J R, Satyamurthy N, Toyokuni T, Phelps M E, Larson S M, Balatoni J, Finn R, et al. Neoplasia. 2000;2:118–138. doi: 10.1038/sj.neo.7900083. [DOI] [PMC free article] [PubMed] [Google Scholar]
- 31.Wick M, Dubey P, Koeppen H, Siegel C T, Fields P E, Chen L, Bluestone J A, Schreiber H. J Exp Med. 1997;186:229–238. doi: 10.1084/jem.186.2.229. [DOI] [PMC free article] [PubMed] [Google Scholar]
- 32.Chambers C A, Kuhns M S, Egen J G, Allison J P. Annu Rev Immunol. 2001;19:565–594. doi: 10.1146/annurev.immunol.19.1.565. [DOI] [PubMed] [Google Scholar]
- 33.Helmich B K, Dutton R W. J Immunol. 2001;166:6500–6508. doi: 10.4049/jimmunol.166.11.6500. [DOI] [PubMed] [Google Scholar]
- 34.de Gruijl T D, Curiel D T. Nat Med. 1999;5:1124–1125. doi: 10.1038/13443. [DOI] [PubMed] [Google Scholar]
- 35.Ballen K, Stewart F M. Curr Opin Oncol. 1997;9:579–583. doi: 10.1097/00001622-199711000-00014. [DOI] [PubMed] [Google Scholar]
- 36.Riddell S R, Murata M, Bryant S, Warren E H. Cancer Control. 2002;9:114–122. doi: 10.1177/107327480200900204. [DOI] [PubMed] [Google Scholar]
- 37.Brinckerhoff L H, Thompson L W, Slingluff C L., Jr Curr Opin Oncol. 2000;12:163–173. doi: 10.1097/00001622-200003000-00012. [DOI] [PubMed] [Google Scholar]
- 38.Riviere I, Gallardo H F, Hagani A B, Sadelain M. Mol Biotechnol. 2000;15:133–142. doi: 10.1385/MB:15:2:133. [DOI] [PubMed] [Google Scholar]
- 39.Yaghoubi S, Barrio J R, Dahlbom M, Iyer M, Namavari M, Satyamurthy N, Goldman R, Herschman H R, Phelps M E, Gambhir S S. J Nucl Med. 2001;42:1225–1234. [PubMed] [Google Scholar]


