Abstract
Objective
To explore the feasibility of obtaining a local measurement of the thickness of the retinal ganglion cell layer in patients with glaucoma using frequency-domain optical coherence tomography (fdOCT) and a computer-aided manual segmentation procedure.
Methods
The fdOCT scans were obtained from the horizontal midline for 1 eye of 26 patients with glaucoma and 20 control subjects. The thickness of various layers was measured with a manual segmentation procedure aided by a computer program. The patients were divided into low-and high-sensitivity groups based on their foveal sensitivity on standard automated perimetry.
Results
The RGC plus inner plexiform and the retinal nerve fiber layers of the low-sensitivity group were significantly thinner than those of the high-sensitivity group. While these layers were thinner in the patients than the controls, the thicknesses of inner nuclear layer and receptor layer were similar in all 3 groups. Further, the thinning of the retinal ganglion cell plus inner plexiform layer in 1 glaucoma-affected eye showed qualitative correspondence to the loss in 10-2 visual field sensitivity.
Conclusions
Local measures of RGC layer thickness can be obtained from fdOCT scans using a manual segmentation procedure, and these measures show qualitative agreement with visual field sensitivity.
Glaucoma damages retinal ganglion cells (RGCs) and their axons, leading to characteristic changes in the structure of the optic disc and in visual fields as measured with standard automated perimetry (SAP). In an attempt to understand how functional losses (eg, local loss of visual field sensitivity) relate to the structural damage (eg, loss of RGCs and their axons), many studies have measured visual loss with SAP and structural damage with time-domain optical coherence tomography (tdOCT).1–3 With tdOCT, the thickness of the axon layer (ie, the retinal nerve fiber layer [RNFL]) is measured as it enters the optic nerve head. Therefore, to compare local changes in this structural measure with local functional losses in sensitivity, a map relating the field position to the optic disc sector must be assumed. While these maps exist, they are averaged for many individuals and do not necessarily describe a particular individual. For example, Garway-Heath et al4 pointed out that the 95% confidence interval for the location on the disc of the projections from a particular SAP point is almost 30°. Individual variation in this map is probably a major contributor to the large intersubject variability seen in plots of tdOCT RNFL loss vs loss in visual field.5
If reliable measures of local RGC layer thickness can be obtained, it might be possible to decrease the variability in the structure vs function plots. With the newer frequency-domain (fd)–OCT, the RGC layer, or at least the combined RGC and inner plexiform layers (IPL), can be visualized. Here we use fdOCT to measure the RGC/IPL and RNFL along the horizontal meridian. We chose to study the horizontal meridian for 2 reasons. First, it includes the fovea, the most important structure for detailed vision and a possible site of undetected glaucomatous damage. Second, the horizontal meridian includes the papillomacular bundle, which consists of the axons of the RGCs nasal to the fovea and thus the axons that travel directly to the optic disc. Consequently, the region between the fovea and the optic disc is a place in the retina where the loss in visual field sensitivity should be reflected in both local RGC loss and local RNFL loss.
The main purpose of this study was to explore the feasibility of obtaining a measure of the local thickness of the RGC layer. A computer-aided manual segmentation technique was used to measure local RGC/IPL (RGC+) thickness as well as the thickness of the receptor layer, the inner nuclear layer (INL), and the RNFL. The results for controls with healthy vision were compared with those of a group of patients with a range of glaucomatous damage to the macular region. The feasibility of using these measures to study the relation of structural damage of the macular to functional damage was also considered.
METHODS
SUBJECTS
Twenty-six eyes of 26 patients with glaucoma (mean [SD] age, 60.5 [12.7] years) were included in this study. Each patient received a complete ophthalmic examination including medical history review, best-corrected visual acuity, slit-lamp biomicroscope, intraocular pressure measurement with Goldmann applanation tonometry, dilated funduscopic examination, gonioscopy, and SAP with the Humphrey Field Analyzer II (Carl Zeiss Meditec Inc, Dublin, California) using the 24-2 program and the Swedish Interactive Threshold Algorithm. Inclusion criteria for these patients included best-corrected visual acuity of 20/60 or better, spherical refraction within ±6.00 diopters (D), cylinder correction within ±2.00 D, and open angle on gonioscopy. In addition, all eyes had glaucomatous damage, as indicated by glaucomatous optic neuropathy and an abnormal 24-2 visual field (abnormal glaucoma hemifield test and/or abnormal mean deviation [MD]). Glaucomatous optic neuropathy was defined as a vertical cup to disc ratio greater than 0.6, asymmetry of the cup to disc ratio 0.2 or greater between eyes, presence of localized RNFL, or neuroretinal rim defects or a splinter hemorrhage in the absence of any other abnormalities that could explain such findings. Patients with clinically significant cataracts, other media opacities, or other ocular diseases were excluded. For 23 of the 26 patients, the eye chosen for analysis had the worse MD value. In one case, the eye with the worse MD had an unreliable field; in a second case, the eye had a poor OCT scan; and in the third case, the 2 eyes had nearly identical MDs, so the one with the poorer central sensitivity was chosen. The patients were placed into 2 groups based on their sensitivity to the foveal test point in the 24-2 visual field. Seventeen patients had a foveal sensitivity within normal limits and comprised the high-sensitivity group. The other 9 patients, the low-sensitivity group, had abnormal foveal sensitivity. The average foveal sensitivities were 35.9 dB (range, 33–39 dB) and 27.9 dB (range, 23–32 dB) for the high- and low-sensitivity groups, respectively. The average of the MD for the 24-2 visual field was −7.0 dB (range, −0.7 to −25.4 dB) and −13.3 dB (range, −3.6 to −26.6 dB) for the high- and low-sensitivity groups, respectively. Eyes with retinal disease, non-glaucomatous optic neuropathy, or uveitis were excluded from this study.
Twenty eyes of 20 control subjects (mean [SD] age, 51.4 [9.4] years) had best-corrected visual acuity of 20/25 or better, with no history of elevated intraocular pressure and a normal visual field on SAP. Control eyes had a normal-appearing optic disc evaluated by fundus examination.
Written informed consent was obtained from all participants. Procedures followed the tenets of the Declaration of Helsinki, and the protocol was approved by the committee of the institutional board of research associates of Columbia University.
OCT SCANS
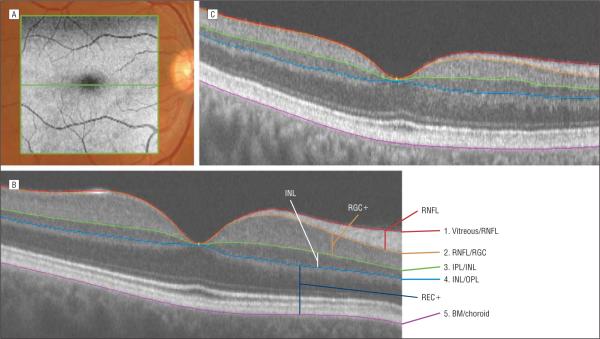
Subjects had fdOCT scans of the horizontal meridian (3D-OCT 1000; Topcon Corporation, Tokyo, Japan). These were horizontal line scans, which consisted of 1024 A-scans 6 mm in length (overlapping set at 16) and/or the midline scan of a volume scan, which covered a 6×6 mm area with 512×128 A-scans in density. Figure 1A shows the location of the 6×6–mm region and the single horizontal line scan. Scan protocols were repeated 3 times, and the best quality horizontal scan was chosen for segmentation.
Figure 1.
The frequency-domain optical coherence tomographic scan location and segmentation technique. A, The location of the 6×6–mm (gray) scan volume and the single horizontal line scan (green) are superimposed on a fundus image. B, A horizontal line scan of one of the controls shows the 5 borders determined as part of the computer-aided segmentation technique. They are (1) red, the border between the vitreous and the retinal nerve fiber layer (RNFL); (2) orange, the border between the RNFL and the retinal ganglion cell layer (RGC); (3) green, the border between the inner plexiform layer (IPL) and the inner nuclear layer (INL); (4) light blue, the border between the INL and outer plexiform layer (OPL); and (5) violet, the border between the Bruch membrane (BM) and the choroid. REC+ indicates receptor and OPL layers. C, A horizontal line scan of a patient with glaucoma shows loss of the RNFL and RGC layer.
The OCT files were exported to a program written in Matlab 7.4 (MathWorks, Natick, Massachusetts) for segmentation. The operator, one of the authors (M.W. or J.-S.C.), masked to the status of the visual field, manually marked the borders of 5 retinal layers, and the program used a spline interpolation algorithm to determine the border.6 The number of points needed to define the boundary depended on the curvature of the boundary and ranged between 3 and 10. Essentially flat boundaries (eg, some choroid borders) needed only 3 points to be described, while curved boundaries (eg, the vitreous/RNFL border) required up to 10. The segmentation boundaries were confirmed by another author (D.C.H.) who was also experienced in segmenting OCT scans and masked to the status of the visual field. In particular, if the second person disagreed with a particular segmentation, the 2 operators discussed the points of disagreement and, in all but 1 case, agreed on the correct segmentation. In the 1 exception, the senior author adjudicated the final decision. We have previously shown that there is good interobserver agreement.6 In particular, the concordance correlation coefficients between observers averaged 0.95 or better for the 2 layers of primary interest here (RNFL and RGC+) for both patients and controls.6
The 5 borders that were marked (Figure 1B) were (1) the border between the vitreous and the RNFL, (2) the border between the RNFL and the RGC, (3) the border between the IPL and the INL, (4) the border between the INL and outer plexiform layer, and (5) the border between the Bruch membrane and the choroid. Using these borders, the thickness of 4 layers was calculated. In particular, the RNFL thickness was calculated as the difference between borders 1 (vitreous/RNFL border) and 2 (RNFL/RGC border). Similarly, the RGC layer plus IPL (RGC+) was the difference between borders 2 and 3. Because the border between RGC and IPL could not be differentiated on most scans, we measured the combined thickness as RGC+. In addition, the INL thickness was calculated as the difference between borders 4 and 5, and the receptor + thickness (REC+, which included the outer plexiform layer, photoreceptor layer, retinal pigment epithelium, and Bruch membrane) as 5 to 6.
RESULTS
RETINAL LAYERS ALONG THE HORIZONTAL MERIDIAN
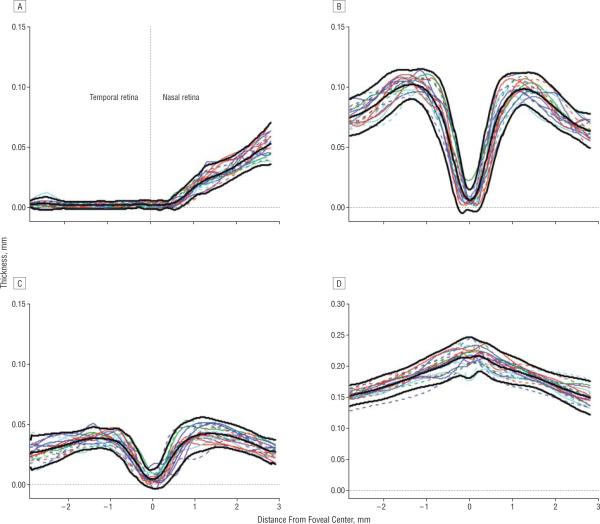
Figure 2 contains the thickness profiles along the horizontal meridian (Figure 2A) for each of the 20 controls and for each of the 4 retinal layers. The mean (2 SD) and 95% confidence intervals are indicated by the bold black curves. The results here and in Figures 2–4 are presented as if all eyes were right eyes. That is, the data for left eyes were plotted right to left.
Figure 2.
The thickness profiles for individual controls (colored curves) for the retinal nerve fiber layer (A), retinal ganglion cell + inner plexiform layer (B), inner nuclear layer (C), and receptor+outer plexiform layer (D). The mean limits (2 SD) are indicated by the bold black curves.
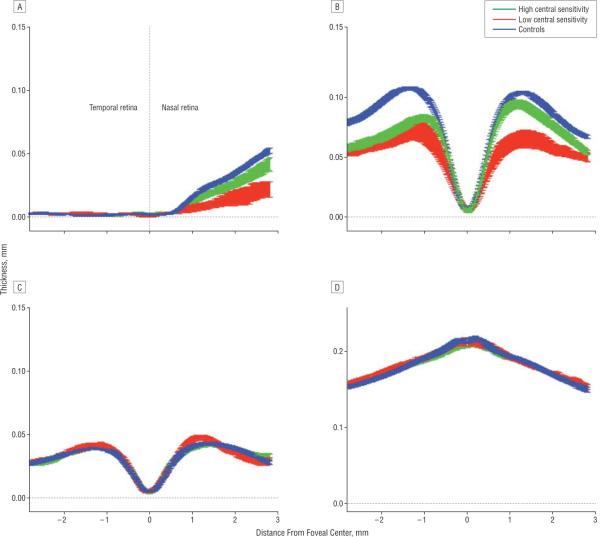
Figure 4.
The mean thickness profiles (1 SE) for the controls, patients with high central sensitivity, and patients with low sensitivity for the retinal nerve fiber layer (A), retinal ganglion cell+ inner plexiform layer (B), inner nuclear layer (C), and receptor+outer plexiform layer (D).
The data from the controls qualitatively match what is expected owing to known anatomy. The REC+layer (panel Figure 2D) is thickest in the center of the fovea; the INL (Figure 2C) and RGC+ (Figure 2B) approach zero in the center and peak in the perifovea; and the RNFL (Figure 2A) is near zero on the temporal side of the fovea and increases on the nasal side as the optic disc is approached. In principle, the RNFL should not exist along the horizontal meridian in the temporal retina. The measurements here are probably influenced by a number of factors, including local thickening of the internal limiting membrane and axons that either cross the midline and/or are present owing to small errors in the placement of the horizontal meridian.
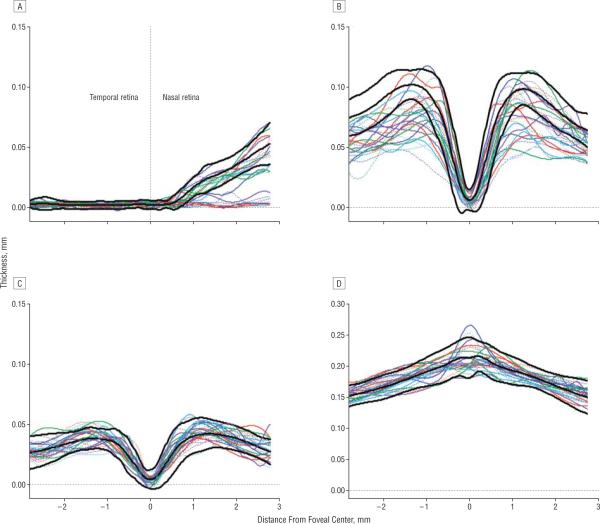
Figure 3 shows the results for the 26 patients. The INL (Figure 3C) and REC+ (Figure 3D) thickness curves fall largely within the 95% confidence intervals for the controls. The RNFL (Figure 3A) and RGC+ (Figure 3B) data show a range of thicknesses, including many curves with portions of their thickness curves falling below the 95% confidence intervals.
Figure 3.
The thickness profiles for individual patients (colored curves) for the retinal nerve fiber layer (A), retinal ganglion cell + inner plexiform layer (B), inner nuclear layer (C), and receptor+outer plexiform layer (D). The mean limits (2 SD) for the controls from Figure 2 are indicated by the bold black curves.
The 26 patients were divided into 2 groups based on the foveal sensitivity obtained with the 24-2 visual field test. Figure 4 compares the curves for the mean (1 standard error [SE]) for the patient groups with high and low foveal sensitivity with those for the controls. The curves (mean [1 SE]) for the outer retinal layers (Figure 4, C and D; INL and REC+) of the 2 groups of patients are indistinguishable from each other and from the curves for the controls. However, the RNFL and RGC curves for the high-sensitivity group fell below those of the controls, while those of the low-sensitivity group fell well below both the curves for the controls and the high-sensitivity group.
To test the significance of the differences between groups, the average thickness for each layer and each individual was calculated; the means (standard deviations) of these average thicknesses are shown in the Table. As expected from Figure 4, C and D, there was no significant difference (pairwise t tests) between any of the groups for the INL and REC+layers. On the other hand, both patient groups had significantly thinner layers than the controls for the RNFL (high P=.03; low P<.001) and RGC+layer (P<.001 for both high and low groups). In addition, the low-sensitivity group had significantly thinner layers than the high group for both the RNFL (P<.001) and RGC layer (P<.003).
Table.
Mean Thickness of the 4 Layers for the Controls and the High- and Low-Sensitivity Groups
| Mean (SD) Thickness, μm |
||||
|---|---|---|---|---|
| RNFL | RGC+ | INL | REC+ | |
| Controls (n=20) | 14.1 (1.5) | 74.8 (5.1) | 31.1 (3.4) | 181.3 (8.9) |
| High sensitivity (n=17) | 11.6 (4.7) | 61.1 (7.1) | 31.5 (3.6) | 181.1 (8.4) |
| Low sensitivity (n=9) | 4.8 (3.1) | 50.4 (9.1) | 31.9 (2.8) | 182.7 (6.6) |
Abbreviations: INL, inner nuclear layer; REC+, receptor + outer plexiform layer; RGC+, retinal ganglion cell + inner plexiform layer; RNFL, retinal nerve fiber layer.
LOCAL RGC+ LOSS VS VISUAL FIELD LOSS IN A SINGLE PATIENT
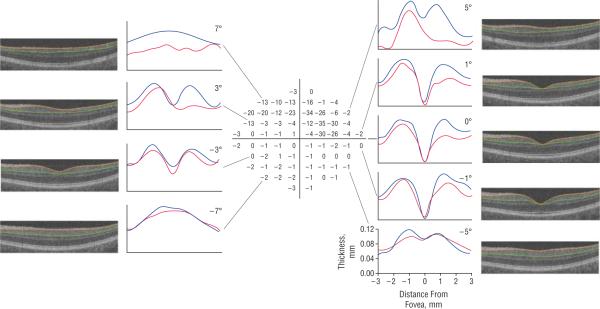
Our objective here was not to make a quantitative comparison of local RGC+ thickness to local visual field sensitivity. The 24-2 field has too few points for a careful comparison, and we only segmented the scan along the horizontal meridian. However, to test the feasibility of such a comparison, we obtained a 10-2 visual field test on 1 patient. Figure 5 shows the 10-2 total deviation field of the left eye from this patient, along with the scan images from the 6×6–mm volume scan that correspond to the horizontal lines of test points in the 10-2 test. In general, the patient's RGC+ layer thickness is markedly thinner than that of an age-matched control in the locations of the visual field with large losses in sensitivity.
Figure 5.
The 10-2 total deviation of visual field (center) of the left eye of a patient with glaucoma. The scan images (left and right) are from the 6×6–mm volume scan and correspond to the horizontal lines of the test points in the 10-2, as shown by the black lines. The segmentation borders of the retinal ganglion cell + inner plexiform layer (RGC+) are shown by orange and green curves. The thickness of the RGC+ layer (distance between the orange and green borders) is shown as red curves in the accompanying graph, with the thickness from a single control of a similar age shown in blue.
COMMENT
A computer-aided manual segmentation technique was used to measure the thickness of retinal layers seen in fdOCT scans of patients with glaucoma and control subjects. While 2 previous studies6,7 used a similar approach to study the thickness of retinal layers in patients with diseases of the outer retina, our interest was in the thickness of the RGC+ layer and RNFL of patients with glaucoma. In particular, we asked whether it was feasible to obtain local measures of RGC+ and RNFL thickness and whether these measures might be associated with local glaucomatous loss. In general, the results are encouraging.
First, we confirmed that the local thickness of the 4 layers measured were consistent with known retinal anatomy for the controls and for the patients. For example, in the controls, the RGC+ layers showed maxima in thickness just outside the fovea, while the RNFL increased in thickness between the foveal center and the optic disc. As expected, both of these layers were decreased in thickness in some of the patients with glaucoma.
Second, to see if the changes in the RGC+ and RNFL layers corresponded, in general, with the loss of visual function, the thickness of the RGC+ and RNFL layers in patients with low (abnormal) foveal sensitivity were compared with the thickness in patients with high (normal) foveal sensitivity. We found that the RGC layer and RNFL of the low-sensitivity group were significatly thinner than in the high-sensitivity group. While these layers were significantly thinner in both patient groups compared with the control subjects, the thickness of the INL and REC+layers were similar for all 3 groups. In general, these results are consistent with an earlier study8 that found that the average thickness of the macular RNFL and the RGC+ layer were significantly thinner than in controls, although we did not find, as they did, any evidence of abnormal thickening in the receptor region (REC+).
Finally, we presented evidence that it might be possible to compare local sensitivity with local RGC+ loss quantitatively. To test the feasibility of comparing the local loss of visual field sensitivity (ie, functional loss) with the loss of RGCs and their axons (ie, structural damage), we compared the RGC+ layer thickness with 10-2 visual field loss in 1 glaucomatous eye. The loss of visual field sensitivity appeared to correspond to the thinning of RGC+ layer (Figure 5). The limitation of this example is a lack of a true control group. A careful quantitative comparison of a large group of patients is needed, and this comparison will require consideration of the displacement of the RGC relative to the location of the receptors feeding into them.9
Although algorithms have been proposed for segmenting the RGC layer (eg, references 8,10,11 and RTuve software; Optovue, Fremont, California), as far as we know there is no algorithm available in the public domain for analyzing images from any fdOCT machine. However, it is possible to obtain a measure of local RGC thickness without the need of a computer algorithm.6 Using this manual segmentation procedure, we found that the reduction in thickness of the RGC layer showed a qualitative correspondence to locallosses in visual field sensitivity. While it remains for future studies to determine how good this correspondence actually is, our findings suggest that the RGC+ layer can be measured in the macular region using commercially available scans. These findings also have possible implications for early detection of macular damage. Because the macular region is rich in RGCs, it has been suggested that glaucomatous damage of this central region might occur early in the disease process. In fact, monkey models of glaucoma show significant loss of macular RGCs.12,13 However, in general, OCT measuresof the macular region have not outperformed measures of peripapillary RNFL thickness in detecting glaucomatous damage.14–18 On the other hand, these OCT studies measured total macular thickness, not RGC thickness. It remains to be seen how sensitive a direct measure of the RGC layer, as used here, will be in detecting early glaucomatous damage.
Acknowledgments
Funding/Support: This study was supported in part by grants EY09076 and EY02115 from the National Institutes of Health, Bethesda, Maryland; the Shelley and Steven Einhorn Research Fund of the New York Glaucoma Research Institute; and Topcon, Inc; Dr Wang was supported in part by grant of 2007CB512204 from the National Basic Research Program of China and by grants 30571996 and 30600696 from the National Science Foundation of China.
Role of the Sponsor: Topcon, Inc, supplied the ocular coherence tomography machines used in this study.
Footnotes
Financial Disclosure: Drs Hood and Liebmann report being consultants for Topcon, Inc; no other authors report financial disclosures.
REFERENCES
- 1.Garway-Heath DF. Comparison of structural and functional methods: I. In: Weinreb RN, Greve EL, editors. Glaucoma Diagnosis: Structure and Function. Kugler Publications; The Hague, the Netherlands: 2004. pp. 135–143. [Google Scholar]
- 2.Bowd C, Zangwill LM, Medeiros FA, et al. Structure-function relationships using confocal scanning laser ophthalmoscopy, optical coherence tomography, and scanning laser polarimetry. Invest Ophthalmol Vis Sci. 2006;47(7):2889–2895. doi: 10.1167/iovs.05-1489. [DOI] [PubMed] [Google Scholar]
- 3.Hood DC, Kardon RH. A framework for comparing structural and functional measures of glaucomatous damage. Prog Retin Eye Res. 2007;26(6):688–710. doi: 10.1016/j.preteyeres.2007.08.001. [DOI] [PMC free article] [PubMed] [Google Scholar]
- 4.Garway-Heath DF, Poinoosawmy D, Fitzke FW, Hitchings RA. Mapping the visual field to the optic disc in normal tension glaucoma eyes. Ophthalmology. 2000;107(10):1809–1815. doi: 10.1016/s0161-6420(00)00284-0. [DOI] [PubMed] [Google Scholar]
- 5.Hood DC, Anderson SC, Wall M, Kardon RH. Structure versus function in glaucoma: an application of a linear model. Invest Ophthalmol Vis Sci. 2007;48(8):3662–3668. doi: 10.1167/iovs.06-1401. [DOI] [PubMed] [Google Scholar]
- 6.Hood DC, Lin CE, Lazow MA, Locke KG, Zhang X, Birch DG. Thickness of receptor and post-receptor retinal layers in patients with retinitis pigmentosa measured with frequency-domain optical coherence tomography (fdOCT) Invest Ophthalmol Vis Sci. doi: 10.1167/iovs.08-2936. published online November 14, 2008. doi:10.1167/iovs.08-2936. [DOI] [PMC free article] [PubMed] [Google Scholar]
- 7.Lim JI, Tan O, Fawzi AA, Hopkins JJ, Gil-Flamer JH, Huang D. A pilot study of fourier-domain optical coherence tomography of retinal dystrophy patients. Am J Ophthalmol. 2008;146(3):417–426. doi: 10.1016/j.ajo.2008.05.018. [DOI] [PMC free article] [PubMed] [Google Scholar]
- 8.Ishikawa H, Stein DM, Wollstein G, Beaton S, Fujimoto JG, Schuman JS. Macular segmentation with optical coherence tomography. Invest Ophthalmol Vis Sci. 2005;46(6):2012–2017. doi: 10.1167/iovs.04-0335. [DOI] [PMC free article] [PubMed] [Google Scholar]
- 9.Drasdo N, Millican CL, Katholi CR, Curcio CA. The length of Henle fibers in the human retina and a model of ganglion receptive field density in the visual field. Vision Res. 2007;47(22):2901–2911. doi: 10.1016/j.visres.2007.01.007. [DOI] [PMC free article] [PubMed] [Google Scholar]
- 10.Fernandez DC, Salinas HM, Puliafito CA. Automated detection of retinal layer structures on optical coherence tomography images. Opt Express. 2005;13(25):10200–10216. doi: 10.1364/opex.13.010200. [DOI] [PubMed] [Google Scholar]
- 11.Garvin MK, Abramoff MD, Kardon R, Russell SR, Wu X, Sonka M. Intraretinal layer segmentation of macular optical coherence tomography images using optimal 3-D graph search. IEEE Trans Med Imaging. 2008;27(10):1495–1505. doi: 10.1109/TMI.2008.923966. [DOI] [PMC free article] [PubMed] [Google Scholar]
- 12.Glovinsky Y, Quigley HA, Pease ME. Foveal ganglion cell loss is size dependent in experimental glaucoma. Invest Ophthalmol Vis Sci. 1993;34(2):395–400. [PubMed] [Google Scholar]
- 13.Frishman LJ, Shen FF, Du L, et al. The scotopic electroretinogram of macaque after retinal ganglion cell loss from experimental glaucoma. Invest Ophthalmol Vis Sci. 1996;37(1):125–141. [PubMed] [Google Scholar]
- 14.Leung CK, Chan WM, Yung WH, et al. Comparison of macular and peripapillary measurements for the detection of glaucoma: an optical coherence tomography study. Ophthalmology. 2005;112(3):391–400. doi: 10.1016/j.ophtha.2004.10.020. [DOI] [PubMed] [Google Scholar]
- 15.Sánchez-Galeana CA, Bowd C, Zangwill LM, Sample PA, Weinreb RN. Short-wavelength automated perimetry results are correlated with optical coherence tomography retinal nerve fiber layer thickness measurements in glaucomatous eyes. Ophthalmology. 2004;111(10):1866–1872. doi: 10.1016/j.ophtha.2004.04.017. [DOI] [PubMed] [Google Scholar]
- 16.Budenz DL, Michael A, Chang RT, McSoley J, Katz J. Sensitivity and specificity of the StratusOCT for perimetric glaucoma. Ophthalmology. 2005;112(1):3–9. doi: 10.1016/j.ophtha.2004.06.039. [DOI] [PubMed] [Google Scholar]
- 17.Nouri-Mahdavi K, Hoffman D, Tannenbaum DP, Law SK, Caprioli J. Identifying early glaucoma with optical coherence tomography. Am J Ophthalmol. 2004;137(2):228–235. doi: 10.1016/j.ajo.2003.09.004. [DOI] [PubMed] [Google Scholar]
- 18.Kanadani FN, Hood DC, Grippo TM, et al. Structural and functional assessment of the macular region in patients with glaucoma. Br J Ophthalmol. 2006;90(11):1393–1397. doi: 10.1136/bjo.2006.099069. [DOI] [PMC free article] [PubMed] [Google Scholar]


