Liver transplantation (LTx) for end-stage liver failure is an accepted modality of treatment. If the transplanted liver fails, retransplantation is often the only treatment for long-term survival. 1 The present study examines the rate and causes of retransplantation in 4000 consecutive patients who underwent LTx from February 1981 to April 1998. All patients were followed until November 1999. Mean follow-up was 9.4 ± 3.8 years (median 9.6: range 2 to 19 years). The population was divided into three eras (1981 to 1985 era A, n = 478; 1986 to 1990 era B, n = 1382; and 1991 to 1998 era C, n = 2140). The details of the population have been described elsewhere.2
RESULTS
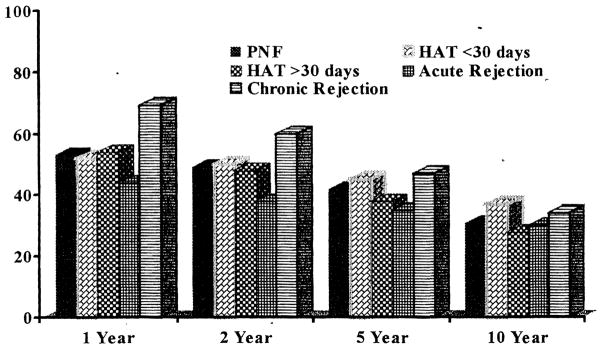
In the follow-up period 774 patients (19.4%) received a second transplant, 148 (3.7%) received a third transplant, 20 (0.5%) received a fourth transplant, and five patients (0.13%) received more than four allografts. The rate of retransplantation and the causes of retransplantation in various eras are shown in Tables 1 and 2. The overall rate of retransplantation has declined significantly in each subsequent era: from 33.4% in era A to 23.7% in era B and 13.4% in era C. (P = .001). This may in part be a result of the length of follow-up, however, 54.7% of first retransplants have occurred within 30 days. The reason for retransplant for rejection has declined from 13.2% to 1 % (P = .001). The rate of hepatic artery thrombosis has declined from 8.1 % in era A to 6.7% in era B and 3.8% in era C. Rate of primary nonfunction in era A, B, C was 4.6%, 7.0%, and 6.0%, respectively. This may be because more older donors are being used in era C. The rate of donor age above 50 years had increased from 1.5% in era A to 3.3% in era B and 22.5% in era C (Table 2). Survival according to cause of retransplantation is shown in Fig 1.
Table 1.
Overall Causes of First Retransplant
| Causes | Number (%) | Mean Interval | Currently Alive n (%) |
|---|---|---|---|
| Primary nonfunction | 249 (32.2) | 0.3 + 0.4 | 97 (38.8) |
| Hepatic artery thrombosis | 214 (27.6) | 5.5 + 14 | 85 (39.7) |
| Chronic rejection | 113 (14.5) | 25.1 + 28.3 | 48 (42.4) |
| Recurrent disease | 44 (5.5) | 31.9 + 32.2 | 15 (34.8) |
| Acute rejection | 38 (4.9) | 5.4 + 20.4 | 13 (34.2) |
| Biliary complications | 22 (2.8) | 16.8 + 24 | 8 (36.3) |
| Technical | 12 (1.5) | 34.9 + 35.2 | 6 (50) |
| Miscellaneous | 48 (6.2) | 16.4 + 28 | 12 (25) |
| Unknown | 34 (4.3) | 28 + 47 | 14 (40) |
| Total | 774 (19.4) | 10.7 + 24 | 298 (38.5) |
Table 2.
Rate of First Retransplant According to Era (%)
| Rate | Era A | Era B | Era C |
|---|---|---|---|
| Overall rate of retransplant | 33.4 | 23.7 | 13.4 |
| Rate of retransplant for rejection | 13.2 | 4.8 | 1.0 |
| Rate of retransplant for hepatic artery thrombosis | 8.1 | 6.7 | 3.8 |
| Rate of retransplant for primary nonfunction | 4.6 | 7.0 | 6.0 |
| Donor age> 50 years | 1.5 | 3.3 | 22.5 |
Fig 1.
% Survival (Y-axis) according to causes of retransplantation (years post-LTX: X-axis).
References
- 1.Starzl TE, Demetris AJ, Van Thiel DH, et al. N Engl J Med. 1989;321:1014. doi: 10.1056/NEJM198910123211505. [DOI] [PMC free article] [PubMed] [Google Scholar]
- 2.Jain AB, Kashyap R, Reyes J, et al. Ann Surg. 2000;232:490. doi: 10.1097/00000658-200010000-00004. [DOI] [PMC free article] [PubMed] [Google Scholar]


