

Abstract
Background and Purpose
A blood based biomarker of acute ischemic stroke would be of significant value in clinical practice. This study aimed to 1) replicate in a larger cohort our previous study using gene expression profiling to predict ischemic stroke1 and 2) refine prediction of ischemic stroke by including control groups relevant to ischemic stroke.
Methods
Ischemic stroke patients (n=70, 199 samples) were compared to controls who were healthy (n=38), had vascular risk factors (n=52), and who had myocardial infarction (n=17). Whole blood was drawn ≤3h, 5h and 24h after stroke onset and from controls. RNA was processed on whole genome microarrays. Genes differentially expressed in ischemic stroke were identified and analyzed for predictive ability to discriminate stroke from controls.
Results
The 29 probe sets previously reported1 predicted a new set of ischemic strokes with 93.5% sensitivity and 89.5% specificity. 60- and 46-probe sets differentiated control groups from 3h and 24h ischemic stroke samples, respectively. A 97-probe set correctly classified 86% of ischemic strokes (3h + 24h), 84% of healthy subjects, 96% of vascular risk factor subjects and 75% with myocardial infarction.
Conclusions
This study replicated our previously reported gene expression profile in a larger cohort and identified additional genes that discriminate ischemic stroke from relevant control groups. This multi-gene approach shows potential for a point-of-care test in acute ischemic stroke.
Keywords: gene expression profiling, blood, ischemia, stroke, biomarkers
Introduction
Stroke is a leading cause of adult death and disability 2, 3. The diagnosis of ischemic stroke (IS) is made with clinical assessment in combination with brain imaging. However, the diagnosis is not always straightforward, particularly in the acute setting where an accurate, inexpensive and rapid diagnosis is critical to optimally treat patients.
Extensive efforts have been directed toward identifying blood based biomarkers for IS. More than 58 proteins and 7 panels of proteins have been described as biomarkers of IS 4-6. RNA expression profiles in the blood have also been described in IS 1, 7. We previously reported a 29-probe set expression profile predictive of IS1. This profile required validation in a second cohort, which has been done in the current study. We also describe a 97-probe set expression profile that differentiates IS from controls who are Healthy, have vascular risk factors, and who have myocardial infarction. These profiles represent further refinement of gene expression as a diagnostic tool in patients with acute IS, which could be used to aid in the diagnosis of stroke in the context of clinical information and evaluation.
Materials and Methods
The study had two objectives: (1) Demonstrate that the previously identified 29 probes distinguish IS from healthy controls 1 in a new cohort; and (2) Identify additional genes that discriminate IS from vascular risk factor (SAVVY) controls and myocardial infarction (MI) controls. Whole blood was drawn from IS patients (n=70, 199 samples) at ≤3, 5 and 24 hours (3h IS, 5h IS, 24 IS) as part of the CLEAR trial 8 (NCT00250991 at Clinical-Trials.gov). IS subjects were treated with r-tPA with or without eptifibatide after the 3h blood sample was obtained. Controls included healthy subjects (n=38), subjects with acute myocardial infarction (MI, n=17) and subjects with at least one cardiovascular risk factor (hypertension, diabetes mellitus, hyperlipidemia, or tobacco smoking) recruited from the SAVVY (Sex, Age and Variation in Vascular functionalitY) study (n=52). The institutional review board at each site approved the study, and each patient provided informed consent. Blood samples were collected in PAXgene tubes (PreAnlytix, Germany). Isolated RNA was processed using Ovation Whole Blood reagents (Nugen Technologies, San Carlos, CA) and hybridized onto Affymetrix Genome U133 Plus 2 GeneChips (Affymetrix Santa Clara, CA). Data was normalized using Robust Multichip Averaging (RMA) 9 and our internal-gene normalization approach.10
Objective 1
The predictive ability of the 29 previously identified genes was determined using k-nearest neighbor in PAM (Prediction Analysis of Microarrays) 11. IS and healthy subjects were randomly split in half, stratified by Group and Time-Point (for the IS samples) into a Training Set to develop the prediction algorithm and an independent Test (Validation) Set for evaluating the accuracy of the prediction algorithm.
Objective 2
To identify genes able to discriminate between IS and all controls groups, an ANCOVA adjusted for age, gender and microarray batch effect was used. Genes significant on the ANCOVA models were input into PAM where their number was further reduced using the nearest-shrunken centroids algorithm (See supplementary materials for details). The ability of the identified genes to predict IS from controls was assessed using (1) 10-fold cross-validation (CV), and (2) assessed in a second (independent) Test (Validation) Set using several prediction algorithms (k-nearest neighbor (K-NN), support vector machine (SVM), linear discriminant analysis (LDA), and quadratic discriminant analysis (QDA)). Only the 3h IS (not treated) and 24h IS samples were analyzed for objective 2 since they were considered most clinically relevant. See supplementary materials and methods for details of the prediction and cross-validation analyses for Objectives 1 and 2.
Results
Subject Demographics
Demographic information is presented in Table 1 (Objective 1) and Table 2 (Objective 2). Age was significantly different between IS and control groups (p<0.05) (Tables 1 and 2). Gender was significantly different (p<0.05) between IS and healthy subjects in the Tang et al, 2006 study1 and the current study (Table 1), as well as between IS and Vascular Risk Factor (SAVVY) Control subjects from the current study (Table 2). Race was significantly different between IS compared to Healthy and MI controls (Table 2). Hypertension and diabetes were not significantly different between the groups.
Table 1.
Demographic Summary of Subjects from our previous Tang et al. 2006 Study1 and our Current Study of Ischemic Stroke (IS) and Healthy Controls. N= number of subjects.
| IS Tang et. al, 2006 | Healthy Tang et. al, 2006 | IS Current Study | Healthy Controls Current Study | |
|---|---|---|---|---|
| N | 15 | 15 | 70† | 38 |
| Mean Age, years (SD) | 64± 14 | 49 ±11 | 66.8±12.7 | 45.0±19.8 |
| Gender, % | ||||
| Male | 73.3 | 87.5* | 57.1 | 47.4* |
| Female | 26.7 | 12.5* | 42.9 | 52.6* |
| Race, % | ||||
| Caucasian | 80.0 | 75.0 | 80.0 | 55.3 |
| African American | 20.0 | 0.0 | 20.0 | 15.8 |
| Other | 0.0 | 25.0 | 0.0 | 28.9 |
| NIH Stroke Scale | ||||
| 1st Blood Draw (3h) | 15±7 | N/A | 14 ± 7 | N/A |
| 2nd Blood Draw (5h) | 12±8 | 11 ± 8 | ||
| 3rd Blood Draw (24h) | 9±7 | 10 ± 8 |
N = 67 at 3h, 66 at 5h, 66 at 24h. 61 subjects had all three time points.
Table 2.
Demographic Summary of Current Study Participants.
| IS | Healthy Controls | MI Controls | Vascular SAVVY Controls | |
|---|---|---|---|---|
| N | 70† | 38 | 17 | 52 |
| Mean Age, years (SD) | 66.8±12.7 | 45.0±19.8 | 59.6±12.2 | 56.2±5.4 |
| Gender, % | ||||
| Male | 57.1 | 47.4 | 70.6 | 32.7 |
| Female | 42.9 | 52.6 | 29.4 | 67.3* |
| Race, % | ||||
| Caucasian | 80.0 | 55.3 | 47.1 | 86.5 |
| African American | 20.0 | 15.8 | 17.6 | 11.5 |
| Other | 0.0 | 28.9** | 35.3** | 2.0 |
| NIH Stroke Scale | ||||
| 1st Blood Draw (3h) | 14 ± 7 | N/A | N/A | N/A |
| 2nd Blood Draw (5h) | 11 ± 8 | |||
| 3rd Blood Draw (24h) | 10 ± 8 |
N = 67 at 3h, 66 at 5h, 66 at 24h. 61 subjects had all three time points;
Gender distribution significantly different (p<0.05) between Ischemic Stroke (IS) and Vascular Risk Factor (SAVVY) controls. MI=myocardial infarction. N= number of subjects.
Race significantly different (p<0.05) between IS compared to healthy and MI.
1) Replication of Tang et al, 20061 IS predictors in a larger cohort
Due to the different array processing protocols in the study by Tang et al, 20061 and the current studies, the following analyses were performed: (1) the prediction algorithm was retrained on the first random half of the new samples (Training Set) and the performance of the 29 probe sets evaluated in the second half (Test/Validation Set); and (2) the samples used in the Tang et al, 2006 study1 and the current study were internal gene normalized. Overall, 92.9% sensitivity for IS and 94.7% specificity for healthy controls with high Test Set probabilities were achieved (Figure 1, Table 3). The results are similar to the ability of these predictors to classify the previously published patients1, with 88.9% sensitivity for IS and 100% specificity for healthy controls (Table 3). In addition, for comparison purposes to the previous study1, RMA normalization and Cross-Validation (used in the previous study1) on our complete set of IS and healthy samples was performed. Similar results were obtained (Supplementary Table 1 and Supplementary Figure 2).
Figure 1. PAM prediction accuracy of IS and Healthy controls using the set of 29 gene predictors of IS from Tang et al, 2006.
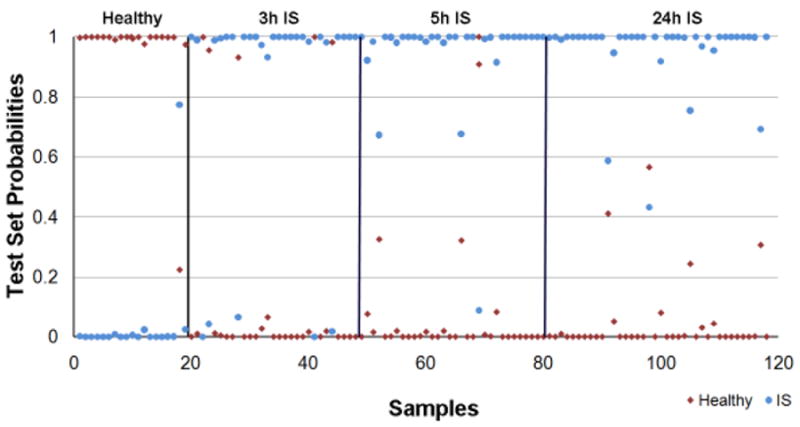
The Prediction Analysis of Microarrays (PAM) algorithm (K-NN, number of neighbors n=10) was trained on the expression values of a first random half of IS (n=35, 100 samples) and healthy (n=19) subjects from the current study using the 29 IS predictors from Tang et al, 2006. Then, these 29 IS predictors were used to predict the class of the second half of the samples (IS n=35, 99 samples; and healthy n=19, Test Set) and calculate the prediction accuracy. The X-axis represents the patient sample number and the Y-axis represents the Test Set probability of diagnosis. A sample is considered misclassified if the predicted class does not match the known class with a probability greater than 0.5.
Table 3.
Validation of the of the 29 probe sets from the Tang et al. 2006 study 1. These probe sets were trained on the first half (Training Set) of the subjects in this study (n=35 IS, n=19 Healthy), and then used predict the Test Set probabilities on a second half of the ischemic stroke (IS) subjects (Test Set) (n =35, 99 samples) and Healthy subjects (n=19, 19 samples) in the Current Study. In addition, the same probe sets were used to predict the Test set probabilities on the original subjects in the Tang et al. 2006 study.
| Class Prediction | Study | 3h | 5h | 24h | All Time Points |
|---|---|---|---|---|---|
| IS, Sensitivity, % | Tang et al, 2006 | 73.3 | 93.3 | 100 | 88.9 |
| Current Study | 84.8 | 97.0 | 97.0 | 92.9 | |
| Healthy, Specificity, % | Tang et al, 2006 | N/A | N/A | N/A | 100 |
| Current Study | N/A | N/A | N/A | 94.7 |
Sensitivity = % correct classification of IS samples
Specificity = % correct classification of healthy samples
2) Refinement of Prediction of IS Against Several Different Control Groups
Differentiation of IS Patients from Controls
Predictive gene expression signatures were derived individually for each comparison. To discriminate the 3h IS group from the healthy (training set), MI (Cross Validation set, due to small sample size for MI), and SAVVY (training set) control groups, the PAM classification algorithm derived 17, 31, and 22 predictor probesets/genes, respectively. Putting these genes into PAM to predict the class of the subjects in the test groups yielded 87.9/94.7%, 98.5/82.4%, and 100/96.2% sensitivity/specificity for 3h IS compared to healthy, MI and SAVVY control samples, respectively (Supplementary Materials Figures 3, 4 and 5, respectively).
To discriminate the 24h IS group from the healthy (training set), MI (CV set, due to small sample size for MI), and SAVVY (training set) control groups, the PAM classification algorithm derived 20, 19, and 9 predictor probesets/genes, respectively. Putting these genes into PAM to predict the class of the subjects in the test groups yielded 90.9/94.7%, 93.9/88.2%, and 97/100% sensitivity/specificity for 24h IS compared to healthy, MI and SAVVY control samples, respectively (Supplementary Materials Figures 6, 7, and 8, respectively).
Prediction Accuracy of 3h IS Predictors on 3h IS, Healthy, MI and SAVVY Subjects
Combining the lists of the 3h predictors from the individual comparison analyses yielded 60 unique probe sets representing 56 annotated genes. Their prediction probability using PAM on the Test Set is presented in Figure 2A. The percent correctly predicted samples from PAM as well as the best performing prediction model (SVM) are presented in Table 4. Overall (normalized) accuracy was 91.2%. With SVM the sensitivity was 94% and specificities were 96% for SAVVY, 88% for MI, and 68% for healthy. Analysis in PAM produced lower sensitivity for IS but higher specificity for healthy subjects compared to SVM (Table 4). In addition to the split sample analysis, we performed a 10-fold Cross Validation which is a preferred method for developing and evaluating prediction algorithms for small sample sizes. This produced the expected better prediction results (Supplementary Table 2 and Supplementary Figure 9A).
Figure 2. PAM prediction accuracy of IS predictors in the current study.
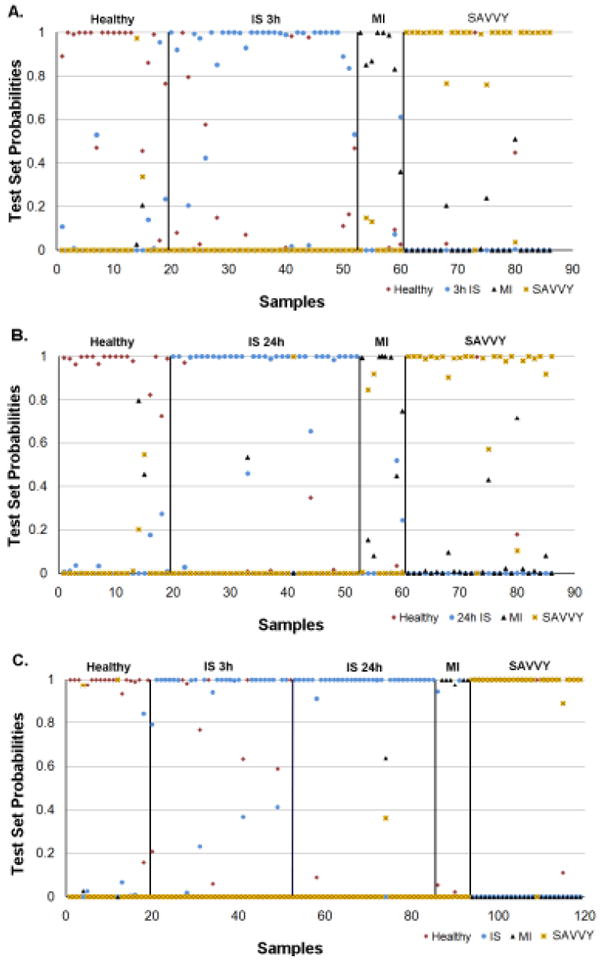
Prediction accuracy of the Test Set using PAM. Prediction Analysis of Microarrays (PAM) was used to perform the predictions (K-NN, neighbors n=10; threshold =0). For panels A, B and C the X-axis represents the patient sample number and the Y -axis represents Test Set probabilities. A sample is considered miss-classified if its correct class predicted probability is less than 0.5. The numbers of subjects in the Training Set were: 3h IS n=34; 24h IS n =33; SAVVY vascular controls n=26; and MI n=9. The numbers of subjects in the Test Set were: 3h IS n=33; 24h IS n=33; SAVVY n=26; and MI n=8.
A. 3h IS predictors. The 60-probe set predictors for 3h IS (combined from comparisons of 3h IS samples to healthy, MI and SAVVY samples from the Training Set) were put into PAM to predict the class of the Test Set subject samples by calculating the probability that they were in a given class.
B. 24h IS predictors. The 46-probe set predictors for 24h IS (combined from comparisons of 24h IS samples to healthy, MI and SAVVY samples from the Training Set) were put into PAM to predict the class of the Test Set subject samples by calculating the probability that they were in a given class.
C. Combined 3h and 24h IS predictors. The 97-probe set predictors for 3h IS and 24h IS (combined from comparisons of 3h IS and 24h IS samples to healthy, MI and SAVVY samples from the Training Set) were put into PAM to predict the class of the Test Set subject samples by calculating the probability that they were in a given class.
Table 4.
Classification Accuracy (%) of 3h and 24h Ischemic Stroke (IS) Predictors. Half of the subjects (training set) were used to derive the IS Predictors. For the Test Set prediction accuracy estimate on the second half of the subjects, there were 3h IS (n=33), 24h IS (n=33), healthy (n=19), Vascular Risk Factor (SAVVY) (n=26) and MI (n=8). The 60–probe set 3h IS predictors represented the sum of the 3h IS comparison to the three control groups: Healthy(17), SAVVY(22) and MI(31), of which 10 were common to the 3h IS vs MI and 3h IS vs SAVVY predictors, yielding 60 probe sets. The 46–probe set 24h IS predictors represented the sum of the 24h IS comparison to the three control groups: Healthy(20), SAVVY(9) and MI(17). The 3h and 24h IS Combined predictors represent the sum of the 3h IS predictors (60) and 24h IS predictors(46) of which 9 were common, yielding 97 probe sets.
| 60 probe sets 3h IS vs Controls (Healthy, MI, SAVVY) | 46 probe sets 24h IS vs Controls (Healthy, MI, SAVVY) | 97 probe sets 3h and 24h IS Combined vs Controls (Healthy, MI, SAVVY) | ||||
|---|---|---|---|---|---|---|
| Group | PAM | SVM* | PAM | SVM† | PAM | SVM‡ |
| IS | 85 | 94 | 91 | 94 | 86∥ | 95# |
| SAVVY | 92 | 96 | 92 | 96 | 96 | 96 |
| MI | 88 | 88 | 63 | 50 | 75 | 75 |
| Healthy | 84 | 68 | 89 | 84 | 84 | 68 |
See Supplementary Materials for complete footnotes.
Correct classification at 3h=76%, at 24h=97%.
Correct classification at 3h=94%, at 24h=97%.
Prediction Accuracy of 24h IS Predictors on 24h IS, Healthy, MI and SAVVY Subjects
Combining the lists of the 24h predictors from the individual comparison analyses yielded 46 unique probe sets representing 32 annotated genes. Their prediction probability using PAM on the Test Set is presented in Figure 2B. The percent correctly predicted samples from PAM as well as SVM (best performing prediction model) are presented in Table 4. Overall (normalized) accuracy was 89.2%. With SVM the sensitivity was 94% and specificities were 96% for SAVVY, 50% for MI and 84% for healthy. Better results were again obtained using a 10-fold cross validation (Supplementary Table 2 and Supplementary Figure 9B).
Prediction Accuracy of combined 3h and 24 IS Predictors on 3h and 24h IS, Healthy, MI and SAVVY Subjects
Combining the lists of the 3h and 24h predictors from the individual comparison analyses yielded 97 unique probe sets representing 79 annotated genes. Their prediction probability using PAM on the Test Set is presented in Figure 2C. The percent correctly predicted samples from PAM and SVM (best performing prediction model) are presented in Table 4. Overall (normalized) accuracy was 91.2%. With SVM the sensitivity was 95% and specificities were 96% for SAVVY, 75% for MI, and 68% for healthy. Analysis in PAM produced lower sensitivity for IS but higher specificity for healthy subjects compared to SVM (Table 4). Similarly, due to the small sample numbers of MI subjects, 10-fold cross-validation was performed which yielded somewhat better results (Supplementary Table 2 and Supplementary Figure 9C).
IV. Main Biological Function of Biomarkers Described
Using Ingenuity Pathway analysis software (see Supplementary Materials) the coagulation system was the only statistically over-represented bio-function in the combined 97-probe set list of 3h and 24h IS predictors. The coagulation genes included coagulation factor V (proaccelerin, labile factor) (F5) and thrombomodulin (THBD). GO annotations and the complete list of predictors are presented in Supplementary Table 3. Less stringent criteria yielded large numbers of genes with many more regulated pathways (not shown).
Discussion
Diagnosis of ischemic stroke is based on clinical impression combined with brain imaging. However, in the acute setting, brain imaging is not always readily accessible, and clinical evaluation by persons experienced in stroke is not always readily available. In such patients, a blood test could be of use to diagnose IS. Several protein biomarkers have been associated with IS, but in the acute setting these have not yet shown sufficient sensitivity nor specificity to be clinically useful 4-6. In this study we show that gene expression profiles could be used as biomarkers of IS, replicated our previous findings, and refined the gene expression signature of IS by including more relevant control groups.
We previously reported a 29-probe set profile that distinguished IS from healthy controls1. When this profile was used to predict a larger cohort of patients in this study, it distinguished IS from healthy subjects with a sensitivity of 92.9% and specificity of 94.7%. This is important in that it represents a validation of the concept that gene expression profiles can identify patients with stroke. Replication of gene expression profiles has been a challenge in the field, in large part due to false discovery associated with performing multiple comparisons. Robust biological responses and careful analyses made it possible to validate this 29-probe set profile in this study.
To obtain more biologically useful predictors of IS, we identified gene profiles that distinguish IS from patients with vascular risk factors and MI. Using the individual group comparisons, we predicted the diagnosis of IS compared to the vascular risk factor group with over 95% sensitivity and specificity. Using the individual group comparisons, we differentiated patients with IS from MI with over 90% sensitivity and over 80% specificity. Biologically, this suggests at least some differences in the immune responses to infarction in brain and heart.
The 3 hour time point was a focus of most comparisons because this represents the critical time when decisions are made regarding acute therapy such as thrombolysis. Thus, for the development of a point-of-care test, this time period is when gene expression profiles could be of greatest use. With the 60-probe set signature, at the 3 hour time point, we achieved correct classification rates of 85-94%, 92-96%, 88% and 68-84% for IS, vascular risk factor, MI and healthy controls, respectively. These are approaching clinical useful ranges.
Though RNA profiles were the focus in this study, the identified genes could be used as a guide in the evaluation of protein biomarkers for ischemic stroke. Genes for Factor 5 and thrombomodulin were both identified as differentially expressed in IS compared to controls. Both of these molecules have also been identified as proteins associated with IS1, 7,12. Many of the other genes we identified have not yet been studied, but may represent potential candidates for the development of protein biomarker profiles.
The goal of this study was not to identify all differentially expressed genes between IS and controls, but rather identify sets of genes whose patterns of expression may be useful for stroke diagnosis. As a result, these analyses have excluded large numbers of differentially expressed genes that are biologically relevant in IS. These will be the subject of future studies. Limitations of this study include (1) lack of stroke “mimics” in the control groups (2) lack of validation by qRT-PCR which would likely be used for clinical applications (3) the confounding treatment effects in the 5h and 24h blood samples from IS patients (4) race was not factored in due to different distributions with zero subjects in some of the race categories and (5) age is a confounder which we tried to address by factoring it in ANCOVA models and by selecting control groups with close age distribution to the IS patients. (6) Finally, an ANOVA for all of the groups combined yielded a significant number of regulated genes. However, these genes were not as predictive. This likely occurred because the PAM derivation of the training set of genes was not optimal, whereas individual group comparisons yielded more predictive genes. In the end, statistical validation was achieved by using our training set of genes to predict an independent test set of samples.
Supplementary Material
Acknowledgments
Acknowledgements and Funding This study was supported by NIH/NINDS grants NS056302 (FRS), PO21040N635110 (JPB) and the American Heart Association Bugher Foundation (FRS). Dr. Glen Jickling is a fellow of the Canadian Institutes of Health Research (CIHR). Drs. Huichun Xu, Brad Ander and Yingfang Tian are Bugher Fellows. This publication was also made possible by Grant Number UL1 RR024146 from the National Center for Medical Research to the CTSC at UC Davis (BS, GJ). Its contents are the responsibility of the authors and do not represent the official view of NCRR or NIH. We thank the investigators of the SPOTRIAS Stroke Network involved in the CLEAR trial at the University of Cincinnati for supplying blood samples for analysis. We appreciate the support of the MIND Institute, the Genomics and Expression Resource at the MIND Institute and the UC Davis Department of Neurology.
Footnotes
Disclosures No financial disclosures for all co-authors except for JB and AP. JB disclosures: Principal Investigator of NINDS-funded IMS III Trial, UC SPOTRIAS Center (includes NINDS-funded CLEARER and STOP-IT Clinical Trials), NINDS-funded Familial Intracranial Aneurysm (FIA) Study, and NINDS-funded T-32 Cerebrovascular Fellowship Training Program for Cerebrovascular Disease. Co-investigator of NINDS-funded Genetic and Environmental Risk Factors for Hemorrhagic Stroke, NINDS-funded “Comparison of Hemorrhagic and Ischemic Strokes Among Blacks and Whites”, and NINDS-funded IRIS Trial, CREST, COSS, and SWISS Studies.
Genentech Inc. (Supplier of alteplase for NINDS-funded CLEARER, IMS III trials). EKOS Corporation supplies catheter devices for ongoing IMD III clinical trial.
Concentric Inc. supplies devices for IMS III Trial.
Johnson and Johnson supplies catheters for IMS III Study.
Schering Plough supplies drug for NINDS-funded CLEARER Trial.
Boehringer Ingelheim – honoraria for speaking fees (honorarium last received on 2/15/08).
Consulting fees and honoraria are placed in an educational/research stroke fund in the Department of Neurology.
AP Disclosures: Research Grant- NINDS for CLEAR –ER Study; Other Research Support – Genentech and Schering Plough – Study Drug
References
- 1.Tang Y, Xu H, Du X, Lit L, Walker W, Lu A, Ran R, Gregg JP, Reilly M, Pancioli A, Khoury JC, Sauerbeck LR, Carrozzella JA, Spilker J, Clark J, Wagner KR, Jauch EC, Chang DJ, Verro P, Broderick JP, Sharp FR. Gene expression in blood changes rapidly in neutrophils and monocytes after ischemic stroke in humans: A microarray study. J Cereb Blood Flow Metab. 2006;26:1089–1102. doi: 10.1038/sj.jcbfm.9600264. [DOI] [PubMed] [Google Scholar]
- 2.Thom T, Haase N, Rosamond W, Howard VJ, Rumsfeld J, Manolio T, Zheng ZJ, Flegal K, O’Donnell C, Kittner S, Lloyd-Jones D, Goff DC, Jr, Hong Y, Adams R, Friday G, Furie K, Gorelick P, Kissela B, Marler J, Meigs J, Roger V, Sidney S, Sorlie P, Steinberger J, Wasserthiel-Smoller S, Wilson M, Wolf P. Heart disease and stroke statistics--2006 update: A report from the american heart association statistics committee and stroke statistics subcommittee. Circulation. 2006;113:e85–151. doi: 10.1161/CIRCULATIONAHA.105.171600. [DOI] [PubMed] [Google Scholar]
- 3.WHO. The atlas of heart disease and stroke. 2005 [Google Scholar]
- 4.Whiteley W, Tseng MC, Sandercock P. Blood biomarkers in the diagnosis of ischemic stroke: A systematic review. Stroke. 2008;39:2902–2909. doi: 10.1161/STROKEAHA.107.511261. [DOI] [PubMed] [Google Scholar]
- 5.Foerch C, Montaner J, Furie KL, Ning MM, Lo EH. Invited article: Searching for oracles? Blood biomarkers in acute stroke. Neurology. 2009;73:393–399. doi: 10.1212/WNL.0b013e3181b05ef9. [DOI] [PMC free article] [PubMed] [Google Scholar]
- 6.Jensen MB, Chacon MR, Sattin JA, Levine RL, Vemuganti R. Potential biomarkers for the diagnosis of stroke. Expert Rev Cardiovasc Ther. 2009;7:389–393. doi: 10.1586/erc.09.9. [DOI] [PubMed] [Google Scholar]
- 7.Moore DF, Li H, Jeffries N, Wright V, Cooper RA, Jr, Elkahloun A, Gelderman MP, Zudaire E, Blevins G, Yu H, Goldin E, Baird AE. Using peripheral blood mononuclear cells to determine a gene expression profile of acute ischemic stroke: A pilot investigation. Circulation. 2005;111:212–221. doi: 10.1161/01.CIR.0000152105.79665.C6. [DOI] [PubMed] [Google Scholar]
- 8.Pancioli AM, Broderick J, Brott T, Tomsick T, Khoury J, Bean J, del Zoppo G, Kleindorfer D, Woo D, Khatri P, Castaldo J, Frey J, Gebel J, Jr, Kasner S, Kidwell C, Kwiatkowski T, Libman R, Mackenzie R, Scott P, Starkman S, Thurman RJ. The combined approach to lysis utilizing eptifibatide and rt-pa in acute ischemic stroke: The clear stroke trial. Stroke. 2008;39:3268–3276. doi: 10.1161/STROKEAHA.108.517656. [DOI] [PMC free article] [PubMed] [Google Scholar]
- 9.Bolstad BM, Irizarry RA, Astrand M, Speed TP. A comparison of normalization methods for high density oligonucleotide array data based on variance and bias. Bioinformatics. 2003;19:185–193. doi: 10.1093/bioinformatics/19.2.185. [DOI] [PubMed] [Google Scholar]
- 10.Stamova BS, Apperson M, Walker WL, Tian Y, Xu H, Adamczy P, Zhan X, Liu DZ, Ander BP, Liao IH, Gregg JP, Turner RJ, Jickling G, Lit L, Sharp FR. Identification and validation of suitable endogenous reference genes for gene expression studies in human peripheral blood. BMC Med Genomics. 2009;2:49. doi: 10.1186/1755-8794-2-49. [DOI] [PMC free article] [PubMed] [Google Scholar]
- 11.Tibshirani R, Hastie T, Narasimhan B, Chu G. Diagnosis of multiple cancer types by shrunken centroids of gene expression. Proc Natl Acad Sci U S A. 2002;99:6567–6572. doi: 10.1073/pnas.082099299. [DOI] [PMC free article] [PubMed] [Google Scholar]
- 12.Kozuka K, Kohriyama T, Nomura E, Ikeda J, Kajikawa H, Nakamura S. Endothelial markers and adhesion molecules in acute ischemic stroke--sequential change and differences in stroke subtype. Atherosclerosis. 2002;161:161–168. doi: 10.1016/s0021-9150(01)00635-9. [DOI] [PubMed] [Google Scholar]
- 13.Asyali MH, Colak D, Demirkaya O, Inan MS. Gene expression profile classification: A review. Current Bioinformatics. 2006;1:55–73. [Google Scholar]
- 14.Jain AK, Duin RPW, Mao J. Statistical pattern recognition: A review. IEEE Transactions On Pattern Analysis and Machine Intelligence. 2000;22:4–37. [Google Scholar]
Associated Data
This section collects any data citations, data availability statements, or supplementary materials included in this article.