Victor, J.D., Mechler, F., Repucci, M.A., Purpura, K.P., and Sharpee, T. (2006) Responses of V1 neurons to two-dimensional Hermite functions. J. Neurophysiol. 95, 375-400.
As a result of a normalization error, the values of the filters L (but not E) plotted in Figures 3, 5, and 6 are twice as large as they should be. Consequently, cells described as “under-rectified” (Figure 3A, 3B, 5A, 5B, 6A) should have been described as “half-wave rectifying”, consistent with the illustrated post-stimulus histograms.
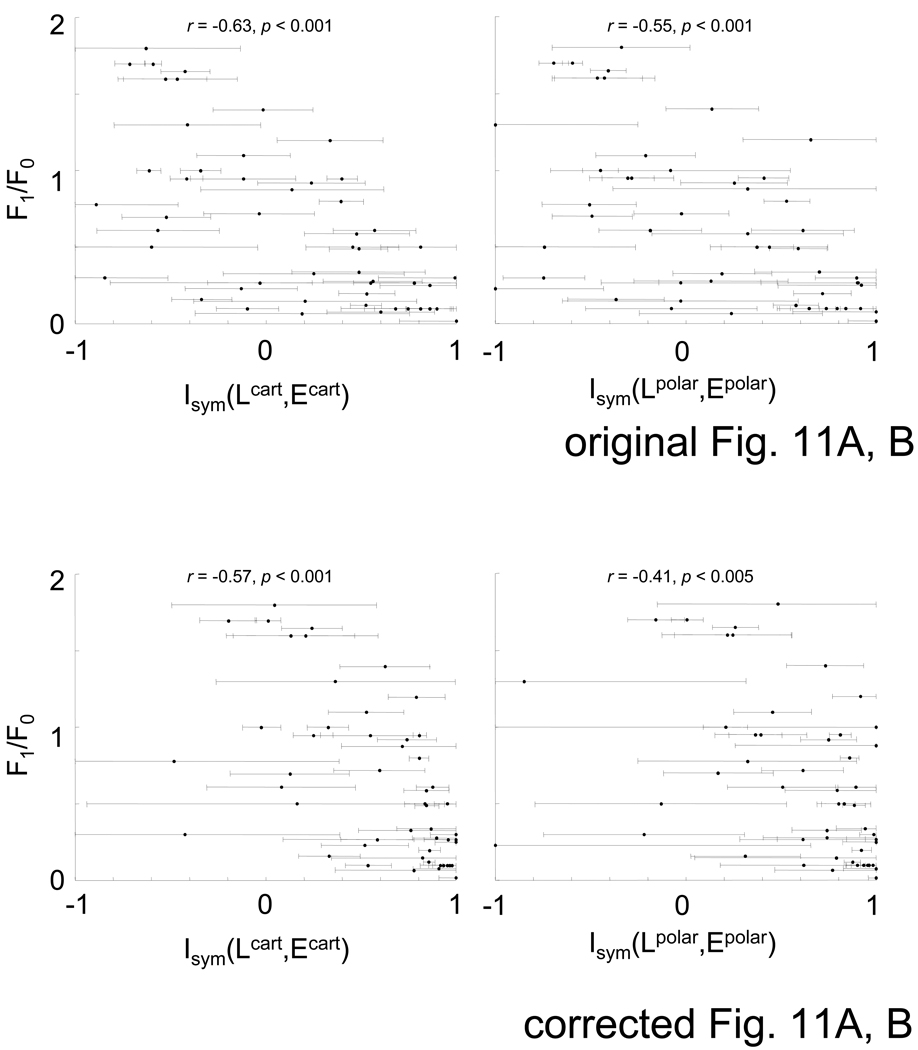
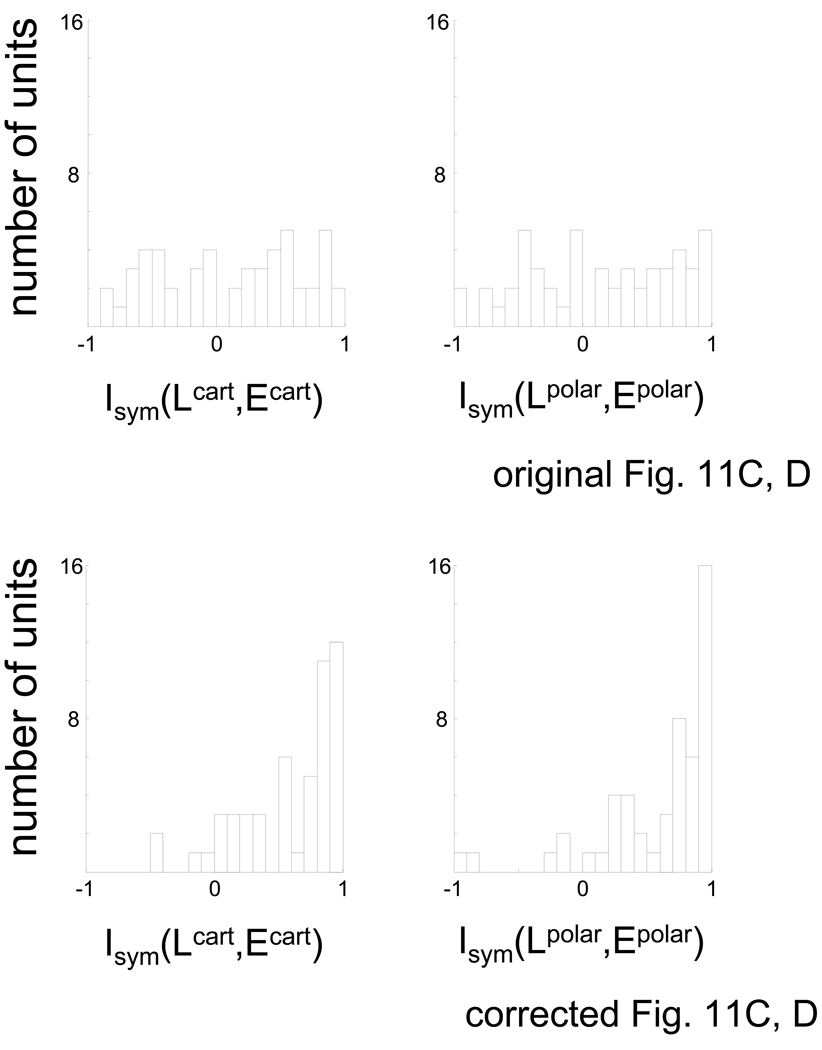
Correction of this error shifts values of the index Isym (quoted in the text and plotted on the abscissa of Figure 11) towards 1, i.e., the “complex” end of the simple vs. complex spectrum. The correct value of the index and the published value are related by
Figure 11.
Relationship of indices of overall nonlinearity Isym(L, E) (eq.(5)) determined from Cartesian (A) and polar (B) responses to the F1 / F0 ratio used to classify cells as simple and complex. For both Cartesian and polar measurements, units with Isym close to 1 tended to have small values (“complex”) of the F1 / F0 ratio. Panels C and D: distribution of these indices across the population. These distributions for Cartesian and polar responses are similar.
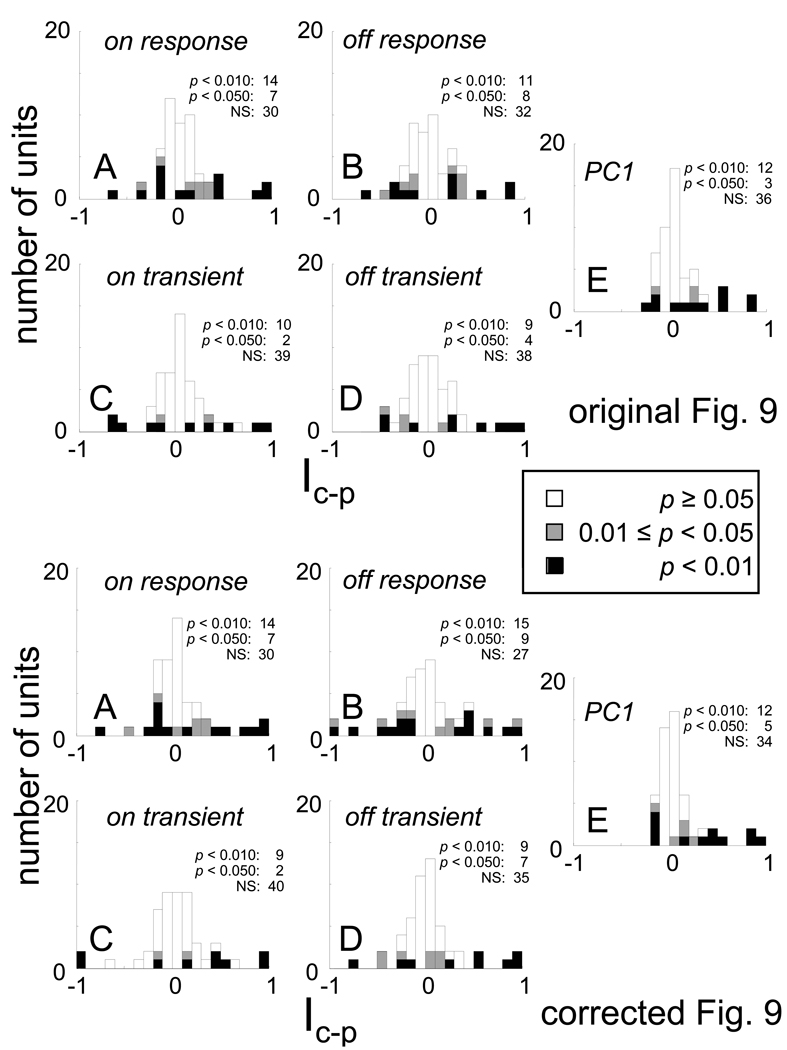
Correction of this error also alters the values of Ic-p by decreasing the weighting of contributions from the L-component, but these changes are slight (Figure 9).
Figure 9.
Distribution of relative responsiveness to Cartesian and polar stimuli, Ic- p (eq. (11)). Values > 0 indicate larger responses to Cartesian stimuli; values < 0 indicate larger responses to polar stimuli. Significance levels are calculated via jackknife and shown as in Figure 7. Each panel contains calculations based on a different response measure.
The error does not affect the index Ishape, which quantifies the difference between the responses to Cartesian and polar stimuli, and thus does not alter any of the conclusions of the paper.


