

Abstract
High field (≥3T) cardiac MRI is challenged by inhomogeneities of both the static magnetic field B0 and the transmit radiofrequency (RF) field B1+. The inhomogeneous B fields do not only demand for improved shimming methods, but they furthermore impede the correct determination of the zero order terms, i.e. the local resonance frequency f0 and the RF power to generate the intended local B1+ field. In this work dual echo time B0-map and dual flip angle B1+-map acquisition methods are combined to acquire multi-slice B0- and B1+-maps simultaneously covering the entire heart in a single breath-hold of 18 heart beats. A previously proposed excitation pulse shape dependent slice profile correction is tested and applied to reduce systematic errors of the multi-slice B1+-map. Localized higher order shim correction values including the zero order terms for frequency f0 and RF power can be determined based on the acquired B0- and B1+-maps. This method has been tested in 7 healthy adult human subjects at 3T and improved the B0 field homogeneity (standard deviation) from 60Hz to 35Hz and the average B1+ field from 77% to 100% of the desired B1+ field when compared to more commonly used preparation methods.
Keywords: cardiac MR, 3 Tesla, localized shimming, localized power preparation, B1-map, B0-map
Introduction
The increased signal-to-noise ratio (SNR) at the static magnetic field (B0) of 3T may improve cardiac MRI and MR spectroscopy (MRS) applications that are constrained by limited SNR at 1.5T (1,2). However, cardiac MR at 3T is challenged by increased B0-inhomogeneity due to susceptibility. Noeske et al reported B0 field variations over the left ventricle (LV) of ±130Hz (3). Furthermore, the overall increased B0-inhomogeneity makes the determination of the on-resonance frequency f0 more challenging. The combination of increased B0-inhomogeneity and potential off-resonance in the heart may lead to image artifacts and distortions, especially when applying balanced steady-state free precession sequences (4) or fat suppression.
One way to improve B0 field homogeneity is to perform localized shimming followed by a frequency scout pre-scan, in which a series of single-shot images with incremental f0 are acquired (5). The f0 that yields best image quality is then visually selected by the operator and used for the subsequent high resolution scan. Another solution is to determine both localized second order shim corrections and localized on-resonance frequency f0 at the same time based on an acquired B0-map (6).
In addition to B0 inhomogeneity, both numerical simulations (7) and measurements (8) have shown that the transmit radiofrequency (RF) field B1+ in the heart is more inhomogeneous at 3T as compared to 1.5T. Conventional methods to measure B1+-maps, such as the dual angle method (DAM) (9,10) or the Actual Flip-angle Imaging (AFI) method (11), are rather time consuming and may not easily be used for the heart because of blood flow and cardiac/respiratory motion. Recently, the saturated double angle method (SDAM) to acquire a B1+-map covering the heart within a single breath-hold was introduced (12). Applying SDAM, Sung et al reported a flip angle variation ranging from 31% to 66% over the entire LV volume (13). As the variation was predominantly unidirectional in short-axis slices, they proposed to use 3ms long two-dimensional RF pulses to reduce the average flip angle variation in short axis slices over the LV by 41% (14). Sung et al reported a flip angle distribution from 34° to 63° across the LV for a nominal flip angle of 60° (13). This suggests that the B1+ field over the LV is not only inhomogeneous, but that the average flip angle (RF power setting) can be 20% lower than the requested 60°. Such erroneous RF power settings may lead to local signal reduction, artifacts, failure of magnetization preparation pulses, and eventually to biased quantitative measures. Similar to a B0-map based localized frequency and shim optimization, the acquired B1+-map may be used to locally optimize the transmit RF power settings.
The goal of the present study was the integration of the B0- and the B1+-map acquisitions into one single breath-hold for fast determination of localized shim, f0, and RF power settings.
Methods
B0-map Acquisition
B0-maps can be obtained from two gradient echo images acquired with different echo times TE1 and TE2. For cardiac B0-maps, these acquisitions are usually triggered to the R-wave of the ECG and measured in a breath-hold to minimize artifacts related to cardiac and respiratory motion. The off-resonance at the location given by image pixel r can then be determined according to:
| [EQ 1] |
where ϕ(r, TE) is the image phase at location r acquired with TE, and γ is the gyromagnetic ratio of protons.
B1+-map Acquisition
B1+-maps applying the SDAM method (12,13) are obtained by acquiring two gradient echo images with excitation flip angles α and 2α, respectively. To enable TRs of one heart beat, which is typically shorter than the T1 of blood, the magnetization has to be ‘reset’ with a B1+-insensitive saturation pulse. This reset pulse is performed immediately after the R-wave of the ECG is detected. After a saturation recovery time period TSR, image data are acquired in a multi-slice fashion, where each imaging slice is only excited once per heart beat. Therefore, by using segmented k-space gradient echo imaging, only one k-space line can be acquired per slice and heart beat, which makes this approach rather time inefficient. However, this shortcoming can be avoided by using a more time efficient spiral signal readout which enables multi-slice B1+-map data acquisition in a single breath-hold. The effective local flip angle can then be determined as:
| [EQ 2] |
where Iα(r) is the image intensity at location r acquired with the nominal flip angle α. Instead of the effective flip angle, the percentage of the desired B1+ field will be reported as: αeffective / α·100%.
Simultaneous B0- and B1+-map Acquisition
In this work, the SDAM B1+-map acquisition method was extended to additionally acquire a second image for each slice with a longer echo time TE2 to simultaneously generate a B0-map. A schematic of the combined B0- and B1+-map acquisition is shown in Figure 1. The multi-slice acquisition is cardiac triggered and the magnetization is reset with an 8ms long 90° BIR-4 pulse followed by the saturation recovery time TSR. Subsequently, spiral imaging is performed after a frequency selective fat saturation pulse. The magnetization of each slice is now excited twice and image data are acquired first with TE1 and then with TE2. The duration of the acquisition in heart beats is determined by the number of acquired spiral interleaves per imaged slice multiplied by two (for the two flip angles). This acquisition results in four images per slice location with all combinations of flip angles α and 2α and with the echo times TE1 and TE2 respectively. The combinations α-TE1 and 2α-TE1 are used to calculate the B1+-map (EQ 2), whereas α-TE1 and α-TE2 are used to calculate the B0-map (EQ 1). To reduce the overall RF power, the flip angle of the 2α-TE2 acquisition can be set to zero as this image is currently not being used.
Figure 1.

Schematic of the combined B0- and B1+-map acquisition. The multi-slice acquisition is cardiac triggered, the magnetization is reset with an 8ms 90° BIR-4 pulse, relaxed during TSR, and acquired with spiral readouts after a frequency selective fat saturation pulse. Each acquisition box in the figure denotes slice (S1-Sn), excitation angle (0°, α, or 2α), and TE (TE1 or TE2). The two shown cardiac cycles will be repeated according to how many spiral interleaves are acquired. Combinations of α-TE1 and 2α-TE1 lead to the B1+-map, and α-TE1 and α-TE2 to the B0-map.
Slice Profile Correction
The measured signal intensity in a multi-slice acquisition depends not only on the RF excitation angle (B1+ field amplitude) but also on the slice profile of the applied RF pulse shape. Nonuniform excitation across the slice profile and changes in the slice profile for different flip angles may introduce significant errors in the measured B1+ when using EQ 2 (11,15). To correct for this potential slice profile imperfection, the integral of the complex signal along the excitation profile IαBloch was determined based on Bloch-equation simulations of different pulse shapes (Figure 2 for the “spredrex” pulse, 2A showing the RF waveform) and for a range of nominal RF excitation angles from 0°-180° (Figure 2B-E). The calculated signal intensities were entered in EQ 2 to determine the flip angle αBloch, which is affected by the slice profile error:
| [EQ 3] |
Plotting αBloch against α leads to the correction lookup table, where α is the corrected effective flip angle for the measured, erroneous flip angle αBloch. Lookup tables were generated for four different RF pulse shapes shown in Figure 2A and Figure 3A: the “spredrex” pulse (time bandwidth product (tBW) = 14.17), sinc-Gaussian pulses with either one (“SG100”, tBW = 2.14) or three lobes (“SG300”, tBW = 6.00), and a numerical optimized “Optex 1” pulse (tBW = 9.56).
Figure 2.
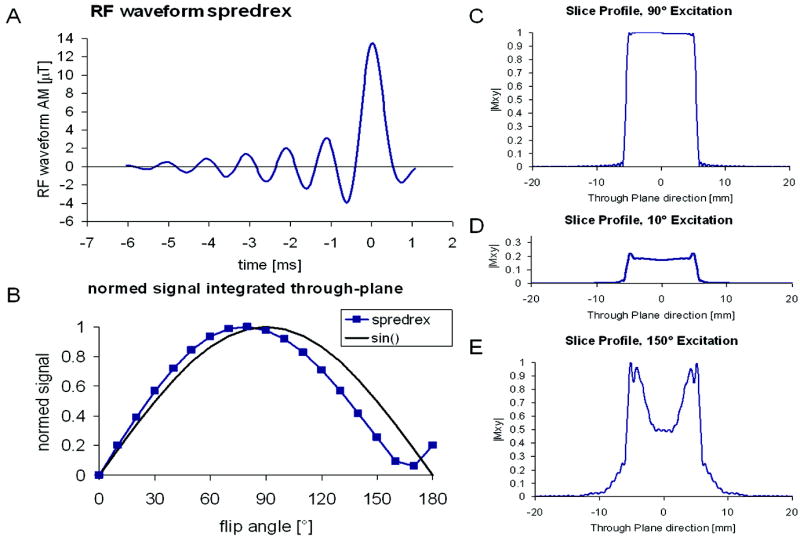
A) The RF waveform of the “spredrex” excitation pulse. B) shows the normalized signal integrated over the slice profile for a range of nominal flip angles from 0 to 180°, the sine curve is shown as a reference. C)-E) show the slice profile of the magnitude of the transverse magnetization calculated by numerical integration of the Bloch equations for 90°, 10°, and 150° nominal flip angle.
Figure 3.
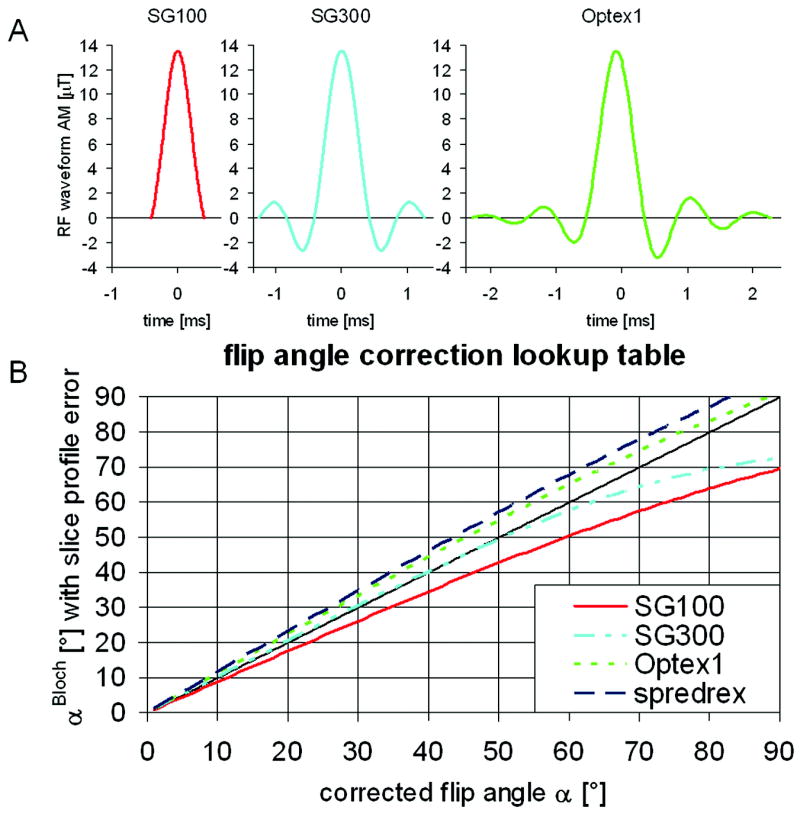
Look-up table to correct the determined flip angle from the slice profile error for the following excitation pulse shapes: the “spredrex” pulse shape shown in figure 2A), and the pulses shown in A) “SG100”, “SG300”, and “Optex 1”. Slice profile effects lead to an over- or underestimation of the determined effective flip angle αBloch. The table was determined by entering the integrated signal over a Bloch-equation simulated slice profile (Figure 2B) into EQ 3.
In Vitro and In Vivo Abdominal Validation Studies
In vitro phantom studies and in vivo human experiments were conducted for validation. The in vivo protocol was approved by the Institutional Review Board at Johns Hopkins University and all participants provided written informed consent. The proposed method was implemented on a commercial 3T Achieva scanner (Philips Healthcare, Best, The Netherlands) and tested in a water/fat phantom, consisting of a 5 liter bottle filled with separated tab water and baby oil (Johnson and Johnson, Langhorne, PA), and in the abdomen of one healthy adult volunteer. To test the validity of the proposed B1+-map acquisition, a more conventional AFI B1+-map (11) was acquired with the following parameters: 3D acquisition with non-selective block pulse RF excitation, α=80°, TR1/TR2=27/127ms, 400mm field of view (FOV), 79 slices, (5mm)3 voxel size, scan duration=16 minutes, strong crusher gradients to maximize spoiling of the transverse magnetization.
The following parameters were used for the proposed combined B0- and B1+-map acquisition scheme: TR/TE1/TE2=22/2.85/5.15ms using the asymmetric “spredrex” pulse shape, α=60°, 6 slices, 5mm slice thickness, 5-10mm gap depending on needed volumetric coverage, FOV=(400mm)2, 9 spiral interleaves with 3ms readout each, acquired / reconstructed voxel size=(5/2.5mm)2, TSR=350-710ms depending on heart rate and RF power settings, frequency selective fat saturation pulse, breath-hold duration = 18 heart beats. Additionally, phantom measurements were performed with the other three pulse shapes discussed above. Furthermore, in the phantom one acquisition was performed without fat saturation using the “spredrex” pulse shape. On the resultant B1+-maps obtained with both the AFI method and the proposed new method, B1+ signal intensity profiles along a line within the phantom/body as shown in Figure 4 were compared and the average error along the profile was determined for the proposed method with and without slice profile correction: errork = (| B1+kproposed-B1+AFI |)/B1+AFI·100%, where k refers to either with or without slice profile correction.
Figure 4.

B1+ profile in percentage of the desired B1+ field along a line of an axial image in a phantom, A), and in the abdomen of a volunteer, B). Shown are the proposed method (solid) acquired with the “spredrex” pulse shape, the conventional AFI method (dashed), and the proposed method without slice profile correction (dotted) or without fat saturation (dash and 2 dots). The insets delineate the locations of the shown profiles.
In Vivo Human Heart Studies
Combined B0- and B1+-maps of the hearts of seven volunteers (4 men, 30±6 years, 73±24 [46:118] kg body weight) were acquired using the linear auto shim and the standard RF power preparation as implemented in the product software of the scanner. These maps were obtained in two different spatial orientations in each volunteer: First, six slices in a short-axis (SA) orientation; and second, six slices in a pseudo long-axis (LA) orientation orthogonal to the short-axis orientation were obtained. For each orientation, a region of interest (ROI) was manually drawn: SA ROI in the short-axis orientation covering both left and right ventricles (see Figure 5) and LA ROI in the pseudo long-axis orientation covering the entire heart (including the atria). Localized second order shim values, f0, and RF power settings were determined offline using a modified version of a previously presented shimming tool (6) implemented in IDL (Research Systems, Inc., Boulder, CO) under Windows Vista (Microsoft, Redmond, WA) on a commercial personal computer. The thus obtained parameter values were then written to the scanner hard drive and were used for a second acquisition in both orientations. This process (loading images to shimtool, drawing ROI, calculating values and sending them back to the scanner) takes about 1-2 minutes. If the results of the algorithm led to RF power settings above the scanner’s safety boundaries, the maximum B1+ amplitude in the sequence was manually decreased to an allowed value while the duration of RF pulses was increased accordingly to achieve the prescribed flip angles.
Figure 5.

Exemplary cardiac B0- and B1+-maps from one volunteer. Shown are the magnitude, A), the B0-map, B), and the B1+-map, C) of a mid-apical short axis slice acquired with automatic linear shim and standard RF power preparation. Based on the acquired B0- and B1+-maps shim, f0, and RF power values were calculated optimized for a ROI covering both ventricles. These values were applied for the acquisition of the B0- and B1+-maps shown in D) and E), respectively. In the shown slice, applying the locally optimized values improved the mean frequency offset over the heart from 26 to 2Hz, the peak to peak variation of the frequency over the heart from 235 to 86Hz, and the average B1+ from 73 to 106% while the variation in B1+ stayed the same.
On the B0-maps, the mean and the standard deviation (SD) of the off-resonance frequencies found in the ROIs were determined for each volunteer in both acquisition orientations before and after localized optimization. Likewise, the mean and the SD of % of the desired B1+ were determined from the B1+-maps. A paired, two tailed Student’s t-test was then performed to compare these values before and after optimization, and among the two ROIs. A p-value of less than 0.05 was considered statistically significant.
Blood flow and cardiac motion may lead to errors in the acquired B1+-maps as the slices are acquired consecutively and saturated spins from adjacent slices may lead to cross contamination. Therefore the B1+-maps acquired in orthogonal orientations (SA vs. LA) were compared with spatial co-registration. In each volunteer the average B1+ was measured in twelve small volumes (20mm)3 distributed throughout the left and right ventricle. These volumes were selected on the SA B1+-maps. The off-center locations in scanner coordinates were determined and then used to find the same locations in the LA B1+-maps. Because the RF power was determined with the scanner’s standard RF power determination for both acquisitions, the measured B1+ values from the LA maps were scaled with the applied RF power values RFpowerSA and RFpowerLA of the SA and the LA acquisitions to be comparable: B1+LA, scaled = B1+LA · RFpowerSA / RFpowerLA. The scaled values were then compared using linear regression analysis.
Application: Cardiac Spectroscopy
As an example application, cardiac single voxel spectra were acquired in two of the volunteers. A 12×25×25mm3 volume in the septum was localized using point-resolved spectroscopy (PRESS) (16) and acquired with the following parameters: TR/TE=6000/36ms, 2000Hz bandwidth, no water suppression, 1024 data points, navigator echo and ECG double triggered to end-expiration and end-systole (17), 8 averages. Shim, f0, and RF power settings were calculated from the acquired B0- and B1+-maps for a slightly bigger volume of about 30×40×40mm3 with the same off-center values as the MRS volume. The spectra were acquired twice, once with the calculated localized RF power settings and once using the standard RF power preparation. All other parameters including the receive gain were kept constant for the two acquisitions. Line width and peak area of the water peak were determined using the AMARES algorithm of the jMRUI package (18).
Results
First, lookup tables to correct for slice profile errors in the determined B1+-maps based on Bloch-equation simulations were generated for four RF pulse shapes which are widely used. The correction lookup tables are shown in Figure 3B. The error can be as large as 23% for the “SG100” pulse shape.
Profiles of the measured B1+-maps acquired with the proposed method with and without slice profile correction and acquired with the conventional AFI method of the phantom and the abdomen are shown in Figure 4. Green lines in the inset of the figures depict the location of the shown profiles. In the water/fat phantom, maps were also acquired without fat saturation. The interface between water and fat appears to be more blurry for the B1+ profile when compared to the one acquired with fat suppression (Figure 4A); furthermore, the profile acquired with AFI shows a strong jump at the interface. In the phantom, slice profile correction reduced the average error along the B1+ profile across the water/fat interface from 11, 14, 10, and 9% to 4, 8, 9, and 4% for the “spredrex”, “SG100”, “SG300”, and “Optex 1” pulse shapes, respectively. Applying no fat saturation pre-pulse did not change the average error after slice profile correction (4%). In the abdomen, the average error was reduced from 26% to 11% when applying slice profile correction.
Example cardiac B0- and B1+-maps from one volunteer acquired in SA orientation are shown in Figure 5. The first row shows magnitude, B0-, and the B1+-maps acquired with the scanner’s standard preparation. The second row shows the B0-, and the B1+-maps acquired with the proposed localized method based on the maps shown in the first row. In the example in this Figure, and consistent with the numerical findings below, the B0 variations (middle column) within the ROI are clearly reduced when comparing the scanner’s standard preparation (upper row) to the new proposed method (lower row). Furthermore, and as seen in the right column of this Figure, the average B1+ after correction approaches the desired value while it was too low by 27% with the standard preparation.
Figure 6 shows the mean frequency offset and the frequency variation (SD) for the SA and LA ROIs averaged over the seven volunteers. The error bars denote one SD of these values among the seven volunteers. Applying locally optimized preparation values improved both the mean and the variation of the B0 field. However, only the reduction in field variation was found to be statistically significant. Furthermore, the B0 variation of the SA ROI was statistically significantly lower than the variation of the LA ROI when applying the proposed localized second order shim.
Figure 6.

B0-inhomogeneity when applying auto preparation compared to applying the calculated preparation values based on the proposed method. Shown are the mean offset frequency and the B0 variation (standard deviation) for the SA ROI (both ventricles) and the LA ROI (entire heart). The B0 variation was significantly reduced (* p<0.05 paired Student’s t-test). Error bars show standard deviation over 7 volunteers.
The measured B1+ offset and variation are shown in Figure 7. Average B1+ in the ventricles and the entire heart was 73% and 77% of the desired B1+ field, respectively. After localized preparation, the average B1+ in both ROIs was significantly improved to 99% and 100%, respectively. The variation in B1+ in both ROIs was measured 11-13% before and after localized correction.
Figure 7.

B1+-inhomogeneity when applying auto preparation compared to applying the calculated preparation values based on the proposed method. Shown are the mean B1+ and the B1+ variation (standard deviation) for the SA ROI (both ventricles) and the LA ROI (entire heart). The mean B1+ was significantly corrected (* p<0.05 paired Student’s t-test). Error bars show standard deviation over 7 volunteers.
Figure 8 shows the average B1+ measured in twelve small volumes in each volunteer acquired with orthogonal slice orientations LA and SA in the heart. The linear regression line has an intercept of 15 and a slope of 0.84. The coefficient of determination R2 is equal to 0.48. Also shown in Figure 8 are the average B1+ values over the twelve volumes for each volunteer.
Figure 8.

Linear regression analysis correlating the B1+-maps acquired in two orthogonal imaging orientations. In each volunteer B1+ was determined at twelve identical locations within the left and right ventricles in both orientations (diamonds). The twelve values of each volunteer were also averaged and shown as boxes.
Figure 9 shows the volume localization and the acquired cardiac spectra from one volunteer. In this volunteer, the RF power was increased by 46% for the acquisition with the proposed B1+- map based power determination compared to the standard RF power determination. This increased the area of the water peak by 303%. In the second volunteer, the increase was 22%. The line width of the water peak was 19Hz and 14Hz for the two subjects.
Figure 9.
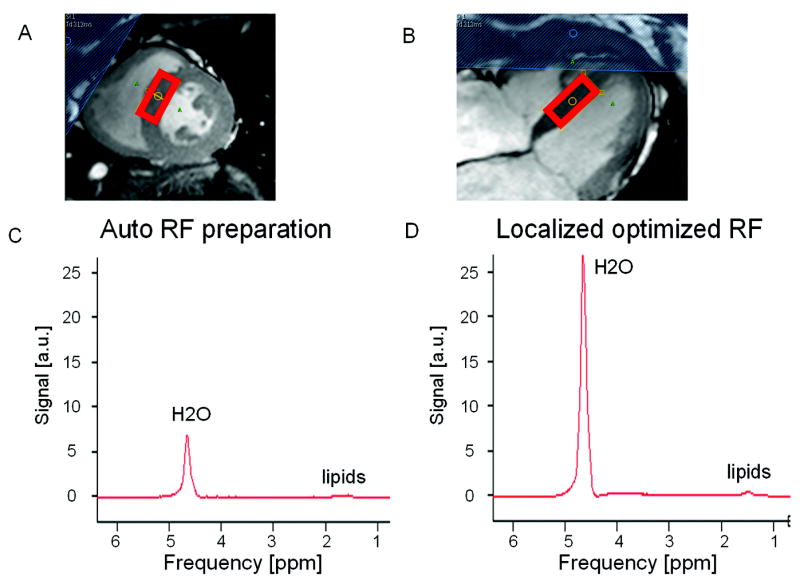
Non water suppressed cardiac proton spectra acquired in the septum of a volunteer. The location of the PRESS localization volume is shown in a short axis, A) and a long axis, B) cine time frame image acquired at end-systole. In this example the water peak area increases by 303% when comparing the spectrum acquired with auto RF power preparation, C), versus the one acquired with locally optimized RF power settings based on the acquired B1+-map, D).
Discussion
The proposed method allows the simultaneous acquisition of multi-slice B0- and B1+-maps in the heart within a single breath-hold, enabling fast determination of localized shim, f0 and RF power settings. Localized f0 and higher order shim determination based on acquired B0-maps have been shown to be useful for both cardiac MRI and MRS before (6,17). The proposed combined method enables to additionally optimize the local B1+ field, i.e. the excitation flip angle at no extra cost in scanning time. The measured B1+ field in the heart, when using the conventional power optimization algorithm of the system, was about 25% lower than the nominal value, which is consistent with prior reports by others (13). The example of a single voxel double spin echo spectroscopy experiment demonstrates the potential signal gain when locally optimizing the excitation flip angle. The highly localized single voxel experiment is likely to benefit most as the signal originates from a small region only. Nevertheless, the technique should improve MRI techniques with a larger FOV as well, especially spin echo and multiple spin echo sequences. Fat suppressed imaging may be another potential application where the combined localized B0 shim and average RF power settings might be useful as the fat saturation pre-pulse critically depends on correct RF frequency settings, good B0 homogeneity, and a correct flip angle. While the optimized RF power settings (zero order) improve the performance of both MRI and MRS, actual higher order B1+-shimming, using a multi-channel transmit architecture, may be needed for further improvements (19,20). In addition to the determination of optimal RF power settings, the acquired B1+-map may be used in post processing to correct T1- or T2-maps.
Shimming the entire heart is more challenging than shimming only the ventricles as the frequency variation after localized shimming is significantly lower in the SA ROI, which covers the ventricles only, when compared to the LA ROI, which covers the entire heart. It may therefore be advantageous to acquire functional data in a short axis orientation where a smaller volume has to be shimmed.
The average B1+ values in the ventricles measured with orthogonal slice orientation agree very well except in one volunteer (boxes in Figure 8). Therefore, for RF scale determination of a large volume of the heart, the acquisition orientation can be chosen more freely. It will be much simpler and faster to plan an axial orientation instead of a short or long axis orientation. However, the current quality of the B1+-maps may not be sufficient for e.g. a pixel by pixel correction of quantitative images.
The slice profile correction, which has been proposed before (11,15), is necessary to reduce systematic errors. Analyses of four different excitation pulse shapes have shown that without slice profile correction the calculated B1+-map can both be over or under estimated depending on the excitation pulse shape. In the phantom experiments, the slice profile correction did not have a large effect on the B1+-map acquired with the “SG300” pulse. This is expected, as the correction lookup table (Figure 3B) shows only a small error for this pulse shape as long as α stays relatively small. The average error of the “spredrex” and the “Optex 1” pulses was smaller than for the sinc-Gaussian pulses when compared to the AFI based B1+-map. One reason may be that the sinc-Gaussian pulses do not have as sharp an excitation profile as the other two pulse shapes, and therefore, slice to slice contamination may affect the results of the multi-slice acquisition. Another reason may be that the very asymmetric “spredrex” pulse allows for a very short TE, which reduces blurring and other artifacts in the spiral readout. Significant blurring of the phantom’s fat compartment was observed in the acquisitions not acquired with the “spredrex” pulse shape. For these reasons, we chose to use the “spredrex” pulse shape for all in-vivo acquisitions. The results from one B1+-map acquired in the phantom without fat saturation had the same low average error of 4% as its counterpart acquired with fat saturation, suggesting that a fat saturation pre-pulse does not have an adverse effect on the B1+-map acquisition. By applying the slice profile correction, the proposed B1+-map agreed within less than 11% with a B1+-map acquired with the more conventional AFI method in the abdomen of a volunteer.
The SDAM method is inherently limited to an effective flip angle range between approximately 20° and 80°. In case the effective flip angle is low, the noise will start to dominate in the flip angle or B1+-map. Sung et al have shown that noise is kept sufficiently low for effective flip angles larger than 20° while the base SNR in the acquired images is about 70-120 (13). A similar argument can be made for effective flip angles larger than 160° in the 2α image acquisition. Figure 8 shows measured B1+ variations over the ventricles from 40-120%, which means the effective flip angles are well within the 20°-80° range when exciting with a nominal flip angle α of 60°. It remains to be seen if this method can be applied at even higher magnetic field strengths as well, since B1+-inhomogeneities are expected to be even higher.
A critical component of the SDAM method is the saturation or reset pulse because of its sensitivity to B0- and B1+-inhomogeneities. In this study a 8ms BIR-4 pulse was applied as has successfully been used at 3T before (12-14). Recently, it has been shown that a tailored hard-pulse train results in better saturation and less RF power deposition compared to a 8ms BIR-4 saturation pulse (21). This new reset pulse can easily be combined with the presented method and should further improve stability.
In summary, we have implemented and validated a new methodology to simultaneously acquire B0- and B1+-maps in the heart. As part of this algorithm, slice profile correction for different RF pulse shapes is integrated and helps to correct B1+ map errors of up to 23%. The combined B0- and B1+-map can be acquired within 18 heart beats only which supports the use of breathholding as a mechanism to suppress respiratory motion. The combined acquisition of the B0- and B1+-maps does not only optimize the workflow but also improves the ease of use of localized f0 determination, higher order shim value computation and RF power optimization in a user selected 3D ROI. This should enable image quality improvements in cardiac imaging at 3T.
Acknowledgments
The authors would like to thank David Foxall and James Murdoch from Philips Healthcare in Cleveland for helpful discussions about B0- and B1+-mapping and the “spredrex” pulse shape, respectively.
Grant support NIH RO1 HL084186
References
- 1.Strach K, Meyer C, Thomas D, Naehle CP, Schmitz C, Litt H, Bernstein A, Cheng B, Schild H, Sommer T. High-resolution myocardial perfusion imaging at 3 T: comparison to 1.5 T in healthy volunteers. European radiology. 2007;17(7):1829–1835. doi: 10.1007/s00330-006-0560-3. [DOI] [PubMed] [Google Scholar]
- 2.Sommer T, Hackenbroch M, Hofer U, Schmiedel A, Willinek WA, Flacke S, Gieseke J, Traber F, Fimmers R, Litt H, Schild H. Coronary MR angiography at 3.0 T versus that at 1.5 T: initial results in patients suspected of having coronary artery disease. Radiology. 2005;234(3):718–725. doi: 10.1148/radiol.2343031784. [DOI] [PubMed] [Google Scholar]
- 3.Noeske R, Seifert F, Rhein KH, Rinneberg H. Human cardiac imaging at 3 T using phased array coils. Magn Reson Med. 2000;44(6):978–982. doi: 10.1002/1522-2594(200012)44:6<978::aid-mrm22>3.0.co;2-9. [DOI] [PubMed] [Google Scholar]
- 4.Oppelt A, Graumann R, Barfuss H, Fischer H, Hartl W, Shajor A. FISP - a new fast MRI sequence. Electromedica. 1986;54:15–18. [Google Scholar]
- 5.Deshpande VS, Shea SM, Li D. Artifact reduction in true-FISP imaging of the coronary arteries by adjusting imaging frequency. Magn Reson Med. 2003;49(5):803–809. doi: 10.1002/mrm.10442. [DOI] [PubMed] [Google Scholar]
- 6.Schär M, Kozerke S, Fischer SE, Boesiger P. Cardiac SSFP imaging at 3 Tesla. Magn Reson Med. 2004;51(4):799–806. doi: 10.1002/mrm.20024. [DOI] [PubMed] [Google Scholar]
- 7.Singerman RW, Denison TJ, Wen H, Balaban RS. Simulation of B1 field distribution and intrinsic signal-to-noise in cardiac MRI as a function of static magnetic field. J Magn Reson. 1997;125(1):72–83. doi: 10.1006/jmre.1996.1073. [DOI] [PubMed] [Google Scholar]
- 8.Greenman RL, Shirosky JE, Mulkern RV, Rofsky NM. Double inversion black-blood fast spin-echo imaging of the human hearT: a comparison between 1.5T and 3.0T. J Magn Reson Imaging. 2003;17(6):648–655. doi: 10.1002/jmri.10316. [DOI] [PubMed] [Google Scholar]
- 9.Insko EK, Bolinger L. Mapping of the Radiofrequency Field. Journal of Magnetic Resonance Series A. 1993;103(1):82–85. [Google Scholar]
- 10.Stollberger R, Wach P. Imaging of the active B1 field in vivo. Magn Reson Med. 1996;35(2):246–251. doi: 10.1002/mrm.1910350217. [DOI] [PubMed] [Google Scholar]
- 11.Yarnykh VL. Actual flip-angle imaging in the pulsed steady state: a method for rapid three-dimensional mapping of the transmitted radiofrequency field. Magn Reson Med. 2007;57(1):192–200. doi: 10.1002/mrm.21120. [DOI] [PubMed] [Google Scholar]
- 12.Cunningham CH, Pauly JM, Nayak KS. Saturated double-angle method for rapid B1+ mapping. Magn Reson Med. 2006;55(6):1326–1333. doi: 10.1002/mrm.20896. [DOI] [PubMed] [Google Scholar]
- 13.Sung K, Nayak KS. Measurement and characterization of RF nonuniformity over the heart at 3T using body coil transmission. J Magn Reson Imaging. 2008;27(3):643–648. doi: 10.1002/jmri.21253. [DOI] [PubMed] [Google Scholar]
- 14.Sung K, Nayak KS. B1+ compensation in 3T cardiac imaging using short 2DRF pulses. Magn Reson Med. 2008;59(3):441–446. doi: 10.1002/mrm.21443. [DOI] [PubMed] [Google Scholar]
- 15.Pan JW, Twieg DB, Hetherington HP. Quantitative spectroscopic imaging of the human brain. Magn Reson Med. 1998;40(3):363–369. doi: 10.1002/mrm.1910400305. [DOI] [PubMed] [Google Scholar]
- 16.Bottomley PA. Spatial localization in NMR spectroscopy in vivo. Annals of the New York Academy of Sciences. 1987;508:333–348. doi: 10.1111/j.1749-6632.1987.tb32915.x. [DOI] [PubMed] [Google Scholar]
- 17.Schär M, Kozerke S, Boesiger P. Navigator gating and volume tracking for double-triggered cardiac proton spectroscopy at 3 Tesla. Magn Reson Med. 2004;51(6):1091–1095. doi: 10.1002/mrm.20123. [DOI] [PubMed] [Google Scholar]
- 18.Naressi A, Couturier C, Devos JM, Janssen M, Mangeat C, de Beer R, Graveron-Demilly D. Java-based graphical user interface for the MRUI quantitation package. Magma (New York, NY) 2001;12(2-3):141–152. doi: 10.1007/BF02668096. [DOI] [PubMed] [Google Scholar]
- 19.Ibrahim TS, Lee R, Baertlein BA, Kangarlu A, Robitaille PL. Application of finite difference time domain method for the design of birdcage RF head coils using multi-port excitations. Magnetic resonance imaging. 2000;18(6):733–742. doi: 10.1016/s0730-725x(00)00143-0. [DOI] [PubMed] [Google Scholar]
- 20.Vernickel P, Roschmann P, Findeklee C, Ludeke KM, Leussler C, Overweg J, Katscher U, Grässlin I, Schunemann K. Eight-channel transmit/receive body MRI coil at 3T. Magn Reson Med. 2007;58(2):381–389. doi: 10.1002/mrm.21294. [DOI] [PubMed] [Google Scholar]
- 21.Sung K, Nayak KS. Design and use of tailored hard-pulse trains for uniformed saturation of myocardium at 3 Tesla. Magn Reson Med. 2008;60(4):997–1002. doi: 10.1002/mrm.21765. [DOI] [PubMed] [Google Scholar]