

Abstract
Objective
Insulin resistance and obesity are hallmarks of type 2 diabetes and the metabolic syndrome, which confer an increased risk of cardiovascular disease. Recent studies suggest that the protein cargo of high density lipoprotein (HDL) makes important contributions to the lipoprotein’s cardioprotective effects. We used targeted proteomics to determine if obesity and insulin resistance associate with changes in HDL’s protein content in two different groups of men.
Methods and Results
In a discovery study, we used isotope dilution mass spectrometry to quantify the relative concentrations of five proteins previously implicated in HDL’s cardioprotective effects in three groups of healthy subjects: lean insulin-sensitive, lean insulin-resistant, and obese insulin-resistant. We validated our findings in a different group of subjects. Clusterin concentration in HDL strongly and negatively associated with insulin resistance and body mass index in both populations. HDL clusterin levels were lower in subjects with low HDL and high triglycerides, key components of the metabolic syndrome. There was an inverse correlation between clusterin levels in HDL and VLDL/LDL.
Conclusions
Clusterin levels in HDL are lower in men with reduced insulin sensitivity, higher body mass index, and an unfavorable lipid profile. Our observations raise the possibility that clusterin depletion contributes to the loss of HDL’s cardioprotective properties.
Keywords: High density lipoprotein, atherosclerosis, apolipoprotein J, inflammation, intra-abdominal fat
Many environmental and genetic factors contribute to the metabolic syndrome, whose hallmark is reduced insulin sensitivity accompanied by hypertension, hypertriglyceridemia, and obesity.1,2 Obesity and insulin resistance are also components of type 2 diabetes.3,4 These factors in turn contribute to the initiation and progression of atherosclerotic cardiovascular disease (CVD).3,4 Another cardinal feature of the metabolic syndrome is a low level of high density lipoprotein (HDL), which strongly associates with an increased risk of atherosclerotic vascular disease.
One important cardioprotective function of HDL is to remove cholesterol from cholesteryl ester-laden macrophages in the artery wall.5–7 The anti-inflammatory properties of HDL may also contribute to its anti-atherogenic effects.8,9 It has been proposed that HDL’s cardioprotective ability depends on the types of particles generated metabolically and that HDL in humans with established CVD is dysfunctional.8–12 Indeed, animal studies convincingly demonstrate that changes in HDL’s protein composition can promote atherosclerosis, even when plasma levels of HDL cholesterol (HDL-C) are normal or even elevated.13–15
To explore the potential clinical relevance of protein composition in HDL’s cardioprotective effects, we used targeted proteomics to determine the relationship between the relative concentration of five different proteins in HDL and two key features of the metabolic syndrome: obesity and insulin resistance. We quantified proteins that have been previously implicated in HDL’s cardioprotective effects: apolipoprotein (apo) A-I,6,7 clusterin,5,16–20 apoE,21 apoM,22,23 and complement component C3.20,24–26 Our observations indicate strong positive correlations between clusterin levels in HDL and insulin sensitivity and strong negative correlations with increased obesity and dyslipoproteinemia. In contrast, levels of the other proteins were not associated with these features of the metabolic syndrome. These results raise the possibility that clusterin depletion indicates the presence of dysfunctional HDL.
Methods
Study populations
All studies were approved by the Institutional Review Boards of the University of Washington and the University of Oklahoma, and subjects gave written informed consent. The discovery study (University of Washington) involved 30 healthy non-smoking men with no history of atherosclerosis (Table 1). Subjects were distributed into three groups: lean insulin-sensitive, lean insulin-resistant, and obese insulin-resistant (N=10 per group).27 Body habitus was based on body mass index (BMI; lean subject, BMI< 27.5 kg/m2).28 Insulin sensitivity was quantified by the sensitivity index (SI), using the frequently sampled tolbutamide-modified intravenous-glucose tolerance test (insulin-sensitive subject, SI ≥4.2 × 10⁻⁴ mi−1 per μU/mL).27 Intra-abdominal and subcutaneous fat areas were determined by computed tomography.29 The validation study (University of Oklahoma) involved 23 healthy men age-matched to 16 men with type 2 diabetes mellitus (Table 3) and 6 (15%) of the subjects were smokers at the time of the study. Homeostasis model assessment of insulin resistance (HOMA-IR) was calculated as previously described (fasting glucose (mmol/L) × fasting insulin (μU/mL) ÷ 22.5).30 Additional details on the two populations of subjects, including how subjects were diagnosed with metabolic syndrome, are provided in Supplemental Methods.
Table 1.
Characteristics of the discovery population.
| Lean insulin- sensitive (N=10) | Lean insulin- resistant (N=10) | Obese insulin- resistant (N=10) | p value | |
|---|---|---|---|---|
| Age (years)* | 44.6 (6.7) | 46.6 (5.9) | 46.9 (5.0) | 0.61 |
| BMI (kg/m2)† | 23.8 (3.8) | 25.4 (1.3) | 30.5 (2.4) | <0.001 |
| SI (×1−4 min−1 per μU/mL)† | 6.3 (3.6) | 2.8 (1.5) | 2.1 (1.0) | <0.001 |
| HOMA-IR (mmol/L × μU/mL)† | 1.50 (1.06) | 1.89 (0.51) | 3.17 (1.58) | 0.012 |
| Waist-to-hip ratio* | 0.83 (0.06) | 0.89 (0.02) | 0.96 (0.06) | <0.001 |
| Intra-abdominal fat area (cm2)† | 56.1 (66.5) | 92.9 (30.1) | 200.9 (55.2) | <0.001 |
| Subcutaneous fat area (cm2)† | 67.0 (71.3) | 152.3 (78.3) | 257.3 (137.2) | <0.001 |
| Total cholesterol (mmol/L)* | 4.32 (1.00) | 5.14 (0.77) | 4.93 (1.31) | 0.26 |
| HDL cholesterol (mmol/L)* | 1.16 (0.18) | 1.03 (0.17) | 0.98 (0.16) | 0.076 |
| Triglycerides (mmol/L)† | 0.77 (0.29) | 1.30 (1.15) | 1.16 (0.91) | 0.009 |
| LDL cholesterol (mmol/L)* | 2.75 (0.78) | 3.41 (0.70) | 3.13 (0.96) | 0.25 |
| Mean arterial blood pressure (mmHg) | 86.9 (6.4) | 87.4 (8.0) | 93.9 (6.4) | 0.067 |
| HDL clusterin (arbitrary units)*‡ | 1.18 (0.20) | 0.97 (0.22) | 0.85 (0.27) | 0.014 |
Mean group values (SD). Significance assessed by ANOVA.
Median group values (25th–75th interquartile range). Significance assessed by the Kruskal-Wallis test.
N= 9, 9, and 10 for lean insulin sensitive, lean insulin resistant, and obese insulin resistant groups. To quantify the relative amount of each protein in HDL, we normalized the relative content of each of the five proteins (as monitored by two different isotope-labeled peptides for each protein) to a value of 1 for the entire study population. Thus, a sample in which clusterin has a value >1 is enriched in that protein relative to the population average, while values <1 represent depletion.
Table 3.
Characteristics of the validation population.
| Normal | Diabetic | p value | |
|---|---|---|---|
| Age† | 45.8 (13.0) | 49.8 (9.2) | 0.28 |
| BMI‡ | 26.4 (8.0) | 32.1 (9.3) | 0.004 |
| HOMA-IR‡ | 1.02 (1.38) | 2.77 (4.40) | 0.037 |
| Hemoglobin A1c† | 5.2 (0.3) | 7.5 (1.5) | 0.008 |
| Total cholesterol† | 4.65 (0.96) | 5.12 (0.71) | 0.09 |
| HDL cholesterol† | 1.06 (0.26) | 0.97 (0.21) | 0.28 |
| Triglycerides‡ | 0.99 (0.65) | 1.25 (1.50) | 0.23 |
| LDL cholesterol† | 3.03 (0.94) | 3.40 (0.64) | 0.16 |
| Mean arterial blood pressure† | 92.5 (21.9) | 89.5 (26.3) | 0.70 |
Mean group values (SD). Significance assessed by Student’s t-test.
Median group values (25th–75th interquartile range). Significance assessed by the Wilcoxon rank sum test.
Lipoprotein isolation
HDL(d=1.063–1.210 g/mL) and VLDL/LDL particles (d<1.063 g/mL) were isolated by sequential density gradient ultracentrifugation from EDTA-anticoagulated plasma collected after an overnight fast.20 Plasma was brought to a density of 1.21 g/mL with solid KBr, loaded into an ultracentrifuge tube, and gently overlaid with normal saline adjusted with KBr to a density of 1.21 g/mL. After ultracentrifugation at 146,000 × g for 41 h, lipoproteins in the top one-fourth of the tube were collected, the density of the solution was adjusted to 1.063 g/mL, and the samples were centrifuged at 146,000 × g for 16 h. HDL from the bottom two-thirds and VLDL/LDL from the top one-third of each tube was iteratively concentrated and diluted 7 times with 20 mM potassium phosphate, 0.1 mM diethylenetriamine pentaacetic acid, pH 7, using a 50 kDa centrifuge filter (Millipore). Protein concentrations were determined by the Bradford assay (Pierce). Lipoproteins were stored at −80°C until analysis.
Liquid chromatography-tandem mass spectrometric quantification of proteins in lipoproteins
Complete details are provided in Supplemental Methods. Briefly, tryptic digests of reduced, alkylated HDL or VLDL/LDL (10 μg protein) were supplemented with isotope-labeled internal standard peptides for 5 proteins (Supplemental Table I). This approach controls for sample-specific suppression of ionization and variability in mass spectrometer performance.31 Peptides were desalted on a C18 trapping column and subsequently eluted and separated with a C18 analytical column using a linear gradient of acetonitrile. Peptides were detected by selected reaction monitoring on a triple quadrupole tandem mass spectrometer. Peptides were quantified by isotope dilution, using the ratio of endogenous peptide ion current to the corresponding internal standard peptide ion current. Relative concentrations for each protein were normalized across each population (discovery or validation) such that a relative protein concentration >1 indicates that the protein is enriched compared with the average of the population and <1 indicates that the protein is depleted. The method was validated by comparing liquid chromatography-tandem mass spectrometric quantification of apoA-I with a nephelometric assay (Supplemental Fig. I). Absolute concentrations of clusterin in HDL were not calculated because a suitable matrix-matched calibrator was not available.
Statistical analyses
BMI, triglycerides, intra-abdominal fat, subcutaneous fat, and insulin sensitivity (SI and HOMA-IR) were modeled using loge-transformed data, based on the log-normal distribution of the larger population (N=186 to 275 observations for each variable) from which the subjects of the discovery population were drawn.27 Two HDL samples in the discovery study with very low apoA-I levels were excluded from the analysis. Means of groups were compared using one-way ANOVA or Student’s t-test. For log-normal data, medians were compared using Kruskal-Wallis or Wilcoxon rank sum tests. All tests of significance were two-sided.
Results
We used a two-tiered strategy to determine whether the relative concentration of five important proteins in HDL associated with features of the metabolic syndrome and other risk factors for CVD. First, in the discovery study, we used isotope dilution mass spectrometry with selected reaction monitoring to measure the concentrations of the five proteins in HDL isolated from healthy subjects enrolled in a metabolic study (N=30). We validated our observations in a different group of subjects recruited from an outpatient medical clinic (N=39).
Characteristics of the discovery group subjects
For the discovery study we isolated HDL from three groups of age-matched, healthy men: lean insulin-sensitive; lean insulin-resistant; and obese insulin-resistant (N=10 per group; Table 1).27–29 None of the subjects was using lipid-lowering therapy16 or had diabetes. Insulin sensitivity was determined from the intravenous glucose tolerance test that was used to categorize the subjects in the original metabolic study. As expected, other measures of insulin sensitivity (HOMA-IR) and obesity (waist-to-hip ratio, intra-abdominal fat, and subcutaneous fat) were statistically different among the three groups. Plasma HDL cholesterol levels were slightly but not significantly lower and plasma triglycerides were higher in the insulin-resistant groups. Mean arterial pressure was not different between the groups.
Clusterin levels in HDL correlate with features of the metabolic syndrome
HDL was proteolytically digested, and the resulting peptides were analyzed by tandem mass spectrometry. The relative amounts of five HDL proteins (per total HDL protein) were quantified by isotope dilution, using two synthetic internal standard peptides. By ANOVA, the amount of clusterin in HDL differed significantly among the three groups of subjects (p=0.014; Table 1). However, the amount of the other four proteins measured, apoA-I, apoE, apoM, and complement component C3, were not statistically different between the three groups (Supplemental Table II).
We next determined if the abundance of clusterin in HDL associated with obesity in the discovery population (Table 2). Univariate linear regression revealed that clusterin correlated negatively with BMI (r=−0.50, p=0.007) as well as with intra-abdominal and subcutaneous fat content as assessed by computed tomography (r=−0.58 and −0.48; p=0.001 and p=0.010, respectively). The correlation was higher for intra-abdominal fat area, suggesting that this specific depot might influence clusterin levels in HDL.
Table 2.
Correlation of subject characteristics with HDL clusterin levels in the discovery population.
| Correlation with HDL clusterin by LC-MS/MS | |
|---|---|
| Age | −0.31 |
| BMI* | −0.50† |
| SI* | 0.52† |
| HOMA-IR* | −0.54† |
| Waist-to-hip ratio | −0.56† |
| Intra-abdominal fat area* | −0.58† |
| Subcutaneous fat area* | −0.51† |
For BMI, SI, HOMA-IR, intra-abdominal fat, and subcutaneous fat, loge-transformed data were used.
p<0.01
HDL clusterin also correlated with insulin sensitivity, as assessed by both the SI and HOMA-IR. It is important to note that the direction of change (and units) associated with insulin sensitivity as assessed by the SI and HOMA-IR are different; thus, increased insulin sensitivity increases the SI but decreases HOMA-IR. For both measures of insulin sensitivity, the correlation with HDL clusterin was significant (r=0.52, p=0.004 for SI and r=−0.54, p=0.003 for HOMA-IR; Table 2).
Importantly, none of the other four quantified proteins, including apoA-I, correlated with obesity or insulin resistance (Supplemental Table III).
Characteristics of the validation group subjects
To validate the correlations between HDL clusterin concentration and BMI and insulin sensitivity, we analyzed a second population of apparently healthy control (N=23) and type 2 diabetic men (N=16) who lived in a different city. We selected these subjects because the samples were collected and stored at a different institution, thus eliminating the possibility that factors related to sample collection at the first site could explain our observations. All diabetic subjects were receiving oral hypoglycemic agents and/or insulin therapy (one subject was on insulin therapy). Importantly, none of the subjects was on lipid-lowering therapy.16 The BMI of the validation group was significantly greater than that of the discovery group (median 30.4 and 26.9, respectively; p=0.015). Within the validation population, the diabetic subjects were more obese, were less insulin sensitive, and had higher hemoglobin A1c levels than normal subjects (Table 3).
HDL clusterin level correlates negatively with BMI and insulin resistance in control and type 2 diabetic subjects
HDL clusterin content was quantified in the validation population by isotope dilution mass spectrometry. Again, clusterin levels in HDL correlated negatively with BMI and reduced insulin sensitivity (Fig. 1A,B), and the correlations remained significant after smokers were removed from the analysis (15% of the validation population). In contrast, HDL clusterin did not correlate with mean arterial blood pressure (Fig. 1C), another risk factor for CVD and an important component of the metabolic syndrome. The correlations of clusterin with BMI and HOMA-IR were similar in the validation and discovery populations (r=−0.55 vs. −0.50 for loge transformed BMI and r=−0.61 vs. −0.54 for loge transformed HOMA-IR, respectively), and both were significant (p<0.001). Importantly, the slopes of the linear regression analysis of HDL clusterin and HOMA-IR were also very similar despite the significantly different median BMIs of the validation and discovery populations (standardized coefficient=−0.63 and −0.54, respectively), suggesting that the relationship is valid over a wide range of body sizes (Fig. 1A,B).
Figure 1. Relationships between relative HDL clusterin concentration and clinical characteristics.

Relative HDL clusterin concentration (per g total HDL protein) is plotted against loge-transformed BMI (A), loge-transformed HOMA-IR (B), and mean arterial blood pressure (C). Results represent the discovery population (open circles) and validation population (closed circles). Lines represent linear regression analysis of the relationship between HDL clusterin and clinical parameters for the discovery (dashed lines), validation (dotted lines), and combined populations (solid lines). Pearson correlation coefficients (r) and associated p values are presented for the combined population.
To further investigate the relationships among BMI, insulin resistance, and the relative concentration of clusterin in HDL, we combined the discovery and validation populations (Fig. 1). The correlations and slopes between HDL clusterin and BMI (r=−0.51) or HOMA-IR (r=−0.57) were similar to those for the discovery and validation populations. These observations indicate that in two distinct groups of male subjects, clusterin levels in HDL correlate negatively with insulin resistance and BMI.
HDL clusterin is depleted in subjects with the metabolic syndrome
By immunoassay, plasma concentrations of clusterin are elevated in subjects with diabetes.32,33 Using isotope dilution mass spectrometry, we also found an increased plasma concentration of clusterin in diabetic subjects, which was statistically significant even after removing 3 outlying data points (Supplemental Fig. II). However, when quantifying the clusterin in HDL, we observed no significant differences between diabetic and control subjects, though there was trend toward a lower level in diabetic subjects (Fig. 2A; p=0.14).
Figure 2. Relative concentration of HDL clusterin in control subjects, and subjects with diabetes, the metabolic syndrome, or dyslipoproteinemia.

Diabetic subjects were compared with age-matched normal subjects in the validation population (A). Subjects with metabolic syndrome were compared with normal subjects in the discovery population (B) as described in Supplemental Methods. Also shown are subjects categorized by plasma HDL-C (C; normal ≥40 mg/dL), plasma triglycerides (D; normal <150 mg/dL), and plasma LDL cholesterol (E; normal <130 mg/dL). Results and error bars are mean and SEM, respectively. The number of subjects in each group is indicated.
Because our observations suggested that HDL clusterin levels associate with insulin resistance and obesity, we next determined if subjects with the metabolic syndrome had lower HDL clusterin levels. Indeed, we found that subjects with the metabolic syndrome had significantly lower HDL clusterin levels than the control subjects (p=0.004; Fig. 2B).
HDL clusterin is depleted in subjects with dyslipoproteinemia
Because high triglycerides and low HDL-C are characteristic features of the metabolic syndrome, we investigated the relationships between dyslipoproteinemia and the concentration of clusterin in HDL. When the data from the discovery and validation populations were combined (Fig. 2), levels of HDL clusterin were significantly lower in subjects with high plasma levels of triglycerides (>150 mg/dL; p<0.0001), low levels of HDL-C (<40 mg/dL; p<0.0001), or elevated levels of LDL cholesterol (>130 mg/dL; p=0.024).
We used linear regression analysis to examine the overall relationships between HDL clusterin and triglycerides or HDL-C in our combined study population. HDL clusterin concentration strongly correlated with plasma HDL-C (r=0.64; p<0.0001; Fig. 3A), and negatively correlated with loge-transformed triglycerides (r=−0.59, p<0.0001; Fig. 3B), LDL-C (r=−0.30; p=0.015; Fig. 3C), and total cholesterol (r=−0.37; p=0.002; not shown). These observations suggest that plasma lipid composition is one important factor that affects the concentration of clusterin in HDL. Importantly, HDL triglyceride concentration (per g HDL protein) had no relationship with HDL clusterin levels (Supplemental Fig. III).
Figure 3. Correlations of lipid parameters with relative HDL clusterin concentration.
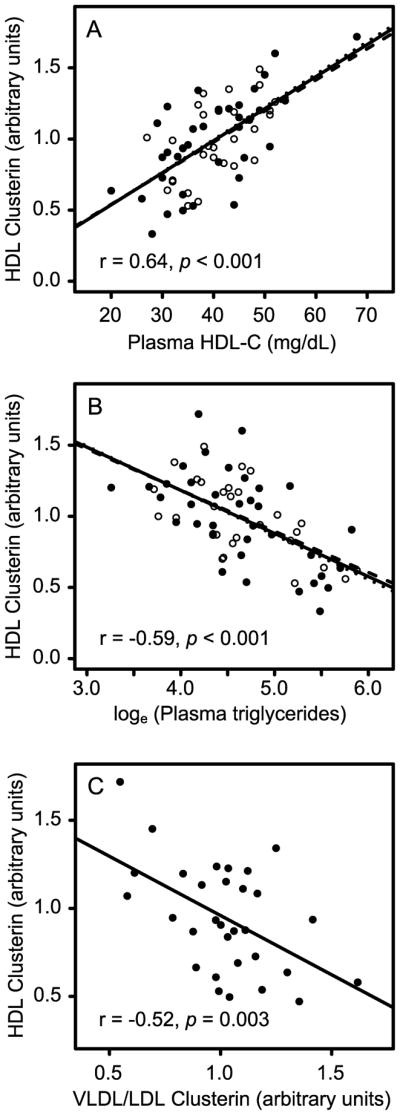
Linear regression analysis is shown for HDL clusterin and plasma HDL-C (A), plasma triglycerides (B), and clusterin concentration in VLDL/LDL particles (C). Data are presented as in Fig. 1, except that the regression line presented in C is for the validation population only.
HDL clusterin is negatively associated with VLDL/LDL clusterin levels
Although plasma concentrations of clusterin are elevated in subjects with insulin resistance and diabetes,32,33 the relative distribution of clusterin between HDL and the apoB-containing lipoproteins has not been investigated. We therefore isolated total VLDL/LDL from plasma of the validation subjects and quantified clusterin by isotope dilution mass spectrometry. In contrast to HDL, clusterin in the non-HDL lipoprotein fraction was directly proportional to BMI (r = 0.61, p=0.0005; not shown) and HOMA-IR (r = 0.46, p=0.009; not shown). In addition, there was a strong inverse relationship between clusterin in HDL and clusterin in LDL/VLDL (r = −0.66, p<0.0001; Fig. 3D).
Discussion
Insulin resistance, obesity, and dyslipidemia are hallmarks of the metabolic syndrome and type 2 diabetes, which increase the risk of death from CVD.1–4 We demonstrated a strong negative correlation between the concentration of clusterin in HDL and both insulin sensitivity and BMI in two different populations of male subjects. HDL clusterin was unrelated to elevated blood pressure, another component of the metabolic syndrome, but there was a significant decrease in HDL clusterin levels in subjects with metabolic syndrome. None of the other four HDL proteins that we investigated correlated with obesity or reduced insulin sensitivity. Collectively, our observations indicate that insulin resistance and the metabolic syndrome are associated with low clusterin levels in HDL.
Circulating clusterin is generally believed to be predominantly associated with HDL and has been shown to be enriched in the dense HDL3 subfraction.34 Based on peptide peak areas in this study, ~22% of clusterin is present on HDL and ~9% is present on LDL/VLDL. Previous studies have found that clusterin levels increase in the serum of patients with diabetes or CVD,32,33 leading to the suggestion that levels of clusterin in HDL increase in subjects with an increased risk of vascular disease. However, none of these studies reported the concentration of clusterin in apoB-containing lipoproteins. In contrast, mass spectrometry-based studies suggest that the concentrations of clusterin in HDL3 are apparently decreased in subjects with established CVD.20 Moreover, clusterin levels in HDL3 increase when newly diagnosed CVD subjects are treated with statin and niacin therapy,16 raising the possibility that there is interplay between the levels of clusterin in HDL, VLDL, and LDL.
To explore the factors that affect the levels of clusterin in HDL in metabolic syndrome and other disorders, we determined the relationship between levels of clusterin in HDL and triglycerides, total cholesterol, LDL-C, and HDL-C. Clusterin in HDL correlated negatively with total cholesterol, LDL-C, and triglycerides, but was positively associated with HDL-C.
Our observations suggest a model in which alterations in lipid metabolism that are secondary to insulin resistance and the metabolic syndrome diminish HDL clusterin levels. Thus, we observed an inverse association between clusterin in HDL and clusterin in non-HDL lipoproteins (VLDL and LDL). This finding, combined with the direct correlation between clusterin in apoB-containing lipoproteins and insulin resistance, raises the possibility that insulin resistance might shift proteins from HDL to VLDL and LDL. It is well-established that certain lipoprotein-associated proteins can move from one particle type to another, which is related in part to the lipid composition of HDL and the apoB-containing lipoproteins.35 Insulin resistance, obesity, and diabetes alter the lipid content and composition of lipoproteins,36,37 raising the possibility that such alterations modulate the distribution of clusterin between different classes of lipoprotein particles. However, there was no association between HDL clusterin levels and HDL triglyceride levels (Supplemental Fig. III), indicating that another class of lipids or that particular triglycerides with specific fatty acyl side chains might be involved.
Decreased levels of clusterin might contribute to the loss of HDL’s cardioprotective properties in subjects with insulin resistance and metabolic syndrome. For example, synthetic peptides based on clusterin are potently atheroprotective in animal models.17 Clusterin is also an inhibitor of complement activation, which is implicated in atherogenesis.38–41 Recent studies indicate that complement activation plays a key role in promoting tissue injury in a rodent model of myocardial infarction,42 raising the possibility that clusterin in HDL modulates tissue damage. Indeed, mice deficient in clusterin exhibit increased tissue damage in a model of cerebral ischemia43 and clusterin prevents an age-related progressive glomerulopathy in mice.44
Major strengths of our study include the use of isotope dilution mass spectrometry (an intrinsically precise, quantitative, and multiplex approach that is transferable across laboratories31) to investigate two diverse clinical populations that included both healthy subjects and type 2 diabetic subjects. Important limitations include the relatively small number of subjects, the cross-sectional design, and the focus on male subjects. In future studies, it will be important to extend our observations to larger groups of subjects, to women, and to younger and older subjects at increased risk of CVD.
In summary, we showed that clusterin levels in HDL correlate negatively with obesity and insulin resistance and that they are lower in subjects with the metabolic syndrome. Because clusterin is protective in mouse models of tissue injury, and because obesity and insulin resistance are important risk factors for CVD, our results raise the possibility that insufficient clusterin in HDL might impair the lipoprotein’s cardioprotective functions.
Supplementary Material
Acknowledgments
We thank Dr. Alan Chait for helpful comments on the manuscript.
Funding Sources
This research was supported by the National Institutes of Health (DK002456, HL030086, HL086798), the Clinical Nutrition Research Unit (University of Washington, DK035816), the Diabetes and Endocrinology Research Center (University of Washington, DK017047), the Clinical Mass Spectrometry Facility (University of Washington), the Proteome Resource (University of Washington), the General Clinical Research Center (University of Oklahoma Health Sciences Center), and the United States Department of Veterans Affairs.
Footnotes
Disclosures
Andrew Hoofnagle has been a consultant for Thermo Fisher. Jay Heinecke is on the Merck/Schering Plough speaker bureau and serves as a consultant for Merck, Corcept, and Insilicos.
References
- 1.Eckel RH, Grundy SM, Zimmet PZ. The metabolic syndrome. Lancet. 2005;365:1415–1428. doi: 10.1016/S0140-6736(05)66378-7. [DOI] [PubMed] [Google Scholar]
- 2.Grundy SM, Cleeman JI, Daniels SR, Donato KA, Eckel RH, Franklin BA, Gordon DJ, Krauss RM, Savage PJ, Smith SC, Jr, Spertus JA, Costa F. Diagnosis and management of the metabolic syndrome: an American Heart Association/National Heart, Lung, and Blood Institute Scientific Statement. Circulation. 2005;112:2735–2752. doi: 10.1161/CIRCULATIONAHA.105.169404. [DOI] [PubMed] [Google Scholar]
- 3.Alexander CM, Landsman PB, Teutsch SM, Haffner SM. NCEP-defined metabolic syndrome, diabetes, and prevalence of coronary heart disease among NHANES III participants age 50 years and older. Diabetes. 2003;52:1210–1214. doi: 10.2337/diabetes.52.5.1210. [DOI] [PubMed] [Google Scholar]
- 4.Razani B, Chakravarthy MV, Semenkovich CF. Insulin resistance and atherosclerosis. Endocrinol Metab Clin North Am. 2008;37:603–621. doi: 10.1016/j.ecl.2008.05.001. [DOI] [PMC free article] [PubMed] [Google Scholar]
- 5.Gelissen IC, Hochgrebe T, Wilson MR, Easterbrook-Smith SB, Jessup W, Dean RT, Brown AJ. Apolipoprotein J (clusterin) induces cholesterol export from macrophage-foam cells: a potential anti-atherogenic function? Biochem J. 1998;331:231–237. doi: 10.1042/bj3310231. [DOI] [PMC free article] [PubMed] [Google Scholar]
- 6.Oram JF, Heinecke JW. ATP-binding cassette transporter A1: a cell cholesterol exporter that protects against cardiovascular disease. Physiol Rev. 2005;85:1343–1372. doi: 10.1152/physrev.00005.2005. [DOI] [PubMed] [Google Scholar]
- 7.Rader DJ. Molecular regulation of HDL metabolism and function: implications for novel therapies. Journal of Clinical Investigation. 2006;116:3090–3100. doi: 10.1172/JCI30163. [DOI] [PMC free article] [PubMed] [Google Scholar]
- 8.Barter PJ, Nicholls S, Rye KA, Anantharamaiah GM, Navab M, Fogelman AM. Antiinflammatory properties of HDL. Circ Res. 2004;95:764–772. doi: 10.1161/01.RES.0000146094.59640.13. [DOI] [PubMed] [Google Scholar]
- 9.Hoofnagle AN, Heinecke JW. Lipoproteomics: using mass spectrometry-based proteomics to explore the assembly, structure, and function of lipoproteins. J Lipid Res. 2009;50:1967–1975. doi: 10.1194/jlr.R900015-JLR200. [DOI] [PMC free article] [PubMed] [Google Scholar]
- 10.Brousseau ME, Millar JS, Diffenderfer MR, Nartsupha C, Asztalos BF, Wolfe ML, Mancuso JP, Digenio AG, Rader DJ, Schaefer EJ. Effects of cholesteryl ester transfer protein inhibition on apolipoprotein A-II-containing HDL subspecies and apolipoprotein A-II metabolism. J Lipid Res. 2009;50:1456–1462. doi: 10.1194/jlr.P800037-JLR200. [DOI] [PMC free article] [PubMed] [Google Scholar]
- 11.Davidsson P, Hulthe J, Fagerberg B, Camejo G. Proteomics of apolipoproteins and associated proteins from plasma high-density lipoproteins. Arterioscler Thromb Vasc Biol. 2010;30:156–163. doi: 10.1161/ATVBAHA.108.179317. [DOI] [PubMed] [Google Scholar]
- 12.Navab M, Hama SY, Hough GP, Subbanagounder G, Reddy ST, Fogelman AM. A cell-free assay for detecting HDL that is dysfunctional in preventing the formation of or inactivating oxidized phospholipids. J Lipid Res. 2001;42:1308–1317. [PubMed] [Google Scholar]
- 13.Covey SD, Krieger M, Wang W, Penman M, Trigatti BL. Scavenger receptor class B type I-mediated protection against atherosclerosis in LDL receptor-negative mice involves its expression in bone marrow-derived cells. Arterioscler Thromb Vasc Biol. 2003;23:1589–1594. doi: 10.1161/01.ATV.0000083343.19940.A0. [DOI] [PubMed] [Google Scholar]
- 14.Macdonald ML, van Eck M, Hildebrand RB, Wong BW, Bissada N, Ruddle P, Kontush A, Hussein H, Pouladi MA, Chapman MJ, Fievet C, van Berkel TJ, Staels B, McManus BM, Hayden MR. Despite Antiatherogenic Metabolic Characteristics, SCD1-Deficient Mice Have Increased Inflammation and Atherosclerosis. Arterioscler Thromb Vasc Biol. 2008 doi: 10.1161/ATVBAHA.108.181099. [DOI] [PMC free article] [PubMed] [Google Scholar]
- 15.Moore RE, Kawashiri MA, Kitajima K, Secreto A, Millar JS, Pratico D, Rader DJ. Apolipoprotein A-I deficiency results in markedly increased atherosclerosis in mice lacking the LDL receptor. Arterioscler Thromb Vasc Biol. 2003;23:1914–1920. doi: 10.1161/01.ATV.0000092328.66882.F5. [DOI] [PubMed] [Google Scholar]
- 16.Green PS, Vaisar T, Pennathur S, Kulstad JJ, Moore AB, Marcovina S, Brunzell J, Knopp RH, Zhao XQ, Heinecke JW. Combined statin and niacin therapy remodels the high-density lipoprotein proteome. Circulation. 2008;118:1259–1267. doi: 10.1161/CIRCULATIONAHA.108.770669. [DOI] [PMC free article] [PubMed] [Google Scholar]
- 17.Navab M, Anantharamaiah GM, Reddy ST, Van Lenten BJ, Wagner AC, Hama S, Hough G, Bachini E, Garber DW, Mishra VK, Palgunachari MN, Fogelman AM. An oral apoJ peptide renders HDL antiinflammatory in mice and monkeys and dramatically reduces atherosclerosis in apolipoprotein E-null mice. Arterioscler Thromb Vasc Biol. 2005;25:1932–1937. doi: 10.1161/01.ATV.0000174589.70190.e2. [DOI] [PubMed] [Google Scholar]
- 18.Schwarz M, Spath L, Lux CA, Paprotka K, Torzewski M, Dersch K, Koch-Brandt C, Husmann M, Bhakdi S. Potential protective role of apoprotein J (clusterin) in atherogenesis: binding to enzymatically modified low-density lipoprotein reduces fatty acid-mediated cytotoxicity. Thromb Haemost. 2008;100:110–118. doi: 10.1160/TH07-12-0737. [DOI] [PubMed] [Google Scholar]
- 19.Tschopp J, French LE. Clusterin: modulation of complement function. Clin Exp Immunol. 1994;97 (Suppl 2):11–14. doi: 10.1111/j.1365-2249.1994.tb06256.x. [DOI] [PMC free article] [PubMed] [Google Scholar]
- 20.Vaisar T, Pennathur S, Green PS, Gharib SA, Hoofnagle AN, Cheung MC, Byun J, Vuletic S, Kassim S, Singh P, Chea H, Knopp RH, Brunzell J, Geary R, Chait A, Zhao XQ, Elkon K, Marcovina S, Ridker P, Oram JF, Heinecke JW. Shotgun proteomics implicates protease inhibition and complement activation in the antiinflammatory properties of HDL. J Clin Invest. 2007;117:746–756. doi: 10.1172/JCI26206. [DOI] [PMC free article] [PubMed] [Google Scholar]
- 21.Linton MF, Atkinson JB, Fazio S. Prevention of atherosclerosis in apolipoprotein E-deficient mice by bone marrow transplantation. Science. 1995;267:1034–1037. doi: 10.1126/science.7863332. [DOI] [PubMed] [Google Scholar]
- 22.Nielsen LB, Christoffersen C, Ahnstrom J, Dahlback B. ApoM: gene regulation and effects on HDL metabolism. Trends Endocrinol Metab. 2009;20:66–71. doi: 10.1016/j.tem.2008.11.003. [DOI] [PubMed] [Google Scholar]
- 23.Wolfrum C, Poy MN, Stoffel M. Apolipoprotein M is required for prebeta-HDL formation and cholesterol efflux to HDL and protects against atherosclerosis. Nat Med. 2005;11:418–422. doi: 10.1038/nm1211. [DOI] [PubMed] [Google Scholar]
- 24.Banz Y, Hess OM, Robson SC, Csizmadia E, Mettler D, Meier P, Haeberli A, Shaw S, Smith RA, Rieben R. Attenuation of myocardial reperfusion injury in pigs by Mirococept, a membrane-targeted complement inhibitor derived from human CR1. Cardiovasc Res. 2007;76:482–493. doi: 10.1016/j.cardiores.2007.07.016. [DOI] [PubMed] [Google Scholar]
- 25.Buono C, Come CE, Witztum JL, Maguire GF, Connelly PW, Carroll M, Lichtman AH. Influence of C3 deficiency on atherosclerosis. Circulation. 2002;105:3025–3031. doi: 10.1161/01.cir.0000019584.04929.83. [DOI] [PubMed] [Google Scholar]
- 26.Pepys MB, Hirschfield GM, Tennent GA, Gallimore JR, Kahan MC, Bellotti V, Hawkins PN, Myers RM, Smith MD, Polara A, Cobb AJ, Ley SV, Aquilina JA, Robinson CV, Sharif I, Gray GA, Sabin CA, Jenvey MC, Kolstoe SE, Thompson D, Wood SP. Targeting C-reactive protein for the treatment of cardiovascular disease. Nature. 2006;440:1217–1221. doi: 10.1038/nature04672. [DOI] [PubMed] [Google Scholar]
- 27.Knopp RH, Retzlaff B, Fish B, Walden C, Wallick S, Anderson M, Aikawa K, Kahn SE. Effects of insulin resistance and obesity on lipoproteins and sensitivity to egg feeding. Arterioscler Thromb Vasc Biol. 2003;23:1437–1443. doi: 10.1161/01.ATV.0000082461.77557.C7. [DOI] [PubMed] [Google Scholar]
- 28.Cnop M, Landchild MJ, Vidal J, Havel PJ, Knowles NG, Carr DR, Wang F, Hull RL, Boyko EJ, Retzlaff BM, Walden CE, Knopp RH, Kahn SE. The concurrent accumulation of intra-abdominal and subcutaneous fat explains the association between insulin resistance and plasma leptin concentrations : distinct metabolic effects of two fat compartments. Diabetes. 2002;51:1005–1015. doi: 10.2337/diabetes.51.4.1005. [DOI] [PubMed] [Google Scholar]
- 29.Nieves DJ, Cnop M, Retzlaff B, Walden CE, Brunzell JD, Knopp RH, Kahn SE. The atherogenic lipoprotein profile associated with obesity and insulin resistance is largely attributable to intra-abdominal fat. Diabetes. 2003;52:172–179. doi: 10.2337/diabetes.52.1.172. [DOI] [PubMed] [Google Scholar]
- 30.Matthews DR, Hosker JP, Rudenski AS, Naylor BA, Treacher DF, Turner RC. Homeostasis model assessment: insulin resistance and beta-cell function from fasting plasma glucose and insulin concentrations in man. Diabetologia. 1985;28:412–419. doi: 10.1007/BF00280883. [DOI] [PubMed] [Google Scholar]
- 31.Hoofnagle AN, Wener MH. The fundamental flaws of immunoassays and potential solutions using tandem mass spectrometry. J Immunol Methods. 2009;347:3–11. doi: 10.1016/j.jim.2009.06.003. [DOI] [PMC free article] [PubMed] [Google Scholar]
- 32.Kujiraoka T, Hattori H, Miwa Y, Ishihara M, Ueno T, Ishii J, Tsuji M, Iwasaki T, Sasaguri Y, Fujioka T, Saito S, Tsushima M, Maruyama T, Miller IP, Miller NE, Egashira T. Serum apolipoprotein j in health, coronary heart disease and type 2 diabetes mellitus. J Atheroscler Thromb. 2006;13:314–322. doi: 10.5551/jat.13.314. [DOI] [PubMed] [Google Scholar]
- 33.Trougakos IP, Poulakou M, Stathatos M, Chalikia A, Melidonis A, Gonos ES. Serum levels of the senescence biomarker clusterin/apolipoprotein J increase significantly in diabetes type II and during development of coronary heart disease or at myocardial infarction. Exp Gerontol. 2002;37:1175–1187. doi: 10.1016/s0531-5565(02)00139-0. [DOI] [PubMed] [Google Scholar]
- 34.Davidson WS, Silva RA, Chantepie S, Lagor WR, Chapman MJ, Kontush A. Proteomic analysis of defined HDL subpopulations reveals particle-specific protein clusters: relevance to antioxidative function. Arterioscler Thromb Vasc Biol. 2009;29:870–876. doi: 10.1161/ATVBAHA.109.186031. [DOI] [PMC free article] [PubMed] [Google Scholar]
- 35.Hannuksela ML, Brousseau ME, Meyn SM, Nazih H, Bader G, Shamburek RD, Alaupovic P, Brewer HB., Jr In vivo metabolism of apolipoprotein E within the HDL subpopulations LpE, LpE:A-I, LpE:A-II and LpE:A-I:A-II. Atherosclerosis. 2002;165:205–220. doi: 10.1016/s0021-9150(02)00200-9. [DOI] [PubMed] [Google Scholar]
- 36.Hoofnagle AN, Vaisar T, Mitra P, Chait A. HDL lipids and insulin resistance. Curr Diab Rep. 2010;10:78–86. doi: 10.1007/s11892-009-0085-7. [DOI] [PubMed] [Google Scholar]
- 37.Kontush A, Chapman MJ. Lipidomics as a tool for the study of lipoprotein metabolism. Curr Atheroscler Rep. 2010;12:194–201. doi: 10.1007/s11883-010-0100-0. [DOI] [PubMed] [Google Scholar]
- 38.Hamilton KK, Zhao J, Sims PJ. Interaction between apolipoproteins A-I and A-II and the membrane attack complex of complement. Affinity of the apoproteins for polymeric C9. J Biol Chem. 1993;268:3632–3638. [PubMed] [Google Scholar]
- 39.Rosenfeld SI, Packman CH, Leddy JP. Inhibition of the lytic action of cell-bound terminal complement components by human high density lipoproteins and apoproteins. J Clin Invest. 1983;71:795–808. doi: 10.1172/JCI110833. [DOI] [PMC free article] [PubMed] [Google Scholar]
- 40.Rus HG, Niculescu F, Porutiu D, Ghiurca V, Vlaicu R. Cells carrying C5b-9 complement complexes in human atherosclerotic wall. Immunol Lett. 1989;20:305–310. doi: 10.1016/0165-2478(89)90039-4. [DOI] [PubMed] [Google Scholar]
- 41.Torzewski M, Klouche M, Hock J, Messner M, Dorweiler B, Torzewski J, Gabbert HE, Bhakdi S. Immunohistochemical demonstration of enzymatically modified human LDL and its colocalization with the terminal complement complex in the early atherosclerotic lesion. Arterioscler Thromb Vasc Biol. 1998;18:369–378. doi: 10.1161/01.atv.18.3.369. [DOI] [PubMed] [Google Scholar]
- 42.Shagdarsuren E, Bidzhekov K, Djalali-Talab Y, Liehn EA, Hristov M, Matthijsen RA, Buurman WA, Zernecke A, Weber C. C1-esterase inhibitor protects against neointima formation after arterial injury in atherosclerosis-prone mice. Circulation. 2008;117:70–78. doi: 10.1161/CIRCULATIONAHA.107.715649. [DOI] [PubMed] [Google Scholar]
- 43.Imhof A, Charnay Y, Vallet PG, Aronow B, Kovari E, French LE, Bouras C, Giannakopoulos P. Sustained astrocytic clusterin expression improves remodeling after brain ischemia. Neurobiol Dis. 2006;22:274–283. doi: 10.1016/j.nbd.2005.11.009. [DOI] [PubMed] [Google Scholar]
- 44.Rosenberg ME, Girton R, Finkel D, Chmielewski D, Barrie A, 3rd, Witte DP, Zhu G, Bissler JJ, Harmony JA, Aronow BJ. Apolipoprotein J/clusterin prevents a progressive glomerulopathy of aging. Mol Cell Biol. 2002;22:1893–1902. doi: 10.1128/MCB.22.6.1893-1902.2002. [DOI] [PMC free article] [PubMed] [Google Scholar]
Associated Data
This section collects any data citations, data availability statements, or supplementary materials included in this article.