Abstract
China, Russia, and India are playing an increasingly important role in global nanotechnology research and development (R&D). This paper comparatively inspects the paper and patent publications by these three countries in the Thomson Science Citation Index Expanded (SCI) database and United States Patent and Trademark Office (USPTO) database (1976–2007). Bibliographic, content map, and citation network analyses are used to evaluate country productivity, dominant research topics, and knowledge diffusion patterns. Significant and consistent growth in nanotechnology papers are noted in the three countries. Between 2000 and 2007, the average annual growth rate was 31.43% in China, 11.88% in Russia, and 33.51% in India. During the same time, the growth patterns were less consistent in patent publications: the corresponding average rates are 31.13, 10.41, and 5.96%. The three countries’ paper impact measured by the average number of citations has been lower than the world average. However, from 2000 to 2007, it experienced rapid increases of about 12.8 times in China, 8 times in India, and 1.6 times in Russia. The Chinese Academy of Sciences (CAS), the Russian Academy of Sciences (RAS), and the Indian Institutes of Technology (IIT) were the most productive institutions in paper publication, with 12,334, 6,773, and 1,831 papers, respectively. The three countries emphasized some common research topics such as “Quantum dots,” “Carbon nanotubes,” “Atomic force microscopy,” and “Scanning electron microscopy,” while Russia and India reported more research on nano-devices as compared with China. CAS, RAS, and IIT played key roles in the respective domestic knowledge diffusion.
Keywords: Bibliographic analysis, Citation analysis of articles and patents, Information visualization, Self-organizing maps, Nanoscience, Nanotechnology, Research and development, Technological innovation, International
Introduction
Nanotechnology is a fundamental technology that promises to revolutionize many industries and change medicine and our daily consumer goods. It is increasingly recognized as an indicator of a nation’s technological competence. More than 60 countries have started national nanotechnology programs (Roco 2001, 2007). Worldwide nanotechnology research has experienced rapid growth in recent years. The status of nanotechnology research and development (R&D) was reviewed in previous papers (Chen and Roco 2009; Hullmann 2007; Kostoff et al. 2006a, b). Li et al. (2008) conducted a longitudinal study of the worldwide nanotechnology development status using papers published in the Thomson Science Citation Index Expanded (SCI) database. Studies on knowledge diffusion between industry and academia were performed by Meyer (2001) and Shapira and Wang (2008).
The United States, Europe, and Japan have been identified in previous studies as major contributors of nanotechnology innovations (Huang et al. 2004). China, Russia, and India have also been active in patent (Huang et al. 2004) and paper (Li et al. 2008) publications and have an increasing impact on global research:
China’s nanotechnology R&D investment is estimated to be about 250 million US dollars in 2008. This is reflected in an increased number of nanotechnology papers, although the paper research impact is still lower than the leading countries (Guan and Ma 2007). Shapira and Wang (2008) reported in China’s relatively high nanotechnology research output with weaknesses in commercialization and international patenting of the research. Bibliometric analysis of Chinese scientific literature was discussed by Zhou and Leydesdorff (2006) and Liu and Zhang (2007).
In Russia, it has been reported that approximately 20–25 million US dollars in funding have been invested on nanotechnology research annually since 2002 (Tretyakov 2007). Borisova et al. (2007) surveyed Russian SCI publication growth and identified the Russian Academy of Sciences (RAS) as the leader among Russian institutions.
In India, the government planned to spend 23 million US dollars on nanotechnology between 2004 and 2009 (Hassan 2005), and the investments on new research programs and centers have increased significantly after 2007. Patent analysis studies have been conducted on the publications of the Council of Scientific and Industrial Research (CSIR) in India (Rajeswari 1996; Sangeetha et al. 1999).
Previously, Bhattacharya and Nath (2002) compared China’s and India’s technology impact using patent grant data from the United States Patent and Trademark Office (USPTO). Bhattacharya et al. (2007) also compared the patents granted by the US, European, and Indian Patent Offices for India’s nanotechnology research status. Kostoff et al. (2007a, b) assessed the science and technology (S&T) status of India and China based on scientific literature in the SCI database. In order to provide a more comprehensive assessment of the nanotechnology research and development in China, Russia, and India, this paper studies their nanotechnology scientific literature and patent publications in the Thomson SCI and USPTO databases.
Methodology
We apply a keyword-searching method to collect nanotechnology papers and patents similar to the methodology used by Huang et al. (2004). The list of nanotechnology keywords was provided by domain experts (Huang et al. 2004). We choose the Thomson SCI database for paper collection. It provides a broad coverage of journals in more than 150 disciplines, including Biology, Chemistry, Engineering, Materials Science, Medicine, etc. Such broad coverage is relevant due to the multi-disciplinary nature of the field of nanotechnology, which may lead to publication of nanotechnology papers across a wide range of journals. SCI provides citation information between papers, which allows one to analyze paper impact. We choose the USPTO database for patent collection. The USPTO database is the largest repository for nanotechnology innovations in the world (Li et al. 2007; Kowalski et al. 2003), which allows us to provide a representative comparison of nanotechnology advances between countries. The USPTO requires applicants to cite all related prior work, which enables citation-based analysis. For the collection of papers, we conduct keyword search only in the title and abstracts (“title–abstract” search) as they are publically available. For the collection of patents, we conduct keyword search in entire patent contents (“full-text” search).
Our collections of SCI papers and USPTO patents span from 1976 to 2007. We apply bibliographic, content map, and citation network analyses in our paper and patent datasets. Bibliographic analysis includes basic analysis, publication trends, and impact analysis for each country. We identified the most productive and higher impact institutions and the journals with a large number of publications for each country. The citation network analysis describes the knowledge diffusion in these countries. Due to limitations in the data, some analyses were not statistically meaningful and are not reported here. Table 1 showed data reported in this paper.
Table 1.
Article and patent application status analysis
| Type of analysis | SCI papers | USPTO patents |
|---|---|---|
| Bibliographic analysis | ||
| Basic analysis | Top 10 institutions | Top 10 assignees |
| Top 10 journals | ||
| Publication trends | Each country’s paper publication trend | Each country’s patent publication trend |
| Top 10 institutions’ paper publication trend | ||
| Impact analysis | Each country’s average number of citations | Each country’s average number of citations |
| High impact institutions | ||
| Topic coverage | Content map analysis | |
| Knowledge diffusion | Institution citation network analysis | |
Data description
SCI papers
We collect SCI papers for these three countries span from 1976 to 2007. China had a total of 49,193 nanotechnology-related SCI papers, with its first paper published in 1984 (Table 2). These papers were published by 2,990 institutions and 29,381 authors. Russia had a total of 12,307 papers published by 1,593 institutions and 22,758 authors from 1976 to 2007. The number was much smaller for India, with 9,126 publications from 1,116 institutions and 11,092 authors between 1980 and 2007. In recent years, the three countries experienced rapid growth in paper publications. In China, the number of nanotechnology papers increased 577% from 2000 to 2007, while the contributing authors increased 344% (Table 3). In the same time period, Indian paper publications increased 656%, although the total number of publications is still small. Russia had a relatively slower growth rate (119% for papers and 143% for authors) compared with the other two countries.
Table 2.
Data summary of nanotechnology papers in SCI
| Country | Year | Papers | Institutions | Authors |
|---|---|---|---|---|
| China | 1984–2007 | 49,193 | 2,990 | 29,381 |
| Russia | 1976–2007 | 12,307 | 1,593 | 22,758 |
| India | 1980–2007 | 9,126 | 1,116 | 11,092 |
Table 3.
Data comparison between 2000 and 2007 in SCI
| Country | Papers in 2000 | Papers in 2007 | Paper increase (%) | Authors in 2000 | Authors in 2007 | Author increase (%) |
|---|---|---|---|---|---|---|
| China | 1,670 | 11,313 | 577 | 3,473 | 15,417 | 344 |
| Russia | 816 | 1,790 | 119 | 2,544 | 6,177 | 143 |
| India | 303 | 2,291 | 656 | 755 | 4,547 | 502 |
USPTO patents
In USPTO, patents were also collected in 1976–2007 period for the three countries. China assigned its first nanotechnology patent in 1989 and had a total of 162 patents in this time period (Table 4). These patents were assigned to 104 assignees and 364 inventors. India produced fewer patents than China, and Russia had far fewer than both China and India. While the total numbers of patent publications are limited, the three countries still showed a pattern of growth. For example, China increased 567% in patent publications and 920% in number of inventors from 2000 to 2007 (Table 5).
Table 4.
Data summary of nanotechnology patents in USPTO
| Country | Year | Patents | Assignees | Inventors |
|---|---|---|---|---|
| China | 1989–2007 | 162 | 104 | 364 |
| Russia | 1980–2007 | 30 | 32 | 147 |
| India | 1983–2007 | 115 | 41 | 386 |
Table 5.
Data comparison between 2000 and 2007 in USPTO
| Country | Patents in 2000 | Patents in 2007 | Patent increase (%) | Inventors in 2000 | Inventors in 2007 | Inventor increase (%) |
|---|---|---|---|---|---|---|
| China | 3 | 20 | 567 | 5 | 51 | 920 |
| Russia | 1 | 2 | 100 | 5 | 11 | 120 |
| India | 4 | 6 | 50 | 15 | 28 | 87 |
Bibliographic analysis
Basic analysis: top institutions/assignees
Tables 6, 7, and 8 show the top 10 institutions with the most nanotechnology paper publications in China, Russia, and India, along with their number of publications in 2000 and 2007. We found that nine of the top 10 Chinese institutions were universities (Table 6). Chinese Academy of Sciences (CAS) published the largest number of nano-related papers in China, which was about four times as many as the second productive institution. Tsinghua University, University of Science and Technology of China (“Univ Sci & Technol China” in the table), Nanjing University and Peking University were the most productive universities. In China, papers published in 2007 for the top institutions account for nearly one-fifth of their total publications. Among the top 10 institutions, Zhejiang University demonstrated the most rapid increase from 2000 to 2007 (with 24 papers in 2000 and 443 papers in 2007). Shanghai Jiao Tong University and Shandong University also had fast growth.
Table 6.
Top 10 institutions in nanotechnology paper publication in China (1976–2007)
| Rank | Institutions in China | # in 2000 | # in 2007 | # in 1976–2007 |
|---|---|---|---|---|
| 1 | Chinese Academy of Sciences | 552 | 2,310 | 12,334 |
| 2 | Tsinghua University | 123 | 540 | 2,995 |
| 3 | Univ Sci & Technol China | 142 | 458 | 2,687 |
| 4 | Nanjing University | 102 | 386 | 2,360 |
| 5 | Peking University | 167 | 329 | 2,284 |
| 6 | Jilin University | 59 | 320 | 1,748 |
| 7 | Zhejiang University | 24 | 443 | 1,720 |
| 8 | Fudan University | 51 | 340 | 1,465 |
| 9 | Shanghai Jiao Tong University | 19 | 336 | 1,351 |
| 10 | Shandong University | 21 | 237 | 1,184 |
Table 7.
Top 10 institutions in nanotechnology paper publication in Russia (1976–2007)
| Rank | Institutions in Russia | # in 2000 | # in 2007 | # in 1976–2007 |
|---|---|---|---|---|
| 1 | Russian Academy of Sciences | 443 | 989 | 6,773 |
| 2 | Moscow Mv Lomonosov State Univ | 78 | 225 | 1,421 |
| 3 | AF Ioffe Phys Tech Institute | 67 | 53 | 649 |
| 4 | St Petersburg State University | 23 | 73 | 397 |
| 5 | Ufa State Aviat Tech University | 10 | 18 | 194 |
| 6 | Joint Institute of Nuclear Research | 5 | 30 | 140 |
| 7 | Boreskov Inst Catalysis | 10 | 19 | 137 |
| 8 | Si Vavilov State Opt Inst | 6 | 11 | 135 |
| 9 | Novosibirsk State University | 9 | 0 | 110 |
| 10 | Technical University | 5 | 27 | 106 |
Table 8.
Top 10 institutions in nanotechnology paper publication in India (1976–2007)
| Rank | Institutions in India | # in 2000 | # in 2007 | # in 1976–2007 |
|---|---|---|---|---|
| 1 | Indian Institute of Technology | 62 | 464 | 1,845 |
| 2 | Indian Institute of Science | 29 | 169 | 828 |
| 3 | Natl Chem Laboratory | 26 | 79 | 603 |
| 4 | Indian Assoc Cultivat Sci | 17 | 149 | 529 |
| 5 | Bhabha Atom Research Center | 11 | 81 | 409 |
| 6 | Jawaharlal Nehru Ctr Adv Sci Res | 20 | 65 | 303 |
| 7 | University Delhi | 5 | 70 | 229 |
| 8 | National Physics Laboratory | 6 | 65 | 222 |
| 9 | Tata Inst Fundamental Res | 6 | 25 | 189 |
| 10 | Indian Inst Chem Technol | 5 | 64 | 184 |
In Russia, five of the top 10 productive institutions were universities. RAS published the most nanotechnology papers in Russia: about five times as many as the second most productive institution, Moscow’s M.V. Lomonosov State University (“Moscow Mv Lomonosov State Univ” in the table). All the other institutions published a limited number of papers. From 2000 to 2007, most institutions had a slow increase in paper publications. However, A.F. Ioffe Physical Technical Institute (“AF Ioffe Phys Tech Institute” in the table) and Novosibirsk State University showed a decrease pattern (Table 7).
In India, most of the top 10 institutions were research institutions and labs. Indian Institutes of Technology (IIT) were the most productive institution, with about twice as many publications as the second productive institution, the Indian Institute of Science (IIS; Table 8). The top institutions had a rapid increase in paper publications from 2000 to 2007. The Indian Association for the Cultivation of Science (“India Assoc Cultivat Sci” in the table) showed the largest increase, publishing 149 papers in 2007 as compared with its 17 publications in 2000.
Tables 9, 10, and 11 report the most productive assignees in patent publication in these three countries. In China, most of the top patent assignees are universities and private companies; many institutions are in Hong Kong. SAE Magnetics (H.K.) Ltd., one of the world’s leading independent manufacturers of hard disk magnetic recording heads, was the most productive in publishing nano-related patents. It produced nearly twice as many patents as the second productive institution, Tsinghua University. Tsinghua University and CAS, the most productive institutions in paper publications, were also among the top Chinese assignees (Table 9). In Russia, most assignees did not publish a large number of nano-related patents in USPTO (Table 10). All the assignees in India were universities, private companies, or national research centers (Table 11). Among them, the Council of Scientific and Industrial Research (CSIR), a national research center, was the most productive assignee. It has nearly seven times as many patents as secondary institutions.
Table 9.
Top 10 assignees in nanotechnology patent publication in China (1976–2007)
| Rank | Assignees in China | # in 2000 | # in 2007 | # in 1976–2007 |
|---|---|---|---|---|
| 1 | SAE Magnetics (H.K.) Ltd. | 0 | 2 | 30 |
| 2 | Tsinghua University | 0 | 1 | 16 |
| 3 | Chinese Academy of Sciences | 1 | 0 | 12 |
| 4 | China Petroleum and Chemical Corporation | 0 | 0 | 7 |
| 5 | The Hong Kong Polytechnic University | 0 | 1 | 7 |
| 6 | Hong Kong Univ Science and Technolology | 1 | 0 | 7 |
| 7 | City University Hong Kong | 0 | 0 | 6 |
| 8 | Narhex Limited | 1 | 0 | 5 |
| 9 | Chinese Univ Hong Kong | 1 | 1 | 5 |
| 10 | Astec International Limited | 1 | 0 | 4 |
Table 10.
Top 10 assignees in nanotechnology patent publication in Russia (1976–2007)
| Rank | Assignees in Russia | # in 2000 | # in 2007 | # in 1976–2007 |
|---|---|---|---|---|
| 1 | Crystals and Technologies, Ltd. | 0 | 0 | 2 |
| 2 | Obschestvo s ogranichennoy otvetstvennostyu Vysokie Tekhnologii | 0 | 0 | 2 |
| 3 | Babizhayev; Marc | 0 | 0 | 1 |
| 4 | Gandelman; LeonidYakovlevich | 0 | 0 | 1 |
| 5 | Gosudarstvenny. Nauchno-Issledovatelsky Institut Genetiki I Selektsii | 0 | 0 | 1 |
| 6 | Institut Neftekhimicheskogo Sinteza Imeni A.V.Topchieva Rossiiskoi | 0 | 0 | 1 |
| 7 | Institut Organicheskoy Khimii Akademii Nauk Kirgizskoi | 0 | 0 | 1 |
| 8 | Institute for Protein Research | 0 | 0 | 1 |
| 9 | Institute for Roentgen Optics | 0 | 0 | 1 |
| 10 | Stepanovich; Kodratenko Vladimir | 0 | 0 | 1 |
Table 11.
Top 10 assignees in nanotechnology patent publication in India (1976–2007)
| Rank | Assignees in India | # in 2000 | # in 2007 | # in 1976–2007 |
|---|---|---|---|---|
| 1 | CSIR | 1 | 1 | 64 |
| 2 | Dabur Research Foundation | 0 | 1 | 10 |
| 3 | Dr. Reddy’s Research Foundation | 2 | 0 | 9 |
| 4 | Dr. Reddy’s Laboratories Ltd. | 0 | 1 | 6 |
| 5 | Panacea Biotec Limited | 0 | 0 | 2 |
| 6 | Department of Biotechnology Department of the Government of India | 0 | 0 | 1 |
| 7 | Department of Science & Technology | 0 | 0 | 1 |
| 8 | Galaxy Surfactants Limited | 0 | 0 | 1 |
| 9 | Indian Explosives Limited | 0 | 0 | 1 |
| 10 | University of Delhi, Department of Chemistry | 0 | 0 | 1 |
Comparing the paper and patent publications in these three countries, we found that: (1) China published more papers and patents in the nanotechnology domain than Russia and India, (2) CAS, RAS, and IIT were the most productive in paper publications in the three countries, respectively, and (3) the most productive institutions were quite different in paper and patent publications: most of the productive paper publication institutions were universities, while several product patent assignees were private companies. Some of the top Chinese universities, such as Tsinghua University and CAS, were productive in both paper and patent publications.
Basic analysis: top journals
Tables 12, 13, and 14 present the major journals in which nanotechnology papers were published in the three countries. We manually identified the journals’ publication countries and subject categories in the Thomson SCI database.
Table 12.
Top 10 journals in nanotechnology paper publication in China (1976–2007)
| Rank | Journal | Journal country | Subject categories | # in 2000 | # in 2007 | # in 1976–2007 |
|---|---|---|---|---|---|---|
| 1 | Applied Physics Letters | United States | Physics, Applied | 56 | 329 | 1,458 |
| 2 | Materials Letters | Netherlands | Materials Sciences, Multidisciplinary; Physics, Applied | 15 | 453 | 1,328 |
| 3 | Journal of Physical Chemistry B | United States | Chemistry, Physical | 15 | 81 | 969 |
| 4 | Physical Review B | United States | Physics, Condensed Matter | 45 | 152 | 909 |
| 5 | Chemical Journal of Chinese Universities-Chinese | China | Chemistry, Multidisciplinary | 50 | 111 | 898 |
| 6 | Nanotechnology | England | Engineering, Multidisciplinary; Nanoscience & Nanotechnology; Materials Science, Multidisciplinary; Physics, Applied | 1 | 303 | 876 |
| 7 | Journal of Crystal Growth | Netherlands | Crystallography | 48 | 112 | 835 |
| 8 | Rare Metal Materials and Engineering | China | Materials Science, Multidisciplinary; Metallurgy and Metallurgical Engineering | 10 | 244 | 818 |
| 9 | Journal of Applied Physics | United States | Physics, Applied | 51 | 151 | 734 |
| 10 | Acta Physica Sinica | China | Physics, Multidisciplinary | 42 | 122 | 727 |
Table 13.
Top 10 journals in nanotechnology paper publication in Russia (1976–2007)
| Rank | Journal | Journal country | Subject categories | # in 2000 | # in 2007 | # in 1976–2007 |
|---|---|---|---|---|---|---|
| 1 | Physical Review B | United States | Physics, Condensed Matter | 22 | 83 | 560 |
| 2 | Physics of the Solid State | Russia | Physics, Condensed Matter | 29 | 63 | 523 |
| 3 | Semiconductors | Russia | Physics, Condensed Matter | 42 | 43 | 411 |
| 4 | Technical Physics Letters | Russia | Physics, Applied | 19 | 56 | 322 |
| 5 | JETP Letters | Russia | Physics, Multidisciplinary | 21 | 33 | 296 |
| 6 | Applied Physics Letters | United States | Physics, Applied | 14 | 28 | 223 |
| 7 | Physics of Metals and Metallography | Russia | Metallurgy and Metallurgical Engineering | 10 | 22 | 190 |
| 8 | Inorganic Materials | Russia | Materials Science, Multidisciplinary | 10 | 30 | 175 |
| 9 | Journal of Experimental and Theoretical Physics | Russia | Physics, Multidisciplinary | 11 | 32 | 167 |
| 10 | Physics of Low-dimensional Structures | United States | Physics, Applied; Physics, Condensed Matter | 7 | 0 | 158 |
Table 14.
Top 10 journals in nanotechnology paper publication in India (1976–2007)
| Rank | Journal | Journal country | Subject categories | # in 2000 | # in 2007 | # in 1976–2007 |
|---|---|---|---|---|---|---|
| 1 | Journal of Nanoscience and Nanotechnology | United States | Chemistry, Multidisciplinary | 0 | 134 | 254 |
| 2 | Journal of Applied Physics | United States | Physics, Applied | 17 | 75 | 249 |
| 3 | Physical Review B | United States | Physics, Condensed Matter | 14 | 35 | 227 |
| 4 | Materials Letters | Netherlands | Materials Science, Multidisciplinary; Physics, Applied | 9 | 56 | 206 |
| 5 | Applied Physics Letters | United States | Physics, Applied | 9 | 48 | 194 |
| 6 | Langmuir | United States | Chemistry, Physical | 14 | 38 | 192 |
| 7 | Journal of Physical Chemistry B | United States | Chemistry, Physical | 4 | 26 | 183 |
| 8 | Applied Surface Science | Netherlands | Chemistry, Physical; Materials Science, Coatings and Films; Physics, Applied; Physics, Condensed Matter | 2 | 31 | 139 |
| 9 | Journal of Applied Polymer Science | United States | Polymer Science | 4 | 45 | 132 |
| 10 | Nanotechnology | England | Engineering, Multidisciplinary; Nanoscience and Nanotechnology; Materials Science, Multidisciplinary; Physics, Applied | 1 | 51 | 132 |
Applied Physics Letters, Materials Letters, and Journal of Physical Chemistry B published the largest number of Chinese nanotechnology papers. Of the top 10 journals for Chinese nanotechnology paper publication, four were in the United States, two were in the Netherlands, one was in England, and the other three were in China. These journals are related to categories, such as physics, chemistry, and material science (Table 12). Most of the top journals showed an increase in publishing Chinese nanotechnology papers. For example, Nanotechnology published only one paper in 2000 and 303 papers in 2007. The Chinese nanotechnology paper publications in Materials Letters also increased 29 times, from 15 papers in 2000 to 453 papers in 2007.
Physical Review B, Physics of the Solid State, and Semiconductors were the top three journals for publishing Russian nanotechnology papers. Among the top 10 publication sources, seven were domestic journals (Russian journals) and the other three journals were from the United States (Table 13). Most of them were quite consistent in their subject categories and focused on physics. In general, these journals showed an increase in publishing Russian papers in 2007 as compared with 2000 (Table 13). Among them, Technical Physics Letters showed a higher growth rate, from 19 papers in 2000 to 56 papers in 2007.
Journal of Nanoscience and Nanotechnology, Journal of Applied Physics, and Physical Review B were the sources that published the greatest number of Indian nanotechnology papers (Table 14). Of the top 10 journals, seven were from the United States, two from the Netherlands and one from England. Most of the top sources focused on chemistry, physics, materials, and the like. India has published papers in Journal of Nanoscience and Nanotechnology since 2001, and it was the most productive publication source in 2007. Many other journals also showed a fast increase, such as Nanotechnology and Applied Surface Science.
In general, journals from the US and the Netherlands were the major sources that published the three countries’ papers. In addition, domestic journals played a very important role in publishing Russian and Chinese papers. Physics of the Solid State and Chemistry Journal of Chinese Universities-Chinese are the major domestic journals for Russia and China, respectively. Physical Review B and Applied Physics Letters were the two major international journals for the three countries. Nanotechnology, an English journal, showed a rapid increasing trend in publishing both Chinese and Indian papers.
Publication trends: country level
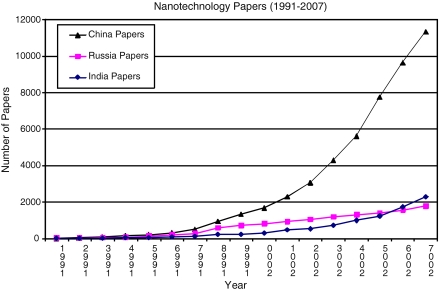
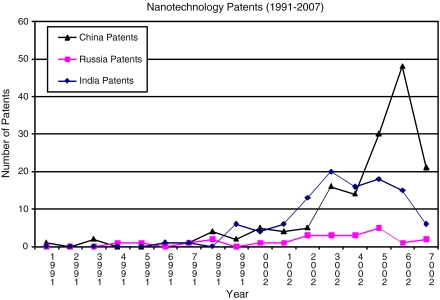
Figures 1 and 2 show the paper and patent publication trends for China, Russia, and India from 1991 to 2007 (the other years were omitted due to the limited number of publications). Comparing the three countries, the numbers of SCI papers published by China highly exceeded those published by Russia and India, especially during the 2000s. India showed a faster increase in the 2000s than Russia, and exceeded Russia in 2006 and 2007 (Fig. 1). After year 2000, the average annual growth rate for paper publications in China was 31.43%, as compared with 11.88% in Russia, and 33.51% in India.
Fig. 1.
Number of nanotechnology papers in the SCI database (1991–2007)
Fig. 2.
Number of nanotechnology patents in the USPTO database (1991–2007)
Patent publication in China had an increasing trend after 1995, but showed a decrease in 2007. India showed a decreasing trend after 2002. Russia’s patent publication did not show much increase after 2003 (Fig. 2). The corresponding increase rates for patent publications are 31.13% in China, 10.41% in Russia, and 5.96% in India.
Publication trends: institution level
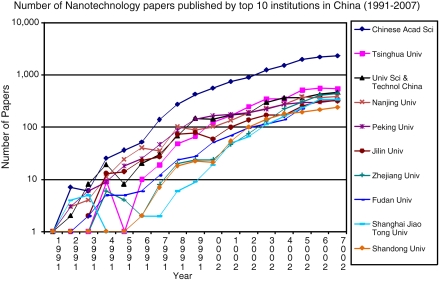
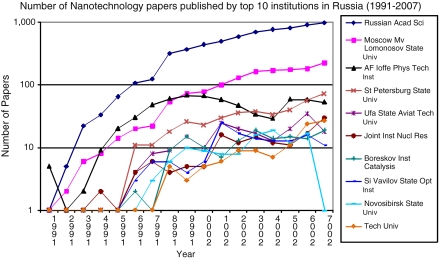
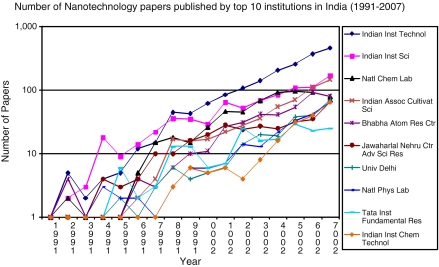
Figures 3, 4, and 5 illustrate the paper publication trends for the most productive institutions in the three countries (starting from 1991 due to the limited publications before 1991).
Fig. 3.
Top 10 institutions in China in nanotechnology paper publications (1991–2007; log scale)
Fig. 4.
Top 10 institutions in Russia in nanotechnology paper publications (1991–2007; log scale)
Fig. 5.
Top 10 institutions in India in nanotechnology paper publications (1991–2007; log scale)
In China, CAS displayed the fastest growth (Fig. 3). The other top 10 institutions, such as Tsinghua University, the University of Science and Technology of China, Nanjing University, Peking University, etc., showed a similar increasing trend in nanotechnology paper publication in the last 10-year period.
In Russia, RAS was distinguished from other institutions by its consistent growth pattern and the amount of publications (Fig. 4). Moscow’s M.V. Lomonosov State University was the second most productive institution. Several of the top 10 institutions showed a slow-down pattern in paper publication after 2000, such as the A.F. Ioffe Physical Technical Institute, Ufa State Aviation Technical University, and Novosibirsk State University. These changes may reflect the change of these institutions’ focuses in recent years.
In India, most of the top 10 institutions showed a consistent increase in the last decade. IIT consistently had the largest publications after 1998. IIS had a lower growth rate than IIT and showed a similar publication trend to that of the National Chemical Laboratory from year 2000 to 2005, while the latter showed a decrease pattern after 2005. Indian Association for the Cultivation of Science maintained a steady increase rate during the 2000s and ranked third in 2007 within these institutions. The Indian Institution of Chemical Technology also experienced a rapid increase after 2002 (Fig. 5).
Comparing the three countries’ paper publication trends, we noticed that the most top institutions in China and India show a consistent upward trend, while many Russian institutions’ nanotechnology publications slowed down after 1995. This could indicate Russia’s different strategies as compared with China and India, in that Russia may focus on supporting nanotechnology research in only a few major institutions, such as RAS and Moscow’s M.V. Lomonosov State University.
Impact analysis: country level
Tables 15 and 16 illustrate the total number of citations received by the three countries in 2000/2007 and the average number of citations per paper from 1976 to 2007. The impact of Chinese papers, gauged by the average number of citations from 1976 to 2007, is slightly higher than that of Russia and India (Table 15). In 2000, Chinese papers only received 3,503 citations, and in 2007 this increased nearly 12.8 times to 44,734. The citations to Russian and Indian papers have also increased 1.6 and 8 times during this time period, respectively. China and Russian had similar patent impact while India’s was significantly lower (Table 16).
Table 15.
The three countries’ paper impact
| Country | # papers (1976–2007) | # citations in 2000 | # citations in 2007 | Average number of citations (1976–2007) |
|---|---|---|---|---|
| China | 49,193 | 3,503 | 44,734 | 3.28 |
| Russia | 12,307 | 2,783 | 4,429 | 3.15 |
| India | 9,126 | 869 | 6,947 | 3.17 |
Table 16.
The three countries’ patent impact
| Country | # patents (1976–2007) | # citations in 2000 | # citations in 2007 | Average number of citations (1976–2007) |
|---|---|---|---|---|
| China | 162 | 9 | 34 | 0.73 |
| Russia | 30 | 0 | 6 | 0.70 |
| India | 115 | 2 | 3 | 0.21 |
Impact analysis: institution level
Tables 17, 18, and 19 identify the high impact institutions in China, Russia, and India according to the average number of citations received from all SCI papers. We keep only the institutions with more than 100 papers to filter out the small institutions with a few high impact publications. The tables also report the number of citations received in 2000 and 2007 for these high impact institutions.
Table 17.
High impact Chinese institutions with more than 100 papers
| Rank | Institution in China | # papers (1976–2007) | # citations in 2000 | # citations in 2007 | Average number of citations (1976–2007) |
|---|---|---|---|---|---|
| 1 | Hong Kong Univ Sci & Technol | 928 | 201 | 1,306 | 6.90 |
| 2 | City Univ Hong Kong | 835 | 155 | 1,080 | 6.71 |
| 3 | Peking University | 2,284 | 514 | 3,145 | 6.25 |
| 4 | Univ Sci & Technol China | 2,687 | 324 | 3,693 | 5.50 |
| 5 | Zhongshan University | 648 | 55 | 854 | 4.95 |
| 6 | Chinese Univ Hong Kong | 581 | 86 | 718 | 4.68 |
| 7 | Tsinghua University | 2,995 | 208 | 3,767 | 4.62 |
| 8 | Univ Hong Kong | 634 | 49 | 630 | 4.41 |
| 9 | Nanjing University | 2,360 | 241 | 2,549 | 4.00 |
| 10 | Chinese Academy of Sciences | 12,334 | 1,034 | 13,195 | 3.90 |
Table 18.
High impact Russian institutions with more than 100 papers
| Rank | Institution in Russia | # papers (1976–2007) | # citations in 2000 | # citations in 2007 | Average number of citations (1976–2007) |
|---|---|---|---|---|---|
| 1 | AF Ioffe Phys Tech Institute | 649 | 721 | 308 | 10.53 |
| 2 | Ufa State Aviat Tech University | 194 | 52 | 176 | 6.99 |
| 3 | Boreskov Inst Catalysis | 137 | 33 | 112 | 4.74 |
| 4 | Si Vavilov State Opt Inst | 135 | 21 | 59 | 3.00 |
| 5 | Russian Academy of Sciences | 6,773 | 1,060 | 2, 337 | 2.57 |
| 6 | Moscow MV Lomonosov State Univ | 1,421 | 186 | 508 | 2.49 |
| 7 | Novosibirsk State University | 110 | 5 | 40 | 2.11 |
| 8 | Technical University | 106 | 4 | 30 | 1.55 |
| 9 | St Petersburg State University | 397 | 35 | 101 | 1.45 |
| 10 | Joint Institute of Nuclear Research | 140 | 5 | 39 | 1.44 |
Table 19.
High impact Indian institutions with more than 100 papers
| Rank | Institution in India | # papers (1976–2007) | # citations in 2000 | # citations in 2007 | Average number of citations (1976–2007) |
|---|---|---|---|---|---|
| 1 | Jawaharlal Nehru Ctr Adv Sci Res | 303 | 124 | 541 | 11.72 |
| 2 | Indian Institute of Science | 828 | 242 | 982 | 6.95 |
| 3 | Natl Chem Lab | 603 | 162 | 886 | 6.85 |
| 4 | CSIR | 151 | 28 | 208 | 5.73 |
| 5 | Tata Inst Fundamental Res | 189 | 13 | 173 | 4.52 |
| 6 | Univ Poona | 143 | 15 | 146 | 4.42 |
| 7 | Saha Inst Nucl Phys | 159 | 23 | 142 | 3.94 |
| 8 | Cent Electrochem Res Inst | 118 | 30 | 64 | 3.17 |
| 9 | University Madras | 111 | 5 | 75 | 2.90 |
| 10 | Indira Gandhi Ctr Atom Res | 182 | 15 | 121 | 2.76 |
Among all Chinese institutions (Table 17), Hong Kong University of Science and Technology, City University of Hong Kong, and Peking University received the most citations. Four of the top 10 institutions are in Hong Kong. Several productive institutions also have a high impact, such as Peking University, University of Science and Technology in China, Tsinghua University, Nanjing University, and CAS. Among these institutions, the papers produced by the CAS received 13,195 citations in 2007, which was nearly 30% of all 44,734 citations received by Chinese papers in 2007. The impact of papers from Tsinghua University, Zhongshan University, and the University of Hong Kong had a rapid increase from 2000 to 2007. Each of them received more than 10 times more citations in 2007 as compared to 2000.
Among the high impact Russian institutions, the A.F. Ioffe Physical Technical Institute had the highest average number of citations. However, its citations received in 2007 decreased to less than half of that in 2000. All the other institutions received more citations in 2007 as compared with 2000. RAS and Moscow’s M.V. Lomonosov State University, the two most productive institutions in Russia, were fifth and sixth according to their impact.
In India, four of the high impact institutions, namely, IIS, National Chemical Laboratory, Jawaharlal Nehru Centre for Advanced Scientific Research, and Tata Institute Fundamental Research, were also among the top 10 productive institutions. Among them, Jawaharlal Nehru Centre for Advanced Scientific Research has much higher citation rates than other institutions. In general, the top institutions’ impact increased from 2000 to 2007 according to the citations they received.
Content map analysis
We used content maps to identify the dominant research topics of the three countries. Due to the limited number of patents in our data set, we were only able to conduct content map analysis on SCI papers (1976–2007). We first extracted possible topic terms from the papers’ abstracts using the Arizona Noun Phraser (Tolle and Chen 2000), a tool developed in the Artificial Intelligence Lab. Then, the topic terms were organized using the multi-level self-organizing map algorithm (Chen et al. 1996; Ong et al. 2005), which positions similar topics closer together according to their co-occurrence patterns.
Since “nanotechnology” encompasses many disciplines and research areas, the research topics have relevance to a wide range of technologies. Based on feedback from selected nanotechnology researchers, we categorize and discuss the nanotechnology topics we generated according to the following major sub-topics:
nanomaterial, which focuses on the development of nanomaterials and their novel electrical, catalytic, magnetic, thermal, or imaging features,
nano-devices, which include the creation and use of nano-scale structures, devices, and systems that have novel properties and functions due to their small size, and
measurement and characterization: the tools, methods, or experiment environments used to control or manipulate matter on an atomic scale.
Chinese SCI papers (1976–2007)
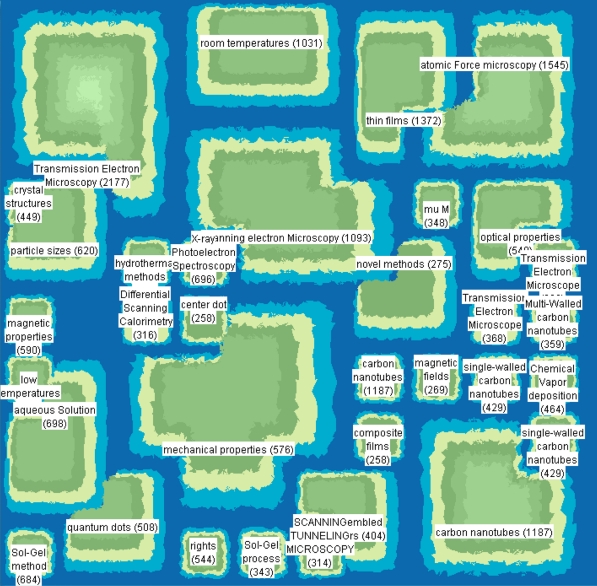
Figure 6 shows the content map for nanotechnology papers from China published from 1976 to 2007. The meaningful topics in the graph are listed in Table 20. Paper topics covered in this time period focused primarily on nanomaterials and measurement.
Nanomaterial-related topics included “Thin films,” “Carbon nanotubes,” “Quantum dots,” “Single-walled carbon nanotubes,” “Self-assembled monolayers,” “Multi-walled carbon nanotubes,” “Center dot,” and “Composite films.”
For measurement and characterization, the top topics discussed were “Transmission electron microscope,” “Atomic force microscope,” “Scanning electron microscopy,” “X-ray photoelectron spectroscopy,” and “Scanning tunneling microscopy.” Using those measuring tools, scholars combined different classical methods in chemistry or physical disciplines, such as “Aqueous solutions,” “Sol–gel method,” “Hydrothermal methods,” etc. and investigated phenomena, such as “Magnetic properties,” “Mechanical properties,” and “Optical properties,” which may be displayed by nanoparticles under the effect of “Atomic force” or “Quantum effects.”
Fig. 6.
Content Map of SCI Papers (China), 1976–2007
Table 20.
Topics of SCI Papers (China), 1976–2007
| Rank | Region label | # of papers in the region |
|---|---|---|
| 1 | Transmission electron microscopy | 2,177 |
| 2 | Atomic force microscopy | 1,545 |
| 3 | Thin films | 1,372 |
| 4 | Carbon nanotubes | 1,187 |
| 5 | Scanning electron microscopy | 1,093 |
| 6 | Room temperatures | 1,031 |
| 7 | Aqueous solutions | 698 |
| 8 | X-ray photoelectron spectroscopy | 696 |
| 9 | Sol–gel method | 684 |
| 10 | Low temperatures | 653 |
| 11 | Particle sizes | 620 |
| 12 | Magnetic properties | 590 |
| 13 | Mechanical properties | 576 |
| 14 | Optical properties | 548 |
| 15 | Quantum dots | 508 |
| 16 | Chemical vapor deposition | 464 |
| 17 | Crystal structures | 449 |
| 18 | Single-walled carbon nanotubes | 429 |
| 19 | Self-assembled monolayers | 404 |
| 20 | Transmission electron microscope | 368 |
| 21 | Multi-walled carbon nanotubes | 359 |
| 22 | Mu M | 348 |
| 23 | Sol–gel process | 343 |
| 24 | Hydrothermal methods | 320 |
| 25 | Differential scanning calorimetry | 316 |
| 26 | Scanning tunneling microscopy | 314 |
| 27 | Magnetic fields/electric field | 269 |
| 28 | Center dot gold nanoparticles | 258 |
| 29 | Composite films potential applications | 258 |
Russian SCI papers (1976–2007)
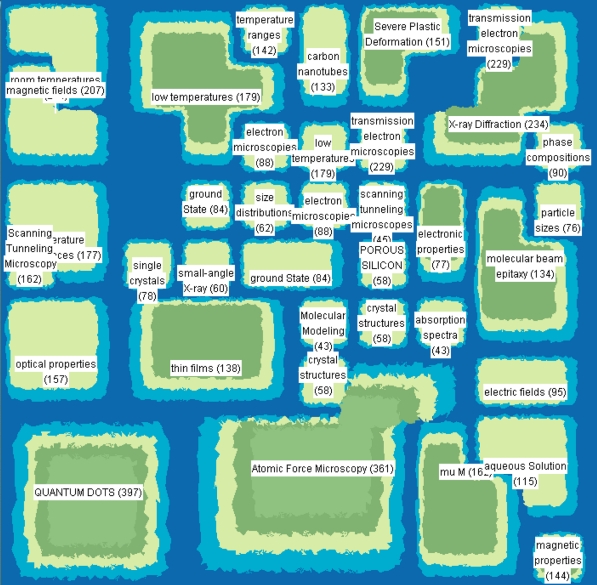
Figure 7 and Table 21 show the topics covered by Russian SCI papers from 1976 to 2007.
Major nanomaterial-related topics included “Quantum dots,” “Thin films,” and “Carbon nanotubes.” There were also topics about the properties of nanomaterials on particle state, such as “Ground state,” “Single crystals,” and “Crystal structures,” and on particle size, such as “Particle sizes,” and “Size distribution.”
Nano-device related topics included “Severe plastic deformation,” “Phase compositions,” and “Porous silicon.”
Measurement-related topics included “Atomic force microscopy,” “X-ray diffraction,” “Transmission electron microscopies,” “Scanning tunneling microscopy,” “Molecular beam epitaxy,” “Small-angle X-ray,” and “Absorption spectra.” In Russian SCI papers, the most popular methods were related to “Aqueous solutions” and “Molecular modeling.” Other topics about experiment environments were mainly about temperature, such as “Room temperatures,” “Temperature dependences,” and “Temperature ranges.” Meanwhile, under a particular effect, “Quantum effects,” different properties of the nanoparticles were discussed, such as “Optical properties” and “Magnetic properties.”
Fig. 7.
Content Map of SCI Papers (Russia), 1976–2007
Table 21.
Topics of SCI Papers (Russia), 1976–2007
| Rank | Region Label | # of papers in the region |
|---|---|---|
| 1 | Quantum dots | 397 |
| 2 | Atomic force microscopy | 361 |
| 3 | X-ray diffraction | 234 |
| 4 | Transmission electron microscopies | 229 |
| 5 | Room temperatures | 214 |
| 6 | Magnetic fields | 207 |
| 7 | Low temperatures | 179 |
| 8 | Temperature dependences | 177 |
| 9 | Scanning tunneling microscopy | 162 |
| 10 | Mu M | 162 |
| 11 | Optical properties | 157 |
| 12 | Severe plastic deformation | 151 |
| 13 | Magnetic properties | 144 |
| 14 | Temperature ranges | 142 |
| 15 | Thin films | 138 |
| 16 | Molecular beam epitaxy | 134 |
| 17 | Carbon nanotubes | 133 |
| 18 | Aqueous solutions | 115 |
| 19 | Electric fields | 95 |
| 20 | Phase compositions | 90 |
| 21 | Electron microscopies | 88 |
| 22 | Ground state | 84 |
| 23 | Single crystals | 78 |
| 24 | Electronic properties | 77 |
| 25 | Particle sizes | 76 |
| 26 | Size distributions | 62 |
| 27 | Small-angle X-ray | 60 |
| 28 | Porous silicon | 58 |
| 29 | Crystal structures | 58 |
| 30 | Scanning tunneling microscopes | 45 |
| 31 | Molecular modeling | 43 |
| 32 | Absorption spectra | 43 |
Indian SCI papers (1976–2007)
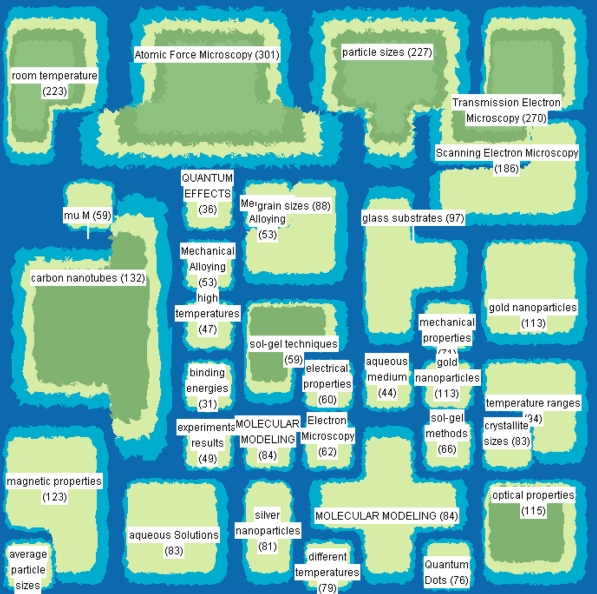
Figure 8 and Table 22 show the topics for India’s paper publication.
For nanomaterial topics, Indian papers covered “Carbon nanotubes,” “Gold nanoparticles,” “Silver nanoparticles,” and “Quantum dots.” They also covered some properties of particles such as “Particle sizes,” “Average particle size,” “Grain sizes,” and “Crystallite sizes.”
For nano-device topics, Indian papers covered “Glass substrates” and “Mechanical alloying.”
For measurement-related topics, Indian papers covered “Atomic force microscopy,” “Transmission electron microscopy,” “Scanning electron microscopy,” and “Electron microscopy.” They also contained some experimental methods including “Molecular modeling,” “Aqueous solutions,” and “Sol–gel methods.” Meanwhile, under a particular effect, “Quantum effects,” different properties of the nanoparticles were discussed, such as “Magnetic properties,” “Optical properties,” “Mechanical properties,” and “Electrical properties.”
Fig. 8.
Content Map of SCI Papers (India), 1976–2007
Table 22.
Topics of SCI Papers (India), 1976–2007
| Rank | Region Label | # of papers in the region |
|---|---|---|
| 1 | Atomic force microscopy | 301 |
| 2 | Transmission electron microscopy | 270 |
| 3 | Particle sizes | 227 |
| 4 | Room temperature | 223 |
| 5 | Scanning electron microscopy | 186 |
| 6 | Carbon nanotubes | 132 |
| 7 | Magnetic properties | 123 |
| 8 | Optical properties | 115 |
| 9 | Gold nanoparticles | 113 |
| 10 | Average particle sizes | 107 |
| 11 | Glass substrates | 97 |
| 12 | Temperature ranges | 94 |
| 13 | Grain sizes | 88 |
| 14 | Molecular modeling | 84 |
| 15 | Crystallite sizes | 83 |
| 16 | Aqueous solutions | 83 |
| 17 | Silver nanoparticles | 81 |
| 18 | Different temperatures | 79 |
| 19 | Quantum dots | 76 |
| 20 | Mechanical properties | 71 |
| 21 | Sol–Gel methods | 66 |
| 22 | Electron microscopy | 62 |
| 23 | Electrical properties | 60 |
| 24 | Mu M | 59 |
| 25 | Sol–gel techniques | 59 |
| 26 | Mechanical alloying | 53 |
| 27 | Experimental results | 49 |
| 28 | High temperatures | 47 |
| 29 | Aqueous medium | 44 |
| 30 | Quantum effects | 36 |
| 31 | Binding energies | 31 |
One may notice that China, Russia, and India shared several important topics on nanomaterials, such as “Quantum dots” and “Carbon nanotubes.” These three countries also had common topics on measurement, such as “Atomic force microscopy” and “Scanning electron microscopy.” Overall, compared to China, Russia, and India both conducted more research on nano-device related topics.
Citation network analysis
We extracted and visualized the institution citation networks of papers to study knowledge diffusion patterns in the nanotechnology domain. We report the institution level citation network analysis on SCI papers (1976–2007). Due to data limitations, the patent citation networks did not provide statistically meaningful results, and are not reported here.
For visualization purposes, we extracted the top 100 links (according to the number of citations between the nodes) to create core citation networks. The core citation networks were visualized using the open source graph drawing software, Graphviz, provided by AT&T Labs (Gansner and North 2000). The direction of the links in the graphs represents the direction of the citations (i.e., a link from “institution A” to “institution B” means that institution A’s papers cited in institution B’s papers) and the number beside the link is the total number of these citations.
China institution citation network
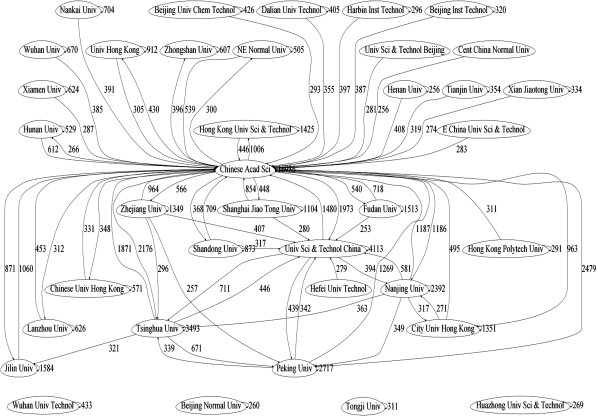
Figure 9 shows the core institution citation network for nanotechnology papers from 1976 to 2007 in China. In the network, CAS was the largest citation center. University of Science and Technology of China, Peking University, Tsinghua University, Nanjing University, Zhejiang University, and City University of Hong Kong were the secondary citation centers. University of Science and Technology of China, Peking University, Tsinghua University, City University of Hong Kong, Nanjing University, and surrounding institutions form a close citation cluster.
Fig. 9.
Institution citation network for SCI papers in China, 1976–2007
Russia institution citation network
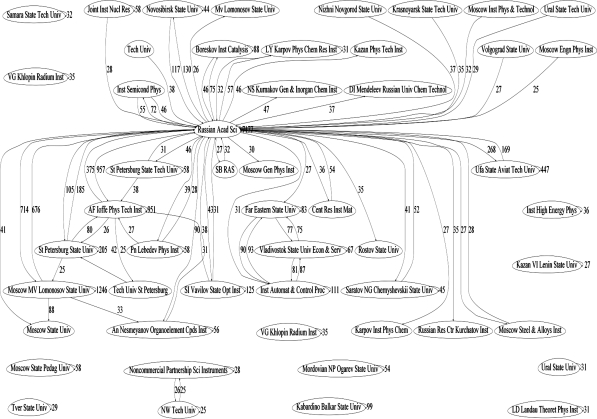
Figure 10 illustrates the core network for institutions in Russia. RAS was the largest citation center in the network. The other institutions in general had fewer citation relationships other than their connections to RAS. St. Petersburg State Technical University, A.F. Ioffe Physical Technical Institute, St Petersburg State University, Moscow M.V. Lemonsov State University, and their surroundings formed a small citation cluster.
Fig. 10.
Institution Citation Network for SCI papers in Russia, 1976–2007
India institution citation network
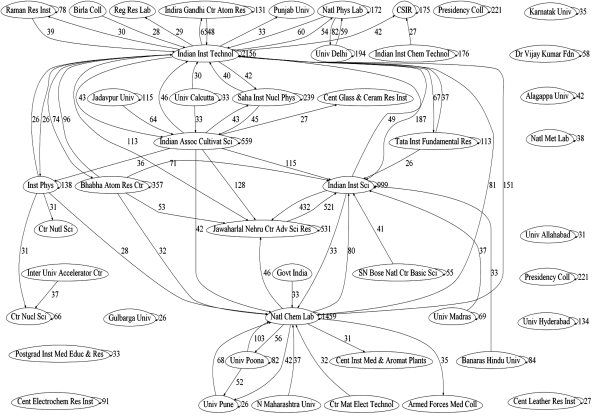
Figure 11 illustrates the core institution citation network for India. We found that IIT was the largest citation center. Secondary citation centers included the Indian Institute of Science, Bhabha Atomic Research Centre, Jawaharlal Nehru Centre for Advanced Scientific Research, Indian Association for the Cultivation of Science, Institute of Physics, and the National Chemistry Laboratory. These institutions form a cluster with close citations.
Fig. 11.
Institution Citation Network for SCI papers in India, 1976–2007
China and India had more citations between secondary citation centers than Russia. CAS, RAS, and IIT were the largest citation centers in the three countries, respectively, while they do not have the highest average citations per paper.
Conclusions and future work
In this paper, we conducted an analysis of nanotechnology R&D outcomes in China, Russia, and India using paper publications in the SCI database and patent publications in the USPTO. We applied bibliographic, content map, and citation network analyses to assess the productivity, impact, research topics, and knowledge diffusion patterns in the three countries’ nanotechnology research output. The main findings of this research include:
The number of SCI papers published by China (49,193 in the interval 1984–2007) highly exceeded those published by Russia (12,307 in the interval 1976–2007), and India (9,126 in the interval 1980–2007). All three countries showed a rapid increase in paper publications. From 2000 to 2007, China demonstrated an average growth rate of 31.43%, while Russia’s was 11.88%, and India’s was 33.51%. The patent publications exhibited less consistent patterns. However, the three countries were still able to achieve average growth rates in the interval 2000–2007 of 31.13, 10.41, and 5.96%, respectively.
In the three countries, most papers were published by universities and research institutions. In patent publications, private companies also played an important role.
The top journals that published nanotechnology papers of the three countries included both domestic journals and journals in the US and Netherlands. Compared with China and India, domestic journals in Russia played a more important role in publishing Russian nanotechnology papers.
In China and India, the paper publication rate of most of the top 10 productive institutes generally increased over time. However, in Russia most top institutions’ publication rates slowed down after 2000.
According to the number of citations, Chinese SCI papers and patents have the highest average number of citations (3.28 citations per paper, 0.73 citations per patent) among the three. In all three countries, the institutions with the largest output also tend to have a relatively larger number of citations per paper than the average. In the three countries’ institution citation networks, CAS, RAS, and IIT, which are the most productive institutions in the three countries, were also the largest citation centers.
Content map analysis shows that the three countries shared some common topics related to measurement, such as “Atomic force microscopy,” “Scanning electron microscopy” “Aqueous solutions,” as well as nanomaterials, such as “Quantum dots” and “Carbon nanotubes.” Compared with China, Russia, and India have conducted more research on nano-devices.
Acknowledgments
This research was supported by US National Science Foundation (NSF) grants CMMI-0549663 and CMMI-0533749 together with National Natural Science Foundation of China (NSFC) grants 70533030 and 70471085. The second last co-author was supported by the Directorate for Engineering, NSF. Any opinions, findings, and conclusions or recommendations expressed in this material are those of the authors and do not necessarily reflect the views of the funding agencies. The literature data was purchased from Thomson ISI and we thank them for their support of this research. We also thank the United States Patent and Trademark Office for making its database available for research.
Contributor Information
Xuan Liu, Email: amethyst@sjtu.edu.cn.
Pengzhu Zhang, Email: pzzhang@sjtu.edu.cn.
Xin Li, Email: xinli.is@acm.org.
Hsinchun Chen, Email: hchen@eller.arizona.edu.
Yan Dang, Email: ydang@eller.arizona.edu.
Catherine Larson, Email: cal@eller.arizona.edu.
Mihail C. Roco, Email: mroco@nsf.gov
Xianwen Wang, Email: wangxianwen2@gmail.com.
References
- Bhattacharya S, Nath P. Using patent statistics as a measure of “technological assertiveness”? A China–India comparison. Curr Sci. 2002;83(1):23–29. [Google Scholar]
- Bhattacharya S, Garg KC, Sharma SC, Dutt B. Indian patenting activity in international and domestic patent system: contemporary scenario. Curr Sci. 2007;92(10):1366. [Google Scholar]
- Borisova LF, Bogacheva NS, Markusova VA, Suetina EE. Bionanotechnology: a bibliometric analysis using science citation index database (1995–2006) Sci Tech Inf Process. 2007;34(4):212–218. doi: 10.3103/S0147688207040077. [DOI] [Google Scholar]
- Chen H, Roco MC. Mapping nanotechnology innovations and knowledge. New York, USA: Springer; 2009. p. 330. [Google Scholar]
- Chen H, Schuffels C, Orwig R. Internet categorization and search: a machine learning approach. J Vis Commun Image Represent Spec Issue Digit Libr. 1996;7(1):88–102. doi: 10.1006/jvci.1996.0008. [DOI] [Google Scholar]
- Gansner ER, North SC.An open graph visualization system and its applications to software engineering Softw Pract Exp 200030111203–1233.1147.68782 [DOI] [Google Scholar]
- Guan J, Ma N. China’s emerging presence in nanoscience and nanotechnology: a comparative bibliometric study of several nanoscience giants. Res Policy. 2007;36(6):880–886. doi: 10.1016/j.respol.2007.02.004. [DOI] [Google Scholar]
- Hassan MHA. Nanotechnology: small things and big changes in the developing world. Science. 2005;309(5731):65–66. doi: 10.1126/science.1111138. [DOI] [PubMed] [Google Scholar]
- Huang Z, Chen H, Chen Z, Roco MC. International nanotechnology development in 2003: country, institution, and technology field analysis based on USPTO patent database. J Nanopart Res. 2004;6(4):325–354. doi: 10.1007/s11051-004-4117-6. [DOI] [Google Scholar]
- Hullmann A. Measuring and assessing the development of nanotechnology. Scientometrics. 2007;70(3):739–758. doi: 10.1007/s11192-007-0310-6. [DOI] [Google Scholar]
- Kostoff RN, Murday JS, Lau CGY, Tolles WM. The seminal literature of nanotechnology research. J Nanopart Res. 2006;8(2):193–213. doi: 10.1007/s11051-005-9034-9. [DOI] [Google Scholar]
- Kostoff RN, Stump JA, Johnson D, Murday JS, Lau CGY, Tolles WM. The structure and infrastructure of the global nanotechnology literature. J Nanopart Res. 2006;8(3):301–321. doi: 10.1007/s11051-005-9035-8. [DOI] [Google Scholar]
- Kostoff RN, Briggs MB, Rushenberg RL, Bowles CA, Pecht M, Johnson D, Bhattacharya S, Icenhour AS, Nikodym K, Barth RB, Dodbele S. Comparisons of the structure and infrastructure of Chinese and Indian science and technology. Technol Forecast Soc Change. 2007;74(9):1609–1630. doi: 10.1016/j.techfore.2007.02.007. [DOI] [Google Scholar]
- Kostoff RN, Eriggs ME, Rushenberg RL, Eowles CA, Bhattacharya S, Johnson D, Icenhour AS, Nikodym K, Barth RB, Dodbele S, Pecht M. Assessment of science and technology literature of China and India as reflected in the SCI/SSCI. Curr Sci. 2007;93(8):1088. [Google Scholar]
- Kowalski TJ, Maschio A, Megerditchian SH. Dominating global intellectual property: Overview of patentability in the USA, Europe and Japan. J Commer Biotechnol. 2003;9(4):305–331. doi: 10.1057/palgrave.jcb.3040041. [DOI] [Google Scholar]
- Li X, Lin Y, Chen H, Roco MC. Worldwide nanotechnology development: a comparative study of USPTO, EPO, and JPO patents (1976–2004) J Nanopart Res. 2007;9(6):977–1002. doi: 10.1007/s11051-007-9273-z. [DOI] [Google Scholar]
- Li X, Chen H, Dang Y, Lin Y, Larson CA, Roco MC. A longitudinal analysis of nanotechnology literature: 1976–2004. J Nanopart Res. 2008;10:3–22. doi: 10.1007/s11051-008-9473-1. [DOI] [Google Scholar]
- Liu L, Zhang J. Characterising nanotechnology research in China. Sci Technol Soc. 2007;12(2):201. doi: 10.1177/097172180701200202. [DOI] [Google Scholar]
- Meyer MS. Patent citation analysis in a novel field of technology: an exploration of nano-science and nano-technology. Scientometrics. 2001;51(1):163–183. doi: 10.1023/A:1010572914033. [DOI] [Google Scholar]
- Ong TH, Chen H, Sung W, Zhu B. Newsmap: a knowledge map for online news. Decis Support Syst. 2005;39(4):583–597. doi: 10.1016/j.dss.2004.03.008. [DOI] [Google Scholar]
- Rajeswari AR. Indian patent statistics: an analysis. Scientometrics. 1996;36(1):109–130. doi: 10.1007/BF02126649. [DOI] [Google Scholar]
- Roco MC. International strategy for nanotechnology research. J Nanopart Res. 2001;3(5–6):353–360. doi: 10.1023/A:1013248621015. [DOI] [Google Scholar]
- Roco MC. National nanotechnology initiative: past, present, future. Handbook on nanoscience, engineering and technology. 2. Boca Raton, FL: Taylor and Francis; 2007. pp. 3.1–3.26. [Google Scholar]
- Sangeetha MA, Chakrabarti S, Amba S. Indian leather patents: an analysis. World Patent Inf. 1999;21(2):69–73. doi: 10.1016/S0172-2190(99)00040-X. [DOI] [Google Scholar]
- Shapira P, Wang J (2008) From lab to market? Strategies and issues in the commercialization of nanotechnology in China. Working Paper, April, Atlanta, GA, USA http://www.cherry.gatech.edu/PUBS/08/Nano-Commercialization-CN-20080403.pdf
- Tolle KM, Chen H. Comparing noun phrasing techniques for use with medical digital library tools. J Am Soc Inf Sci. 2000;51(4):518–522. doi: 10.1002/(SICI)1097-4571(2000)51:4<352::AID-ASI5>3.0.CO;2-8. [DOI] [Google Scholar]
- Tretyakov YD. Challenges of nanotechnological development in Russia and abroad. Herald Russ Acad Sci. 2007;77(1):15–21. doi: 10.1134/S1019331607010030. [DOI] [Google Scholar]
- Zhou P, Leydesdorff L. The emergence of China as a leading nation in science. Res Policy. 2006;35(1):83–104. doi: 10.1016/j.respol.2005.08.006. [DOI] [Google Scholar]


