Abstract
The ongoing global financial crisis, which began in 2007, has drawn attention to the effect of declining economic conditions on public health. A quantitative analysis of previous events can offer insights into the potential health effects of economic decline. In the early 1990s, widespread recession across Central and Eastern Europe accompanied the collapse of the Soviet Union. At the same time, despite previously falling tuberculosis (TB) incidence in most countries, there was an upsurge of TB cases and deaths throughout the region. Here, we study the quantitative relationship between the lost economic productivity and excess TB cases and mortality. We use the data of the World Health Organization for TB notifications and deaths from 1980 to 2006, and World Bank data for gross domestic product. Comparing 15 countries for which sufficient data exist, we find strong linear associations between the lost economic productivity over the period of recession for each country and excess numbers of TB cases (r2 = 0.94, p < 0.001) and deaths (r2 = 0.94, p < 0.001) over the same period. If TB epidemiology and control are linked to economies in 2009 as they were in 1991 then the Baltic states, particularly Latvia, are now vulnerable to another upturn in TB cases and deaths. These projections are in accordance with emerging data on drug consumption, which indicate that these countries have undergone the greatest reductions since the beginning of 2008. We recommend close surveillance and monitoring during the current recession, especially in the Baltic states.
Keywords: tuberculosis, public health, economic recession
1. Introduction
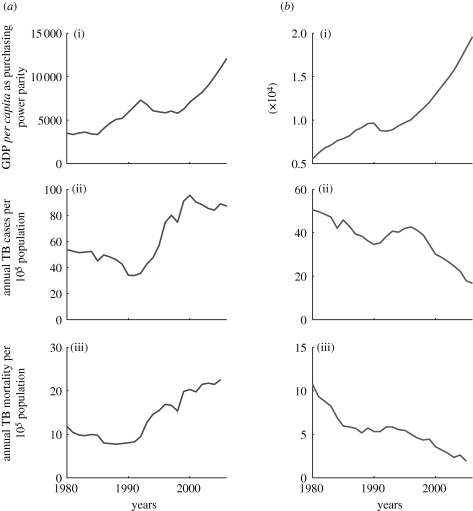
The collapse of the Soviet Union, which occurred during the latter half of the 1980s, caused great socioeconomic upheaval to countries in the region (Strayer 1998). Public health was no exception: despite falling tuberculosis (TB) cases and deaths in most Central and Eastern European (CEE) countries prior to 1990, the period following the collapse of the Soviet Union saw a considerable increase in incidence and mortality (figure 1). In some countries this loss of TB control persisted for many years (Shilova & Dye 2001; World Health Organization 2009b). Nonetheless, case finding and reporting of TB cases remained consistent for many Eastern European countries (World Health Organization 2009b), and so data from this region are amenable to an analysis of the changes in TB incidence that occurred during this period. Lessons learned from such an analysis could be relevant to the public health impact of the current financial crisis, which started in 2007 (Goodhart 2008), and have drawn attention to the effects of economic recession on public health (Levy & Sidel 2009; World Health Organization 2009a).
Figure 1.
Comparisons of GDP and TB impact for (a) Russia and (b) Hungary. Showing (i) GDP per capita, (ii) annual TB notifications and (iii) mortality from 1980 to 2006.
A host of socioeconomic processes are likely to have operated during the collapse of the Soviet Union to undermine TB control. On a basic level, however, these may be regarded as falling broadly into two categories: those concerning the functioning of state-run health services in this region, and those associated with the pathophysiology of TB infection. Although the Soviet era healthcare system attracted criticism owing to its systemic inefficiency and chronic neglect (Field & Twigg 2000; Coker et al. 2004), it oversaw decades of declining TB incidence following the Second World War (Raviglione et al. 1994; Perelman 2000). Two important elements of the state-funded TB control system were specialist TB hospitals, and TB dispensaries (Perelman 2000), the role of the latter being the ‘diagnosis, observation and assistance of all tuberculosis victims, actual and potential’ (Lahusen & Solomon 2008) in respective districts. The collapse of such centrally controlled programmes would clearly have had an impact on the detection and management of TB in the community: for example, severe drug shortages arose across Central and Eastern Europe from interruptions in supply chains (Zolotova 2007) and lack of funds (Zalesky et al. 1999), and it is possible that these also led to delays between diagnosis and treatment. In Russia, such effects manifested through increasing rates of progression to active disease, and increasing case fatality rates (Shilova & Dye 2001). There were other upheavals in healthcare provision: while centralized government fragmented, for example, reformers started radical changes to healthcare systems including switching to health insurance, introducing general practice and a growing use of out-of-pocket payments (Rechel & McKee 2009).
On the other hand, several factors arising from a general decline in social conditions and living standards can also increase individual susceptibility to infection and progression to active disease. There is evidence to link unemployment and financial insecurity with risk of pulmonary TB in Russia (Coker et al. 2005), while studies elsewhere have highlighted the role of alcoholism (Lönnroth et al. 2008), malnutrition (Cegielski & McMurray 2004), crowded housing (Canadian Tuberculosis Committee 2007) and smoking (Lin et al. 2007; Slama et al. 2007). In the wider context of health, hazardous alcohol consumption (Leon et al. 2007) and poor nutrition (McKee & Shkolnikov 2001) have also been linked to adverse health outcomes in Russia and other countries in Eastern Europe. Although the impact of psychological factors is notoriously difficult to measure, some studies are suggestive of the role of stress in susceptibility to TB infection and reactivation (Comstock 2000).
On a macro-level, all of these factors are likely to have acted in combination. In particular, previous studies have highlighted specific processes at the national level that were significantly associated with TB outcomes, including structural adjustment programmes (Stuckler et al. 2008b), war (Keshavjee & Becerra 2000) and imprisonment (Stuckler et al. 2008a).
Notwithstanding such complexities, however, aggregate indicators such as gross domestic product (GDP) have also shown significance for TB outcomes in this region. Strong associations have been found between incidence rates and changes in GDP over a certain interval (Stuckler et al. 2008b), and between incidence rates and absolute levels of GDP (Stuckler et al. 2008a; Dye et al. 2009). Here, we develop this work to focus on the effects arising from a major recession, in particular the dynamics of recession. The novelty of our work is an approach that not only measures changes in GDP, but also attempts to quantify the lost economic productivity during a recession and the TB impacts thereof. Our approach reveals stronger associations than those found hitherto. Further, we demonstrate potential applications to the current financial crisis. The real applicability of our results depends on the comparability of the underlying processes, from one recession to another, and accordingly we discuss important questions arising for future research.
2. Overview of the data
We use national data for incidence of new TB cases (of all forms) and deaths attributed to TB in Central and Eastern Europe, from 1980 to 2007. This is drawn from the World Health Organization (WHO) Global TB database, which consists of data submitted annually to the WHO, in the form of new notified cases and deaths. Mortality rates are unweighted sums over all age groups. A list of countries considered for inclusion is given in the electronic supplementary material. To express these as rates per 100 000 of the population, we use population data from the United Nations Statistics Division (United Nations Statistics Division 2009). As a measure of macro-economic conditions, we use World Bank estimates for GDP per capita, also available from UNSD, expressed as purchasing power parity (PPP) in international dollars to better enable comparison between countries. For three countries (the Czech Republic, Poland and Russia), however, this source has data only from 1990. The International Monetary Fund (International Monetary Fund 2009) provides GDP data from 1980 onwards, and so we use the IMF figures for these countries only. As shown in the electronic supplementary material, figure S1, in overlapping periods the two GDP data sources are, for practical purposes, identical.
Data for TB incidence and mortality are available for all of the 26 CEE countries. From these are selected the 15 countries for which GDP data are available for a period of at least 4 years prior to 1990. This period allows us to find pre-recession GDP trends, which are relevant for the analysis to follow. The 15 selected countries, along with plots of GDP and TB data for the Czech Republic, Poland and Russia are given in the electronic supplementary material, table S1.
Figure 1 shows GDP, annual incidence and annual mortality for two examples—Hungary and Russia. Before 1990 both countries had declining TB incidence, by an average of about 4% yr−1. The economic shock experienced by both is apparent in the early 1990s. At the same time, there was a marked resurgence in TB incidence and deaths. After contracting by 6 per cent, Hungary's economy recovered by 1996, by which time TB was also under control again. In contrast, Russia suffered a deeper and longer downturn, with its economy contracting by 14 per cent at its lowest point. Meanwhile, TB incidence for Russia showed a rising trend until 2000.
3. Methods: statistical analysis
Motivated by the literature on how recessions should be reliably dated (Hamilton 1989; Stock & Watson 1991; Anas et al. 2008), we introduce some terminology to help describe GDP curves in the discussion to follow. The point of shock is where the GDP downturn begins, and for all countries this occurred in the early 1990s. Recession is the subsequent period over which GDP declines. Such terminology is so far consistent, for example, with the scheme used by the National Bureau of Economic Research (National Bureau of Economic Research 2003). Regarding economic recovery, note that the NBER framework, being relevant for regular business cycles, defines the period of ‘expansion’ as the intervening period of economic growth between successive recessions. Here, however, our emphasis is on singular and major economic events such as the Soviet Union collapse, which are not subject to such intrinsic cyclicality. For our purposes it is therefore convenient to refer to the recovery interval as the period of increasing GDP, ending at the point at which GDP reaches its pre-shock level again.
Finally, we refer to the full period between shock and the end of recovery as the recession/recovery interval.
We concentrate first on the relationship between GDP and TB incidence. Intuitively, we may expect a positive relationship between the economic productivity lost during a recession and the number of excess TB cases occurring during that time. However, there is a host of possible ways of measuring either of these quantities. Here, we present results from four selected approaches, along with some variants. Results from other approaches are given in the electronic supplementary material. To take the example of GDP, we write t for time in years. Given the per capita data Gd(t) and a projection Gp(t) of what may have occurred in the absence of shock, an expression for lost economic productivity over the period from time t0 to t1 is
 |
that is, the sum of the differences between projected and actual values of GDP, over the interval t0 to t1. A directly analogous expression holds for numbers of excess cases. This expression highlights two main choices: first, how to project GDP to obtain Gp(t), and, second, how to choose the relevant interval, t0 to t1.
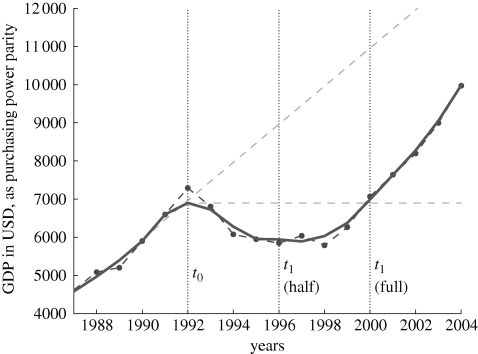
A moving average is first applied to the data as an aid to the analysis. As illustrated in figure 2, we compare ‘linear’ projections, which arise from a straight-line fit of the GDP and incidence data in the 3 years prior to the economic shock, and ‘flat’ projections, which use a constant value of GDP and incidence at the time of shock. To systematically avoid artificial bias owing to the shape of the GDP curve, we select those three points showing the greatest absolute gradient. In the majority of cases, this scheme selects the three data points up to and including the point of economic shock. However, in the examples of Georgia and Russia, GDP curves show distinct, multiple stages. Taken together, these introduce artefacts into the projections, and our scheme avoids these. Regarding the relevant interval, we fix t0 to be the time of economic shock and select t1 from the endpoint of recession and the endpoint of recovery. To begin with, we take identical intervals for GDP and incidence. Other approaches may include, for example, taking t1 to be a fixed number of years after t0 across all countries, and this will also be discussed.
Figure 2.
Choices of method in calculating GDP losses and excess TB cases and mortality. Shown on a GDP plot from Russia for illustration. The horizontal and sloping dashed lines denote, respectively, the ‘flat’ and ‘linear’ projections described in the text. Vertical dotted lines indicate possible time intervals. Calculations for excess TB cases and mortality follow the same scheme. Dashed line with circles, raw data; continuous line, smoothed data.
Further, there are several possible regression models for the relationship between the lost economic productivity and TB impact, as illustrated schematically in the electronic supplementary material, figure S2. Therefore, to motivate the choice of appropriate regression model, we first present scatter plots obtained under different measures as described above. A possible complication is that certain subgroups could show differing behaviours: for example, countries of the Former Soviet Union (FSU) arguably suffered greater socioeconomic upheaval than Central European countries (Millar & Wolchik 1994). It is possible that these countries exhibit a different response to economic losses from the Central European countries. Moreover, we may expect regression models to pass through the origin (see electronic supplementary material, figure S2), implying zero TB impact associated with zero GDP loss. Equivalently, we may expect the constant term (y-axis intercept) in the correlation to be zero. However, to allow for the possibility of, for example, a shock being absorbed elsewhere in the national economy, so that there is no manifest effect on the macro-economy but some effect on TB (or vice versa), we incorporate the constant term in the estimation.
4. Results
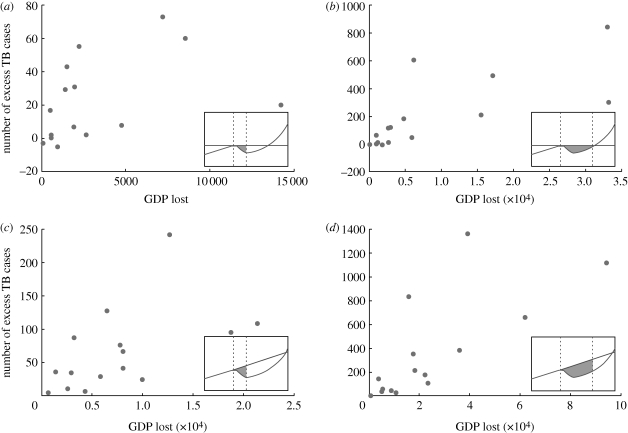
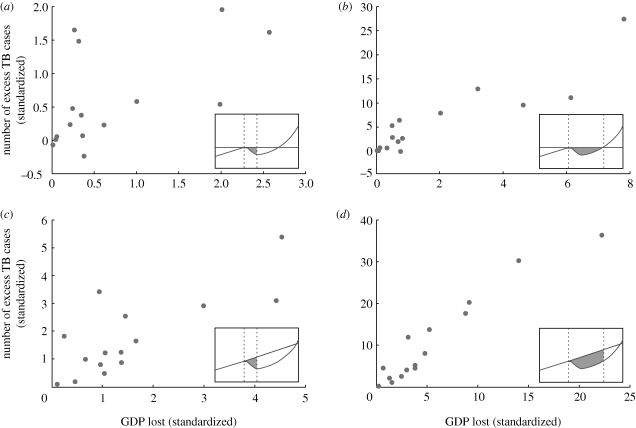
Figure 3 shows scatter plots obtained when taking different measures of GDP loss and excess TB cases, as described above. For reference, insets illustrate the area being considered on a GDP curve. For instance, figure 3a presents scatter plots when measuring GDP loss and excess TB over the interval of recession only, and using a flat projection as described in the previous section. By contrast, figure 3d uses the whole recession/recovery interval, as well as a linear projection. In each case, excess TB is calculated following the same scheme as GDP loss. In all plots, there is a sign of some positive association, but the association is weak. However, these plots are confounded by variation between countries in absolute levels of GDP, and in levels of TB infection. For example, they do not account for the fact that, for two countries experiencing the same economic loss in absolute terms, the country with the higher GDP is likely to suffer proportionately less impact. This is dealt with by ‘standardizing’ data in the following way. For each country, calculated GDP losses are divided by the value of GDP at the time of shock, and, likewise, calculated excess TB cases are divided by the incidence reported at the time of shock. Resulting scatter plots are shown in figure 4, and illustrate a clear improvement in the association between GDP loss and excess TB, particularly where the interval is the full recession/recovery period (figure 3b,d). Plots for both types of projection suggest a linear relationship between GDP loss and TB gain, and a linear least-squares regression analysis yields correlations of r2 = 0.83 (p < 0.001) and r2 = 0.94 (p < 0.001) for the ‘flat’ (figure 3b) and ‘linear’ (figure 3d) projections, respectively.
Figure 3.
Scatter plots of GDP loss versus excess TB cases for different methods of measuring these quantities. Methods are as indicated by shaded areas on schematic GDP plots in the insets. For example, (a) corresponds to a scheme in which GDP loss is calculated as the difference between actual GDP and a ‘flat’ projection for GDP (described in the main text), summed over the period of economic recession. By contrast, (c) involves a linear projection for GDP. Economic loss and excess TB are calculated using the same scheme.
Figure 4.
Scatter plots of standardized GDP loss versus excess TB cases for different methods of measuring these quantities. Methods are as indicated by shaded areas on schematic GDP plots in the insets; see figure 3 caption for further information. Both quantities are again calculated using the same scheme, but are now standardized by dividing with the respective values attained at the time of economic shock.
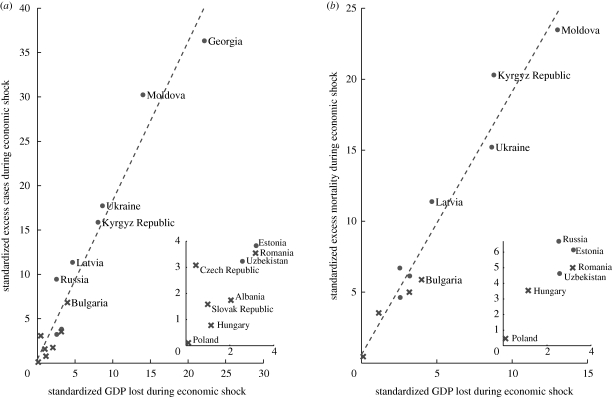
Figure 5a reproduces figure 4d, i.e. taking linear projections over the full recession/recovery window, with the FSU countries indicated by filled circles. As might be expected, the FSU countries suffered greater economic impact and correspondingly greater numbers of excess TB cases. Formally, however, both groups appear to follow the same regression (see appendix A).
Figure 5.
GDP losses versus (a) excess TB r2 = 0.94347 and (b) mortality r2 = 0.94497, when standardized. Non-FSU countries are indicated with crosses. Inset shows a close-up of countries near the origin of the main plot. GDP loss and excess TB are calculated using a linear projection, as described in figure 3d.
Figure 5b shows the association between GDP loss and excess mortality, using the same scheme as for figure 5a. This plot is populated by fewer points, as only 11 countries had sufficient mortality data for linear projections to be made. Nonetheless, there is again evidence of a strong linear association, with r2 = 0.94 (p < 0.001).
Parameter estimates for the slope and intercept of the associations in figure 5a,b are given in tables 1 and 2. The confidence intervals on the intercept demonstrate that, at the 5 per cent significance level, there is insufficient evidence for a non-zero intercept. Thus, we have the following approximate relationship:
 |
with a similar expression holding for excess mortality, also with a factor of 2. Precise values for the coefficient in the above expression are also given in tables 1 and 2. The fractional term on the right-hand side of this expression could be regarded as a country-specific factor, denoting the extent to which the existing levels of TB and GDP can amplify or mitigate the impact of an economic shock. For example, in Bulgaria, economic shock occurred in 1989. TB incidence and GDP in that year were 32.2 cases per 100 000, and 8001 USD, respectively, giving a value of 0.008 for the term on the right-hand side of the expression above. During the recession, lost GDP was over 37 000 USD. Multiplying this by the ‘country-specific’ factor of 0.008 found above gives 300 excess cases per 100 000 population, in broad agreement with the actual figure of 366. It is also straightforward to express these results in terms of the population attributable fraction (PAF), as described in appendix A.
Table 1.
Regression parameters for GDP loss versus excess TB cases (figure 5a). Where the intercept is constrained to be zero, owing to the ambiguity of r2 for such models, we report only the slope estimate.
| all countries | FSU countries | non-FSU countries | |
|---|---|---|---|
| r2 | 0.94 | 0.93 | 0.67 |
| number of countries | 15 | 8 | 7 |
| slope, point estimate | 1.79 | 1.68 | 1.3 |
| slope, 95% CI | (1.53, 2.05) | (1.23, 2.13) | (0.24, 2.31) |
| intercept, point estimate | 0.43 | 2.21 | 0.35 |
| intercept, 95% CI | (−1.61, 2.47) | (−2.48, 6.90) | (−1.88, 2.58) |
| slope with zero intercept, point estimate | 1.84 | 1.84 | 1.40 |
| slope with zero intercept, 95% CI | (1.64, 2.02) | (1.57, 2.12) | (0.84, 1.97) |
Table 2.
Regression parameters for GDP loss versus excess TB mortality (figure 5b).
| all countries | FSU countries | non-FSU countries | |
|---|---|---|---|
| r2 | 0.95 | 0.94 | 0.90 |
| number of countries | 11 | 7 | 4 |
| slope, point estimate | 1.85 | 1.78 | 1.26 |
| slope, 95% CI | (1.51, 2.19) | (1.25, 2.30) | (−0.0049, 2.53) |
| intercept, point estimate | 0.61 | 1.52 | 1.06 |
| intercept, 95% CI | (−1.41, 2.62) | (−2.29, 5.33) | (−2.25, 4.37) |
| slope with zero intercept, point estimate | 1.93 | 1.96 | 1.60 |
| slope with zero intercept, 95% CI | (1.73, 2.13) | (1.70, 2.22) | (0.96, 2.22) |
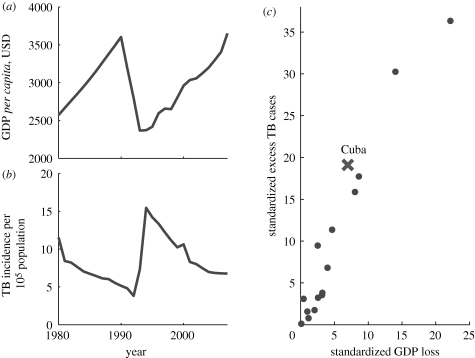
While connections between macro-economy and TB clearly differ in other regions of the world, it is also of interest to note that the effects of Soviet Union collapse were not confined to Central and Eastern Europe. A noteworthy example is Cuba, a socialist Caribbean country with centralized healthcare. In the 1990s, Cuba suffered a recession, accompanied by a nutritional crisis, due in part to close economic ties with the Soviet Union (Nayeri 1995; Wills 2003). As shown in figure 6a,b, GDP and TB incidence in Cuba showed similar behaviour to that of CEE countries during the collapse of the Soviet Union. Figure 6c shows the placement of Cuba on the scatter plot of excess TB cases versus GDP loss. It is broadly consistent with the linear regression found above: re-evaluating this regression with the inclusion of Cuba yields a correlation with r2 = 0.92.
Figure 6.
A comparison of Cuba with CEE countries. Data for (a) GDP and (b) TB incidence during the collapse of the Soviet Union, exhibiting patterns qualitatively similar to CEE countries, are shown. (c) The placement of Cuba on the scatter plot of excess TB versus GDP loss. Re-evaluating correlation with the inclusion of Cuba, constrained at the origin, yields r2 = 0.92 and an estimated slope of 1.87 (95% CI 1.67, 2.08).
Returning to the CEE data, we ask why there is a comparatively poor association when evaluating effects only over the period of recession, prior to recovery (figure 4a,c). A perhaps counterintuitive property of the data is that the bulk of GDP loss and excess TB cases occur in the recovery phase: on average, respectively, 62 per cent and 72 per cent. This is partly due to the asymmetry of the recession/recovery interval, with the latter phase being longer than the former. A practical implication is that, even once an economy starts to recover following an economic shock, TB control efforts may continue to be challenged for several years.
Based on figure 5, we also consider the effect of taking different intervals for GDP and for TB. For example, on the basis that TB infection dynamics could show a delayed response to the stimulus of the recession, we may choose the TB interval to exceed the GDP interval by a fixed amount. However, in the electronic supplementary material, figure S3 shows that greatest values of r2 are attained when the TB interval coincides with the GDP interval. Scatter plots yielding these coefficients are given in the electronic supplementary material, figure S4, and illustrate the increasing spread of the data when taking increasing intervals. In summary, the association between lost GDP and excess TB deteriorates when taken on time scales longer than the recession and recovery. In the electronic supplementary material, figure S5 shows scatter plots obtained for yet another scheme for the GDP and TB intervals, that is, where both start at the point of economic shock and extend for a fixed number of years, for all countries. Again, the associations displayed by this method are not as strong as that shown in figure 5.
Finally with these data, we compare excess mortality and excess cases. We once again find evidence of a strong linear association, with r2 = 0.92 and estimated slope 0.95 (electronic supplementary material, figure S6). Preliminary mathematical modelling, described in more detail in the electronic supplementary material, suggests that this slope cannot be explained by increasing transmission alone, and requires a concomitant increase in the case fatality rate during the economic recession. Essentially this is because, when fitted to pre-1990 Russian incidence data, the model suggests that the average period between TB infection and TB mortality has a longer time scale than the recession/recovery interval, and so not all excess cases would have been ‘resolved’, whether by death or recovery, over the duration of this interval. In §6 below, we consider the potential implications of this analysis, for the mechanisms of connection between economic conditions and TB control.
5. The 2008 financial crisis
What do these results suggest in the context of the current financial crisis? If connections between the economy and TB control are similar to those in the 1990s, then we may again expect excess cases and deaths in Eastern European countries undergoing economic contraction.
First, however, we make some important caveats. There are evidently substantial differences between the present financial crisis and the collapse of the Soviet Union. In 2007, financial contagion was rapidly disseminated worldwide by a globally connected financial system, with far-reaching implications on national economies. However, the collapse of the Soviet Union was attended by processes not directly caused by shocks to GDP. Examples mentioned in the introduction include aggressive healthcare reform, together with war, structural adjustment programmes and so on. Such changes clearly had a strong effect on the control of TB, and are not necessarily reproduced in the current crisis.
On the other hand, we also acknowledge similarities on a fundamental level between the two major recessions. To take the example of Latvia, reforms after 1997 restored the control of healthcare financing to central government (European Observatory on Healthcare Systems 2001), echoing the centralization of healthcare provision present in the early part of that decade. Second, in the 1990s the economies of countries in Central and Eastern Europe were clearly highly exposed to Soviet collapse. Correspondingly, in recent years, a booming housing market, a reliance on commodity exports to the EU and high consumer demand, fuelled by foreign credit, rendered several national economies highly exposed to global financial markets (Cordero 2009).
Latvia is already among the hardest hit of all CEE countries, with IMF projections seeing GDP falling by over 15 per cent in 2009 (IMF Survey 2009). It is, nonetheless, instructive to put these economic events in context: although often quoted as the most serious financial crisis since the Great Depression of the 1930s, in the current recession expected losses in economic productivity for CEE countries are only a fraction of those suffered in the 1990s.
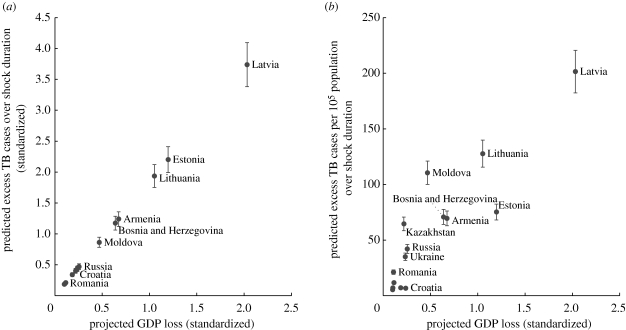
Using projections for GDP per capita made to 2014 in the World Economic Outlook (International Monetary Fund 2009), we can forecast the excess burden of tuberculosis that could emerge during the course of the current crisis. We follow the same approach as described above, and as illustrated in the electronic supplementary material, figure S7. Data for incidence from 2005 onwards are used to make a linear projection of TB incidence for the IMF-predicted course of the economic shock, while standardizing values for GDP loss and excess TB cases/mortality are taken as those at the start of the economic downturn. Figure 7 shows results from this method, assuming a multiplicative factor of 1.84 between GDP loss and excess cases/mortality, taken from table 1. Even in terms of absolute numbers of cases, rather than comparative to pre-shock levels of incidence, the Baltic states (Latvia, Lithuania and Estonia) are prominent in their projected excess burden of TB.
Figure 7.
Projected excess numbers of TB cases in current financial crisis, using IMF outlook, with selected countries labelled. (a) Predicted excess TB cases, standardized. (b) Absolute numbers obtained by multiplying with levels of TB incidence in each country. Error bars arise from the 95% CIs given in table 1 of the main text.
This projection is in accordance with emerging data on drug consumption. Data available from the WHO (IMS Health 2009) express consumption of all drugs in the second quarter of 2009 as a ratio of that in the first quarter of 2008, for 58 countries worldwide. Of all countries in this set, Lithuania, Estonia and Latvia show the greatest reductions, of 13 per cent, 21 per cent and 27 per cent, respectively (electronic supplementary material, figure S8). Further, six of the countries in this dataset are also present in the projections in figure 7. Ranked in the order of decreasing drug consumption, these are: Croatia, Bulgaria, Hungary, Lithuania, Estonia and Latvia. This agrees closely with the ranking in the increasing order of projected GDP loss in figure 7, namely: Bulgaria, Croatia, Hungary, Lithuania, Estonia and Latvia. Similar patterns emerge when filtering drug consumption by acute or chronic indication.
6. Discussion and conclusion
There exists a diverse literature on relationships between the economy and health in the broadest sense (Ruhm 2000; Bezruchka 2009; Stuckler et al. 2009). A key message of our work is that traditional ‘level and change’ approaches may not always provide the best indicators for measuring the effects of macro-economic conditions, depending on the context being studied. In this work, we perform a careful study of different indicators relevant to the specific case of TB in Central and Eastern Europe, ultimately presenting evidence of a strong, linear relationship between economic losses in a major recession and TB impact.
It is of interest to note the distinction between the FSU and other countries, indicated in figure 5. While all countries underwent great economic and political upheaval, FSU countries faced unique challenges; for example, the reconstitution of the highly centralized health system on the national level of the newly independent states (Strayer 1998). As might be expected, therefore, in general FSU countries suffered greater economic losses and greater excess TB cases. Nonetheless, despite such fundamental differences, it is of interest to note that all countries appear to lie on the same line. Thus, the data suggest that, whatever the mechanisms of connection between economic loss and TB impact in FSU and non-FSU countries, epidemiologically these groups varied only in the magnitude of impact.
With regard to the current crisis, while there are clearly important differences from Soviet Union collapse, we argue that there also exist relevant comparisons. If the association between GDP and TB impact is indeed still valid in the present day, we have demonstrated how such a simple methodology may be used for identifying countries most at risk. Several possibilities for further work arise from our results. First, an important question is the exact pathway for our GDP–TB association: a preliminary mathematical model, presented in the electronic supplementary material, was developed to test the compatibility of the GDP–TB association with the ‘service failure’ and ‘increased susceptibility’ processes described in §1. Future work may seek to elucidate these, and further clarify under what conditions our results may be applied. Second, a valuable follow-up to this work would be a retrospective analysis, following resolution of the current crisis, of actual GDP–TB associations in Central and Eastern Europe, using the method we have described here. Third, in this work we have only demonstrated one way of measuring GDP loss and excess TB, and indeed several others may exist, yielding similarly strong associations. Future work may seek to explore these, perhaps incorporating different measures of GDP used in the current economics literature, as well as a systematic treatment of lagged effects.
In closing, we note that the strong associations demonstrated here do not necessarily translate to other regions of the world. In a recent study of more general determinants of TB incidence, including immigration and development indicators, CEE countries were prominent in the significance of macro-economic conditions (Dye et al. 2009). Moreover, we do not discuss here the potential role of drug resistance: while much is still unknown about the extent to which the spread of resistance was promoted by socioeconomic upheaval in the 1980s, in the present day it is a serious challenge for control of TB in countries of the former Soviet Union (Wright et al. 2009). While these and other factors may well have operated, we believe nonetheless that the striking prominence of the association between economic losses and excess TB cases bears mention. Further, with this year seeing the 20th anniversary of the collapse of the Soviet Union, lessons from that period may still be valuable in monitoring TB today. Our work highlights the Baltic states as being most vulnerable to an upsurge of TB cases, a projection that appears to be in accordance with emerging patterns of declining drug consumption in these countries. We suggest that, while financial crises may be inevitable, or indeed unforeseeable, their adverse effects on health need not be. In particular, these effects could be effectively mitigated by increased surveillance and monitoring, focused on those countries or regions predicted to be most at risk.
Acknowledgements
N.A. gratefully acknowledges financial support for this work from the James Martin 21st Century School at the University of Oxford. C.D. is a staff member of the World Health Organization. The authors alone are responsible for the views expressed in this publication, which do not necessarily represent the decisions, policy or views of WHO.
Appendix A
A.1. Testing for significance in difference between FSU and non-FSU countries
We pose a ‘full model’ incorporating different coefficients for FSU and CEE countries,
Here i = 0, 1 for non-FSU and FSU countries, respectively. Formally, we test simultaneously the significance of β2 and β3. The data yield an F-value of 0.46, which is compared with F2,11 to give a p-value of 0.42. There is therefore insufficient evidence, at the 1 per cent level, to reject the null hypothesis that β2 = β3 = 0.
A.2. Derivation of PAF
The PAF is the proportion of cases during the recession/recovery interval attributable to the economic shock. If we write In, Ip and G for the total number of cases notified, the total projected number of cases and the total GDP loss, respectively, all standardized and taken over the recession/recovery interval, then, by definition, P = (In−Ip)/In. Further, according to the regression in figure 5, we have In−Ip = kG, for a constant k. Substituting the latter expression into the former, we find
Values for PAF range from 0.04, for Poland, to 0.82, for Moldova. Among countries with intermediate values are Estonia and Bulgaria, with PAFs of 0.38 and 0.46, respectively. Having the practical value of compactly quantifying the ‘risk’ faced by a country undergoing recession, this expression indicates the dual role of economic losses and background levels of TB (the latter being represented by the term P).
References
- Anas J., Billio M., Ferrara L., Mazzi G. L. 2008. A system for dating and detecting turning points in the Euro area. Manchester School 76, 549–577. ( 10.1111/j.1467-9957.2008.01076.x) [DOI] [Google Scholar]
- Bezruchka S. 2009. The effect of economic recession on population health. CMAJ 181, 281–285. ( 10.1503/cmaj.090553) [DOI] [PMC free article] [PubMed] [Google Scholar]
- Canadian Tuberculosis Committee. 2007. Housing conditions that serve as risk factors for tuberculosis infection and disease. Can. Commun. Dis. Rep. 33, 1–13. [PubMed] [Google Scholar]
- Cegielski J. P., McMurray D. N. 2004. The relationship between malnutrition and tuberculosis: evidence from studies in humans and experimental animals. Int. J. Tuberc. Lung Dis. 8, 286–298. [PubMed] [Google Scholar]
- Coker R. J., Atun R. A., McKee M. 2004. Health-care system frailties and public health control of communicable disease on the European Union's new eastern border. Lancet 363, 1389–1392. ( 10.1016/S0140-6736(04)16053-4) [DOI] [PubMed] [Google Scholar]
- Coker R., McKee M., Atun R., Dimitrova B., Dodonova E., Kuznetsov S., Drobniewski F. 2005. Risk factors for pulmonary tuberculosis in Russia: case–control study. Br. Med. J. 332, 85–87. ( 10.1136/bmj.38684.687940.80) [DOI] [PMC free article] [PubMed] [Google Scholar]
- Comstock G. W. 2000. Epidemiology of tuberculosis. In Tuberculosis, a comprehensive international report (eds Reichmann L. B., Hershfield E. S.), pp. 129–156. New York, NY: Marcel Dekker. [Google Scholar]
- Cordero J. A. 2009. The IMF's stand-by arrangements and the economic downturn in eastern Europe. See http://www.cepr.net/documents/publications/imf-2009-09.pdf (accessed 1 February 2010). [Google Scholar]
- Dye C., Lonnroth K., Jaramillo E., Williams B. G., Raviglione M. 2009. Trends in tuberculosis and their determinants in 134 countries. Bull. World Health Org. 87, 683–691. ( 10.2471/BLT.08.058453) [DOI] [PMC free article] [PubMed] [Google Scholar]
- European Observatory on Healthcare Systems. 2001. Health care systems in transition. Latvia: See http://www.euro.who.int/document/e72467.pdf (accessed 1 February 2010). [Google Scholar]
- Field M. G., Twigg J. L. (eds) 2000. Russia's torn safety nets: health and social welfare during the transition. New York, NY: St. Martin's Press. [Google Scholar]
- Goodhart C. A. E. 2008. The background to the 2007 financial crisis. Int. Econ. Econ. Policy 4, 331–346. ( 10.1007/s10368-007-0098-0) [DOI] [Google Scholar]
- Hamilton J. D. 1989. A new approach to the economic analysis of nonstationary time series and the business cycle. Econometrica 57, 357–384. ( 10.2307/1912559) [DOI] [Google Scholar]
- IMF Survey. 2009. Latvia caught in vicious economic downturn. See http://www.imf.org/external/pubs/ft/survey/so/2009/car052809a.htm (accessed 8 August 2009). [Google Scholar]
- IMS Health. 2009. Indicators for tracking the effect of the economic crisis on pharmaceutical consumption, Geneva, Switzerland: Unpublished report submitted to WHO. [Google Scholar]
- International Monetary Fund. 2009. World economic outlook database. See http://www.imf.org/external/pubs/ft/weo/2009/01/weodata/index.aspx (accessed 8 August 2009). [Google Scholar]
- Keshavjee S., Becerra M. C. 2000. Disintegrating health services and resurgent tuberculosis in post-Soviet Tajikistan: an example of structural violence. JAMA 283, 1201 ( 10.1001/jama.283.9.1201) [DOI] [PubMed] [Google Scholar]
- Lahusen T., Solomon P. 2008. What is Soviet now? Identities, legacies, memories. Berlin, Germany: Lit Verlag. [Google Scholar]
- Leon D. A., Saburova L., Tomkins S., Andreev E., Kiryanov N., McKee M., Shkolnikov V. M. 2007. Hazardous alcohol drinking and premature mortality in Russia: a population based case-control study. Lancet 369, 2001–2009. ( 10.1016/S0140-6736(07)60941-6) [DOI] [PubMed] [Google Scholar]
- Levy B. S., Sidel V. W. 2009. The economic crisis and public health. Social Med. 4, 82–87. [Google Scholar]
- Lin H. H., Ezzati M., Murray M. 2007. Tobacco smoke, indoor air pollution and tuberculosis: a systematic review and meta-analysis. PLoS Med. 4, e20 ( 10.1371/journal.pmed.0040020) [DOI] [PMC free article] [PubMed] [Google Scholar]
- Lönnroth K., Williams B. G., Stadlin S., Jaramillo E., Dye C. 2008. Alcohol use as a risk factor for tuberculosis: a systematic review. BMC Publ. Health 8, 289 ( 10.1186/1471-2458-8-289) [DOI] [PMC free article] [PubMed] [Google Scholar]
- McKee M., Shkolnikov V. 2001. Understanding the toll of premature death among men in eastern Europe. Br. Med. J. 323, 1051–1055. ( 10.1136/bmj.323.7320.1051) [DOI] [PMC free article] [PubMed] [Google Scholar]
- Millar J. E., Wolchik S. E. 1994. The social legacy of communism. Cambridge, UK: Cambridge University Press. [Google Scholar]
- National Bureau of Economic Research. 2003. The NBER's recession dating procedure. See http://www.nber.org/cycles/recessions.html (accessed 1 February 2010). [Google Scholar]
- Nayeri K. 1995. The Cuban health care system and factors currently undermining it. J. Community Health 20, 321–334. ( 10.1007/BF02283057) [DOI] [PubMed] [Google Scholar]
- Perelman M. I. 2000. Tuberculosis in Russia. Int. J. Tuberc. Lung Dis. 4, 1097–1103. [PubMed] [Google Scholar]
- Raviglione M. C., Rieder H. L., Styblo K., Khomenko A. G., Esteves K., Kochi A. 1994. Tuberculosis trends in eastern Europe and the former USSR. Tuber. Lung Dis. 75, 400–416. ( 10.1016/0962-8479(94)90113-9) [DOI] [PubMed] [Google Scholar]
- Rechel B., McKee M. 2009. Health reform in Central and Eastern Europe and the former Soviet Union. Lancet 374, 1186–1195. ( 10.1016/S0140-6736(09)61334-9) [DOI] [PubMed] [Google Scholar]
- Ruhm C. J. 2000. Are recessions good for your health? Q. J. Econ. 115, 617–650. ( 10.1162/003355300554872) [DOI] [Google Scholar]
- Shilova M. V., Dye C. 2001. The resurgence of tuberculosis in Russia. Phil. Trans. R. Soc. Lond. B 356, 1069–1075. ( 10.1098/rstb.2001.0895) [DOI] [PMC free article] [PubMed] [Google Scholar]
- Slama K., Chiang C. Y., Enarson D. A., Hassmiller K., Fanning A., Gupta P., Ray C. 2007. Tobacco and tuberculosis: a qualitative systematic review and meta-analysis. Int. J. Tuberc. Lung Dis. 11, 1049–1061. [PubMed] [Google Scholar]
- Stock J. H., Watson M. W. 1991. Business cycles, indicators and forecasting. Chicago, IL: University Press. [Google Scholar]
- Strayer R. 1998. Why did the Soviet Union collapse? Understanding historical change. New York, NY: M.E. Sharpe. [Google Scholar]
- Stuckler D., Basu S., McKee M., King L. 2008a Mass incarceration can explain population increases in TB and multidrug-resistant TB in European and Central Asian countries. Proc. Natl Acad. Sci. USA 105, 13 280–13 285. ( 10.1073/pnas.0801200105) [DOI] [PMC free article] [PubMed] [Google Scholar]
- Stuckler D., King L. P., Basu S. 2008b International monetary fund programs and tuberculosis outcomes in post-communist countries. PLoS Med. 5, e143 ( 10.1371/journal.pmed.0050143) [DOI] [PMC free article] [PubMed] [Google Scholar]
- Stuckler D., Basu S., Suhrcke M., Coutts A., McKee M. 2009. The public health effect of economic crises and alternative policy responses in Europe: an empirical analysis. Lancet 374, 315–323. ( 10.1016/S0140-6736(09)61124-7) [DOI] [PubMed] [Google Scholar]
- United Nations Statistics Division. 2009. UN data. See http://data.un.org/Data.aspx?q=gdp&d=CDB&f=srID:29923 (accessed 8 August 2009). [Google Scholar]
- Wills A. J. 2003. Letter from Cuba. J. Neurol. Neurosurg. Psychiatry 74, 285–286. ( 10.1136/jnnp.74.3.285) [DOI] [PMC free article] [PubMed] [Google Scholar]
- World Health Organization. 2009a The financial crisis and global health. See http://www.who.int/mediacentre/events/meetings/2009_financial_crisis_report_en_.pdf (accessed 8 August 2009). [Google Scholar]
- World Health Organization. 2009b Global tuberculosis control. See http://www.who.int/tb/publications/global_report/2009/en/index.html (accessed 8 August 2009). [Google Scholar]
- Wright A., et al. 2009. Epidemiology of antituberculosis drug resistance 2002–07: an updated analysis of the Global Project on Anti-Tuberculosis Drug Resistance Surveillance. Lancet 373, 1861–1873. ( 10.1016/S0140-6736(09)60331-7) [DOI] [PubMed] [Google Scholar]
- Zalesky R., Abdullajev F., Khechinashvili G., Safarian M., Madaras T., Grzemska M., Englund E., Dittmann S., Raviglione M. 1999. Tuberculosis control in the Caucasus: successes and constraints in DOTS implementation. Int. J. Tuberc. Lung Dis. 3, 394–401. [PubMed] [Google Scholar]
- Zolotova E. 2007. Russian oblast is model in fight against TB. Bull. World Health Organ. 85, 329–331. [DOI] [PMC free article] [PubMed] [Google Scholar]


