Abstract
Chronic ethanol consumption is known as an independent risk factor for type 2 diabetes, which is characterized by impaired glucose homeostasis and insulin resistance; however, there is a great deal of controversy concerning the relationships between alcohol consumption and the development of type 2 diabetes. We investigated the effects of chronic ethanol consumption on pancreatic β-cell dysfunction and whether generated peroxynitrite participates in the impaired glucose homeostasis. Here we show that chronic ethanol feeding decreases the ability of pancreatic β-cells to mediate insulin secretion and ATP production in coordination with the decrease of glucokinase, Glut2, and insulin expression. Specific blockade of ATF3 using siRNA or C-terminally deleted ATF3(ΔC) attenuated ethanol-induced pancreatic β-cell apoptosis or dysfunction and restored the down-regulation of glucokinase (GCK), insulin, and pancreatic duodenal homeobox-1 induced by ethanol. GCK inactivation and down-regulation were predominantly mediated by ethanol metabolism-generated peroxynitrite, which were suppressed by the peroxynitrite scavengers Nγ-monomethyl-l-arginine, uric acid, and deferoxamine but not by the S-nitrosylation inhibitor DTT, indicating that tyrosine nitration is the predominant modification associated with GCK down-regulation and inactivation rather than S-nitrosylation of cysteine. Tyrosine nitration of GCK prevented its association with pBad, and GCK translocation into the mitochondria results in subsequent proteasomal degradation of GCK following ubiquitination. This study identified a novel and efficient pathway by which chronic ethanol consumption may induce GCK down-regulation and inactivation by inducing tyrosine nitration of GCK, resulting in pancreatic β-cell apoptosis and dysfunction. Peroxynitrite-induced ATF3 may also serve as a potent upstream regulator of GCK down-regulation and β-cell apoptosis.
Keywords: Alcohol, Apoptosis, Glucokinase, Pancreatic Islet, Ubiquitination, Ethanol, Pancreatic Beta Cells, Tyrosine Nitration
Introduction
Chronic ethanol consumption leads to the development of fatty liver, which is associated with steatohepatitis and liver cirrhosis (1, 2). Heavy alcohol drinking is known as an independent risk factor for type 2 diabetes (T2D),2 which is characterized by impaired glucose homeostasis and insulin resistance (3–5). Several cross-sectional studies and large prospective studies have shown that low-to-moderate ethanol consumption may protect against T2D or cardiovascular diseases through augmenting glucose-stimulated insulin secretion and insulin sensitivity (6–9). However, the J- or U-shaped curve obtained from these studies has not been fully explained with regard to the relationships between ethanol consumption and T2D (10, 11). The priming effect of ethanol-enhanced insulin secretion in pancreatic β-cells might be caused by an early defense mechanism used to compensate for ethanol-inhibited basal insulin secretion. In contrast, a limited number of studies have reported deleterious effects of ethanol on β-cells in which ethanol inhibited insulin secretion (12). Excessive heavy ethanol consumption-increased ROS production may be a mechanism of pancreatic β-cell dysfunction in T2D. The reason is that ROS production is one of the earliest events in glucose intolerance through mitochondrial dysfunction, and β-cells are very sensitive to oxidative stress (13, 14). Despite convincing evidence of chronic ethanol consumption as a risk factor for T2D (3, 4), the direct effects of ethanol on β-cell mass or its function and the exact mechanisms underlying the impairment of β-cell function and apoptosis by chronic ethanol exposure are not clearly understood. Furthermore, because the pleiotropic effect of ethanol could be mediated by the alterations of gene expression or its modification (15, 16), a comprehensive assessment of the effects of ethanol on the expression or modification of genes involved in the regulation of β-cell function should be considered.
Glucokinase (GCK) plays a critical role as a β-cell glucose sensor by integrating blood glucose levels and glucose metabolism with insulin secretion (17, 18). Previously, we demonstrated that chronic hyperglycemia-induced β-cell apoptosis was associated with GCK down-regulation, which was mediated by ROS production and AMPK activation (18, 19). However, the relevant upstream regulators of GCK down-regulation remain poorly understood. Pancreatic duodenal homeobox-1 (PDX-1) plays a critical role in the maintenance of mature β-cell function by regulating the expression of insulin, islet amyloid polypeptide, GCK, and Glut2 (20). Moreover, sterol regulatory element-binding protein-1c also directly binds to the SRE elements of liver GCK promoter, increasing GCK expression and enhancing the action of insulin on GCK transcription (21). Recently, we reported that lipotoxicity-increased activating transcription factor 3 (ATF3), a member of the ATF/cAMP-responsive element-binding protein subfamily, was also associated with inhibition of PDX-1-induced GCK promoter activity (22), although the precise mechanisms are not clear. ATF3 is rapidly induced by a wide range of stresses including genotoxic stress and also plays a role as a stress-inducible transcriptional repressor (23). These studies have demonstrated that ethanol-induced oxidative stress may associate with the induction of ATF3. Also, ATF3 may play a critical role in ethanol-induced susceptibility to β-cell dysfunction and apoptosis as well as hepatotoxicity, which could be triggered by enhancing peroxynitrite generation (24). Peroxynitrite is a relatively stable species and reacts with a diverse array of other biological target molecules, including cysteine or tyrosine residues on proteins (25). NO generated by iNOS induction can directly modify target proteins through S-nitrosylation of cysteine residues or nitration of Tyr residues (26). These modifications could be also involved in pathophysiological processes such as inflammation, apoptosis, enzyme activity, and gene expression (27). A recent study demonstrated that insulin-induced neuronal nitric-oxide synthase leads to S-nitrosylation of GCK, which is involved in preventing the impaired glucose response and apoptosis of pancreatic β-cells (28). However, other studies have demonstrated that peroxynitrite generated by cytokines or endotoxins is also known to induce impaired glucose metabolism and apoptosis of pancreatic β-cells (29, 30). In this paper, we show that chronic ethanol consumption induces GCK down-regulation and inactivation by inducing tyrosine nitration of GCK, resulting in pancreatic β-cell apoptosis and dysfunction. The nitrated GCK may be more susceptible to protein ubiquitination or degradation, leading to impaired glucose responsiveness and insulin resistance. Furthermore, peroxynitrite-generated ATF3 may serve as a potent upstream key regulator of GCK down-regulation and β-cell apoptosis.
EXPERIMENTAL PROCEDURES
Mice
C57BL/6J mice were originally purchased from Jackson Laboratories (Bar Harbor, ME). Male mice (7 weeks old) were used in all of the experiments, which were conducted in accordance with guidelines from the Korean National Institutes of Health Animal Facility. Individually caged mice were placed on a Lieber-Decarli regular liquid diet (Dyets) containing 1.0 kcal/ml, of which 18% are derived from protein, 35% from fat, and either 47% from carbohydrate (control diet, no. 710027) or 11% from carbohydrate and 36% from ethanol (ethanol diet, no. 710260). The mice were pair-fed with the control versus 5% (v/v) ethanol diet as previously reported by others (31). We have also obtained the similar results from control (no. F1259SP) or ethanol-fed (no. F1258SP) C57BL/6J mice as we have previously reported (32).
Cell Lines and Isolated Islet Cells
MIN6N8 cells, which are SV40 T-transformed insulinoma pancreatic β-cells derived from NOD mice, were kindly provided by Dr. M. S. Lee (Sungkyunkwan University, School of Medicine, Seoul, Korea). These cells were grown in DMEM containing 15% FBS, 2 mm glutamine, and penicillin-streptomycin (Invitrogen). Islet cells were isolated from overnight-fasted C57BL/6 mice using a previously described collagenase digestion technique (18, 19).
Plasmids
Human wild-type ATF3 and ATF3(ΔC,1–100) with a C-terminal deletion cDNA expression vectors were a generous gift from Dr. T. Hai (Ohio State University). ATF3, ATF3(ΔN), and ATF3(ΔC) cDNAs were amplified separately using PCR and cloned into the pEGFP-C2(33). Mouse GCK cDNA was amplified by PCR and cloned into pEGFP-N1 (EcoRI/BamHI) and pGEX-4T-1 (BamHI/EcoRI) vectors (Clontech), respectively (18). The primers are as follows: 1) for GFP-GCK, forward, 5′-gggaagtctgggctacttctg-3′, and reverse, 5′-ctagtggactgggagcatttg-3′; and 2) for GST-GCK, forward, 5′-ggatccatgctggatgacagagcc-3′, and reverse, 5′-tcactggcccagcatgcaagcctt-3′.
RNA Interference and Transient Transfection
The human ATF3 (sc-29757) or mouse ATF3 (sc-29758) siRNAs were purchased from Santa Cruz Biotechnology (Santa Cruz, CA). Transfections were performed using Lipofectin reagent (Invitrogen) following the protocol recommended by the manufacturer.
Immunoassays
The immunohistochemistry and immunocytochemistry analyses were performed as described previously (18, 19).
Glucose Tolerance Test (GTT) and Insulin Tolerance Test
The mice were fasted starting at 8:00 a.m. for 6 h and were injected intraperitoneally with 1 g/kg intraperitoneal glucose or 1.5 units/kg intraperitoneal regular human insulin. Blood samples were collected from the tail vein at time 0 (before injection) and 30, 60, 90, and 120 min after glucose or insulin injection, and the blood glucose level was measured using a portable glucose meter (Glucocard II Arkray, Kyoto, Japan). An intravenous GTT (0.5 g/kg) was conducted in mice fasted for 16 h (20). An oral GTT (1 g/kg) was also made in mice fasted for 6 h.
Determination of Insulin Secretion, ATP Content, and Nitrite
The determination of acute insulin release in response to glucose stimulation and ATP levels in MIN6N8 cells and islets were performed as described previously (18, 19). Plasma insulin was measured using the UltraSensitive mouse insulin ELISA kit (Alpco Diagnostics), and also nitrite was determined by the Griess method as described previously (33).
Ubiquitination and Nitration Assays
In vivo ubiquitination assay was also performed as described previously (34). The cells were cotransfected with the constant amount of His-GCK (0.5 μg) and HA-ubiquitin (0.5 μg). Forty-eight hours after transfection, the cells were treated with ethanol in the presence or absence of l-NMMA and also treated with 10 μm MG-132 for 6 h before being harvested. For in vitro and in vivo nitration, whole cell extracts or recombinant GCK were incubated in a nitration reaction buffer containing 10 mm NaNO2, 9 μm FeCl3, 0.3% H2O2, and 20 mm sodium acetate (pH 5.6) for 24 h at room temperature followed by immunoprecipitation or immunoblotting using anti-3NT antibody. BSA was included as the in vitro nitration control (35).
Glucokinase Activity
The glucokinase activity assay in MIN6N8 and islet cells was performed as described previously (36). 700–800 islets were lysed in 500 μl of reporter lysis buffer (Promega Corp., Madison,WI), and the cell membranes were disrupted by three freeze-thaw cycles.
Statistical Analysis
A one-factor analysis of variance was used, followed by Tukey's post hoc test, to compare values obtained from three or more groups. A p value less that 0.05 was considered statistically significant.
RESULTS
Chronic Alcohol Consumption Induces β-Cell Dysfunction and Impairment of Glucose Metabolism
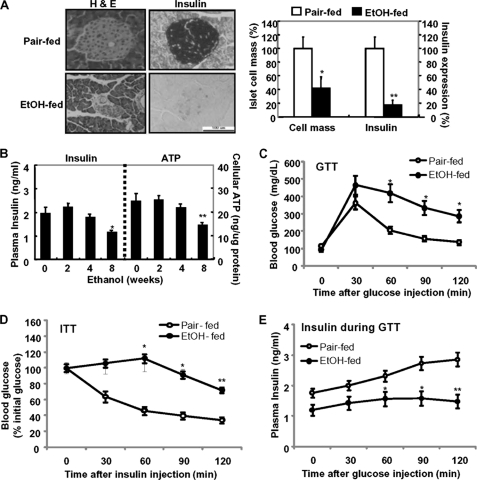
To investigate the impact of chronic alcohol consumption on pancreatic β-cell proliferation and its function in vivo, 7-week-old male C57BL/6 mice were exposed to a liquid ethanol diet for 8 weeks. Exposure of ethanol resulted in a significant decrease in islet cell mass and insulin expression as compared with pair-fed mice (Fig. 1A). Chronic alcohol exposure also resulted in hepatocellular damage by elevating plasma levels of alanine aminotransferase (data not shown). Concomitantly, the levels of plasma insulin and ATP production were little or slightly increased in acute ethanol-fed mice (2–4 weeks) but significantly decreased in chronic ethanol-fed mice (8 weeks) (Fig. 1B). Glucose tolerance tests revealed a greater impairment in glucose homeostasis in chronic ethanol-fed mice relative to pair-fed mice (Fig. 1C). Similarly, glucose values during an intravenous GTT (supplemental Fig. S1A) and an oral GTT (supplemental Fig. S1B) remained markedly elevated in ethanol-treated mice, in contrast to the pair-fed mice. Next, we examined whole body insulin sensitivity by performing insulin tolerance tests in pair-fed and ethanol-fed mice (Fig. 1D). Insulin-stimulated glucose disposal curves in pair-fed mice were markedly enhanced compared with those in ethanol-treated mice (Fig. 1D and supplemental Fig. S1C). Therefore, to examine whether the lower insulin action on glucose disposal in ethanol-fed mice compared with that of pair-fed mice was due to the reduction of insulin synthesis or secretion in pancreatic β-cells, we have measured plasma insulin levels during GTT in vivo and glucose-stimulated insulin secretion in vitro. As shown in Fig. 1E, insulin levels during the GTT were elevated in pair-fed mice, whereas they were not elevated in ethanol-fed mice. Also, in freshly isolated islets of ethanol-fed mice, glucose-stimulated insulin secretion did not increase in ethanol-fed mice compared with islets from pair-fed mice (supplemental Fig. S1D). Consistent with these results, insulin receptor substrate 1 phosphorylation at Ser-307 was significantly increased in the liver of ethanol-treated mice, whereas Tyr-941 phosphorylation of insulin receptor substrate 1 and Akt phosphorylation were significantly suppressed in ethanol-treated mice (supplemental Fig. S1E), indicating that the reduction of insulin synthesis in β-cells of ethanol-fed mice might be involved in the inhibition of insulin action in the liver. Furthermore, the dysregulation of hepatic gluconeogenesis could be also associated with the ethanol-mediated impairment of glucose tolerance because PEPCK expression was decreased in ethanol-fed mice (supplemental Fig. S1E). Consistently, pancreas tissues (DNA fragmentation) and isolated islet cells (TUNEL) from ethanol-fed mice showed more apoptosis (supplemental Fig. S2A) and the increase of caspase-3 or PARP cleavage and Bax/Bcl-2 ratio (supplemental Fig. S2B).
FIGURE 1.
Chronic ethanol consumption induces pancreatic β-cell dysfunction and impairs glucose metabolism. A, pancreas from pair-fed and ethanol-fed mice was subjected to hematoxylin and eosin (H&E) staining and immunohistochemistry (IHC) for insulin (left). Scale bar, 100 μm. Islet cell mass and insulin expression were quantified (right panel). *, p < 0.01; **, p < 0.05. B, levels of serum insulin and ATP in ethanol-fed mice. *, p < 0.01; **, p < 0.05. C, glucose tolerance test; n = 6 mice/condition. The results represent the averages ± S.E. from three independent experiments. D, insulin tolerance test (ITT). Mice fasted for 6 h were acutely injected (intraperitoneally) with insulin, and blood glucose was measured at the indicated times. E, plasma insulin concentration during GTT. Mice fasted for 6 h were acutely injected (intraperitoneally) with glucose and plasma insulin was measured at the indicated times. C and D, *, p < 0.01; **, p < 0.05 in comparison with the corresponding pair-fed mice. All of the results were obtained from three independent experiments.
Ethanol-mediated GCK Down-regulation and β-Cell Dysfunction Were Dependent on ATF3
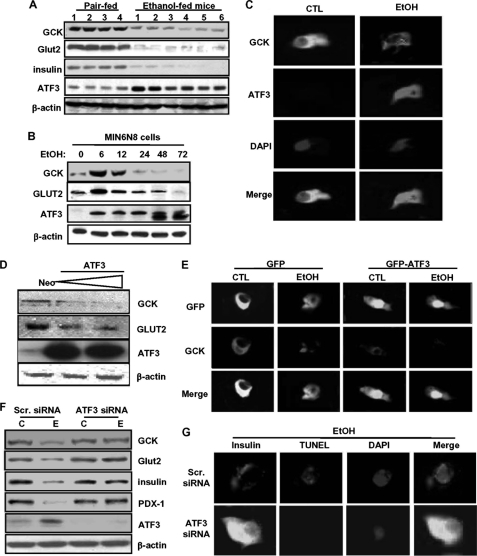
Similar to impaired glucose tolerance and β-cell apoptosis, the expression of GCK and Glut2 proteins as well as insulin was significantly decreased in pancreas tissues of chronic ethanol-fed mice, whereas ATF3 was highly increased (Fig. 2A and supplemental Fig. S3). We have also obtained the same results in MIN6N8 cells. As shown in Fig. 2B, at early time points (6–12 h), ethanol treatment increased GCK and Glut2 expression and thereafter decreased, reaching base-line levels after 24 h, whereas ATF3 was increased by ethanol in a time-dependent manner. Interestingly, GCK expressed in the cytoplasm of control cells was significantly decreased in ethanol-treated cells, whereas ATF3 was strongly increased, and it was predominantly localized in the nucleus (Fig. 2C). Next, to determine whether ATF3 directly affects GCK and Glut2 expression, the cells were transfected with an ATF3 cDNA construct. ATF3 overexpression significantly decreased GCK and Glut2 protein expression (Fig. 2D). As in Fig. 2C, most of the transfected GFP-ATF3 was also observed in the nucleus, which was augmented by ethanol treatment. However, GCK expression was remarkably decreased in GFP-ATF3-transfected cells as compared with GFP-transfected cells. ATF3 overexpression also triggered ethanol-induced GCK down-regulation (Fig. 2E). Additionally, knockdown of ATF3 by siRNA strongly attenuated down-regulation of GCK, Glut2, insulin, and PDX-1 induced by ethanol (Fig. 2F and supplemental Fig. S4A). Similarly, ATF3 siRNA-transfected cells were resistant to ethanol-induced β-cell apoptosis and insulin reduction (Fig. 2G and supplemental Fig. S4B), suggesting that ATF3 may directly affect GCK down-regulation and insulin reduction in chronic ethanol-treated cells, resulting in β-cell apoptosis.
FIGURE 2.
ATF3 plays an essential role in ethanol-induced GCK down-regulation and apoptosis. A, effects of chronic ethanol consumption on GCK, Glut2, insulin, and ATF3 protein expression in pancreas tissues. B, effects of ethanol (100 mm) on GCK, Glut2, and ATF3 protein in and MIN6N8 cells. C, after treatment with ethanol for 24 h, MIN6N8 cells were analyzed using immunocytochemistry for GCK and ATF3, subsequently subjected to the DAPI staining (100×). D, MIN6N8 cells were transfected with the expression vector encoding ATF3 and analyzed using Western blot. E, after transfection with empty GFP or GFP-ATF3 vectors, immunocytochemistry for GCK was performed. Fluorescent microscopic images were taken for GFP or GFP-ATF3 (green) and GCK (red), and the final merged images are shown (100×). F, after transfection with scrambled siRNA or ATF3 siRNA, the cells were treated with ethanol and analyzed using Western blot. C, non-treated control; E, ethanol-treated group. G, after transfection with scrambled siRNA or ATF3 siRNA, the cells were treated with ethanol, and immunocytochemistry was performed for insulin and TUNEL assay or DAPI staining (top row, 100×). TUNEL-positive cells were quantified (supplemental Fig. S4B). *, p < 0.05; **, p < 0.01 (n = 100). All of the results were obtained from three independent experiments. CTL, control; Scr., scrambled.
Ethanol-mediated GCK Down-regulation and β-Cell Dysfunction Were Dependent on the C-terminal Domain of ATF3
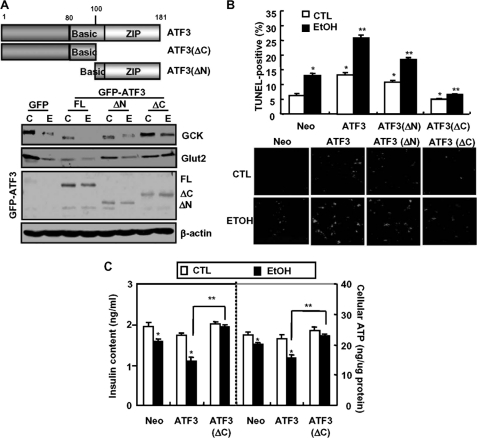
Next, to examine the regulatory region of ATF3 involved in ethanol-mediated GCK down-regulation, the cells were transfected with the constructed full-length ATF3, N-terminal (1–100) domain-deleted ATF3(ΔN), or GFP-ATF3(ΔC), a construct with a deletion in the C-terminal (101–181) region necessary for interactions with other proteins (Fig. 3A, top panels). The expression of GCK and Glut2 was decreased by overexpression of GFP-ATF3(FL) or ATF3(ΔN) alone, but not by GFP-ATF3(ΔC) (bottom panels). Furthermore, ethanol-induced down-regulation of GCK and Glut2 was potentiated by GFP-ATF3(FL) or ATF3(ΔN) overexpression but not by GFP-ATF3(ΔC). Ethanol-induced β-cell apoptosis was also potentiated in GFP-ATF3- or ATF3(ΔN)-transfected cells but not in GFP-ATF3(ΔC)-transfected cells (Fig. 3B). Accordingly, ethanol-mediated reduction in insulin content and ATP production also depended on the C-terminal domain of ATF3 (Fig. 3C).
FIGURE 3.
The C-terminal domain of ATF3 is essential for ethanol-induced GCK down-regulation and apoptosis. A, MIN6N8 cells were transfected with GFP-empty, GFP-ATF3, GFP-ATF3(ΔN), or GFP-ATF3(ΔC) vectors, and then Western blot was performed. C, non-treated control; E, ethanol-treated group. B, TUNEL assay. TUNEL-positive apoptosis cell numbers were quantified. *, p < 0.01; **, p < 0.05. C, after transfection with each vector, insulin content and ATP levels were measured. *, p < 0.05 in comparison with the corresponding untreated control Neo-vector groups. **, p < 0.01 in comparison with the corresponding ethanol-treated ATF3 overexpressing groups. All of the results were obtained from three independent experiments. CTL, control.
Ethanol Metabolism Is Required for Ethanol-induced GCK Down-regulation and β-Cell Dysfunction
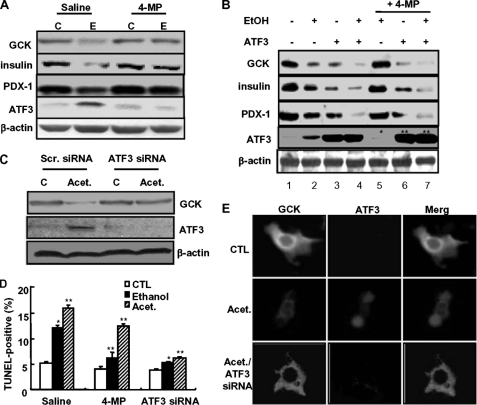
Next, to examine whether ethanol potentiation of ATF3-mediated GCK down-regulation and β-cell dysfunction requires ethanol metabolism, the cells were pretreated with 4-methylprazole (4-MP), an inhibitor of cytochrome P450 2E1 (37). As shown in Fig. 4A, 4-MP markedly attenuated an ethanol-induced decrease in GCK, insulin, and PDX-1 expression. Also, ethanol-induced ATF3 expression was almost completely abolished by 4-MP. Similar to the effects of ethanol, ATF3 overexpression also inhibited GCK, insulin, and PDX-1 expression (Fig. 4B, lane 3), which was potentiated by ethanol cotreatment (lane 4). Blocking ethanol metabolism by 4-MP attenuated the down-regulation of GCK, insulin, and PDX-1 induced by ethanol (lane 5), whereas 4-MP did not affect their down-regulation induced by ATF3 (lane 6) or ethanol potentiation of ATF3-mediated down-regulation (lane 7). Moreover, 4-MP concomitantly attenuated GCK down-regulation and endogenous ATF3 induced in ethanol-treated cells (*, lane 5), whereas exogenously transfected ATF3 expression was not affected by 4-MP (**, lanes 6 and 7), suggesting that 4-MP may act differently on their down-regulation through ethanol-induced endogenous ATF3 or exogenously overexpressed ATF3. Furthermore, as in ethanol treatment (Fig. 2), ethanol metabolite acetaldehyde-induced GCK down-regulation (Fig. 4C) and β-cell apoptosis (Fig. 4D) were almost completely attenuated by ATF3 siRNA, but not by 4-MP, indicating that ATF3 plays as a downstream regulator of ethanol metabolism. The immunocytochemistry data also showed that acetaldehyde-mediated GCK down-regulation depends on ATF3 (Fig. 4E). GCK expression was significantly decreased in cells with acetaldehyde-induced increase in ATF3, which was blocked by ATF3 depletion by siRNA. These results suggest that ATF3 may be an essential downstream regulator of ethanol metabolism and function as an executive effector of ethanol-mediated GCK down-regulation and β-cell apoptosis.
FIGURE 4.
Ethanol metabolism is required for ATF3-mediated GCK down-regulation. A, cells were pretreated with 4-MP (100 μm) and then treated with ethanol. Western blots were performed. C, non-treated control; E, ethanol-treated group. B, cells were treated with ethanol and/or transfected with ATF3 in the presence or absence of 4-MP. Asterisks (* and **) indicated the amounts of endogenous and exogenous ATF3, respectively. C, effects of acetaldehyde on ATF3-mediated GCK down-regulation. D, after treatment, TUNEL-positive apoptosis cell numbers were quantified. *, p < 0.05; **, p < 0.01. E, after treatment with acetaldehyde in the presence or absence of ATF3 siRNA, immunocytochemical analyses for GCK and ATF3 were performed. Fluorescent microscopic images were taken for GCK (green) and ATF3 (red), and the final merged images are shown (100×). All of the results were obtained from three independent experiments. CTL, control; Scr., scrambled; Acet., acetaldehyde.
Effects of Ethanol Metabolism-generated Peroxynitrite on GCK Down-regulation and β-Cell Dysfunction
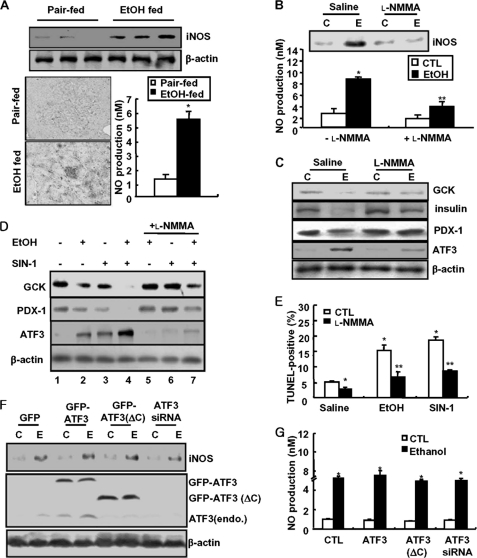
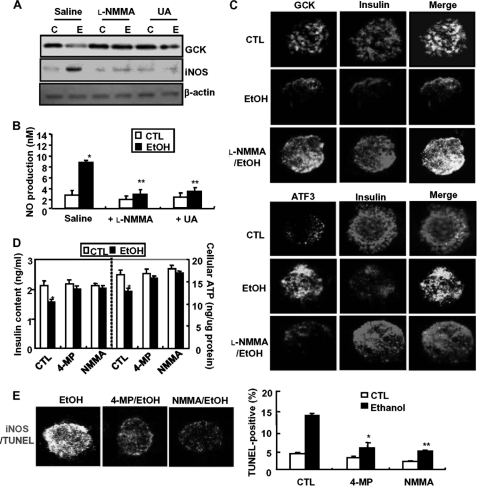
In general, cytochrome P450 2E1 generates oxidative products, such as nitric oxide and superoxide, through ethanol metabolism, and peroxynitrite also causes cell toxicity through protein nitration on various proteins and enzymes (38). Therefore, we examined the contribution of peroxynitrite in ethanol potentiation of ATF3-mediated GCK down-regulation and β-cell apoptosis. As shown in Fig. 5A, iNOS expression and NO production were significantly increased in ethanol-fed mice, which were inhibited by an iNOS inhibitor l-NMMA (Fig. 5B). Concomitantly, l-NMMA prevented the down-regulation of GCK, insulin, and PDX-1 or ATF3 induction by ethanol (Fig. 5C). To investigate whether peroxynitrite directly affects ethanol-induced GCK down-regulation and ATF3 induction, MIN6N8 cells were treated with SIN-1, a peroxynitrite donor, in the presence or absence of l-NMMA (Fig. 5D). Similar to ethanol (lane 2), SIN-1 alone inhibited GCK and PDX-1 expression (lane 3) and potentiated ethanol-induced down-regulation (lane 4), which were attenuated by l-NMMA (lanes 5–7). Conversely, SIN-1-increased ATF3 expression was potentiated by ethanol, which was also attenuated by l-NMMA. Furthermore, ethanol- or SIN-1-induced β-cell apoptosis was markedly inhibited by l-NMMA (Fig. 5E), indicating that SIN-1 mimics the effects of ethanol and that peroxynitrite may directly regulate ATF3-mediated GCK down-regulation and apoptosis. Contrary to the direct effect of ATF3 on GCK down-regulation, ATF3 did not affect ethanol-increased iNOS expression and NO production (Fig. 5, F and G), indicating that ATF3 may be a downstream regulator of the ethanol-mediated iNOS/NO pathway that leads to GCK down-regulation and β-cell apoptosis. To confirm that ethanol metabolism-generated peroxynitrite is responsible for GCK down-regulation and β-cell apoptosis, we also examined in isolated pancreatic islet cells. Ethanol-elicited GCK down-regulation and iNOS induction were prevented by l-NMMA or UA (Fig. 6A); this was correlated with the reduction of ethanol-induced NO production (Fig. 6B). Blocking of iNOS/NO by l-NMMA attenuated ethanol-induced down-regulation of GCK or insulin and ATF3 induction (Fig. 6C). Furthermore, 4-MP and l-NMMA restored insulin content and ATP production decreased by ethanol (Fig. 6D). Additionally, the attenuation of ethanol-induced β-cell apoptosis by 4-MP or l-NMMA was correlated with a decrease in iNOS expression (Fig. 6E).
FIGURE 5.
Ethanol-generated peroxynitrite is involved in ATF3-mediated GCK down-regulation and apoptosis. A, iNOS expression and NO production in ethanol-fed mice. *, p < 0.05. B, MIN6N8 cells were treated with ethanol in the presence or absence of l-NMMA (100 μm) and measured NO production using Griess method. C, non-treated control; E, ethanol-treated group. C, l-NMMA inhibits ethanol-induced GCK down-regulation. D, cell were treated with ethanol and/or SIN-1 (100 μm) in the presence or absence of l-NMMA and then subjected to Western blot. E, under the same conditions, TUNEL assay was performed. *, p < 0.05; **, p < 0.01. F, using cells transfected with GFP-empty, GFP-ATF3, GFP-ATF3(ΔN), or GFP-ATF3(ΔC) vectors, the effects of ATF3 on ethanol-induced iNOS expression were determined. G, effects of ATF3 on ethanol-induced NO production. *, p < 0.05. All of the results were obtained from three independent experiments. CTL, control.
FIGURE 6.
Ethanol metabolism-induced peroxynitrite is essential for ATF3-mediated GCK down-regulation in the isolated islet cells. A, islet cells were treated with ethanol in the presence of l-NMMA (100 μm) or UA (100 μm) and then subjected to Western blot. C, non-treated control; E, ethanol-treated group. B, l-NMMA or UA inhibits ethanol-induced NO production. C, immunocytochemistry for insulin, GCK (top panels), and ATF3 (bottom panels) was performed in ethanol-treated cells. Fluorescent microscopic images were taken for GCK (green, top panels), ATF3 (green, bottom panels), and insulin (red), and the final merged images are shown (100×). D, effects of ethanol metabolism and peroxynitrite on ethanol-reduced insulin and ATP levels. *, p < 0.05; **, p < 0.01. E, immunocytochemistry for iNOS and TUNEL assay were performed (left panel, 100×). TUNEL-positive cells were quantified (right panel). *, p < 0.05; **, p < 0.01. All of the results were obtained from three independent experiments. CTL, control.
Chronic Ethanol Consumption-induced GCK Down-regulation May Be Mediated by GCK Nitration
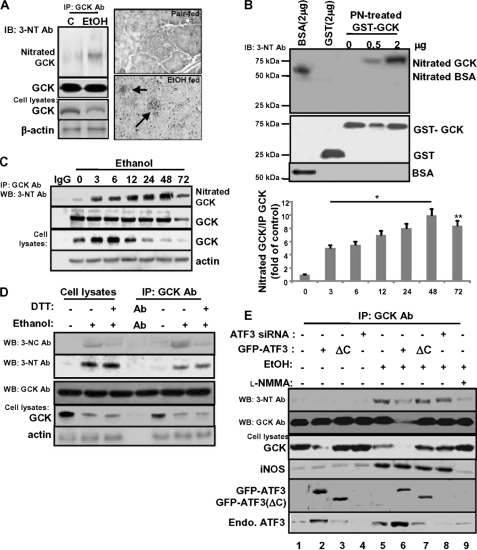
Because nitrotyrosine produced by oxidative/nitrosative stress is known to cause dysfunction or degradation of many functional proteins (39), we examined whether ethanol-mediated GCK down-regulation could be regulated by its nitration. As shown in Fig. 7A, the nitrated GCK was strongly increased in ethanol-fed mice, which was correlated with reduced GCK protein (left panel). Immunohistochemical staining for 3-nitrotyrosine protein adducts in pancreas sections was significantly increased in the islet cells of ethanol-fed mice but did not show any adduct in pair-fed mice (right panel). Similarly, recombinant GST-GCK was effectively nitrated on Tyr residues after incubation with peroxynitrite (Fig. 7B, lanes 4 and 5). In MIN6N8 cells, nitrated GCK also increased by 48 h of treatment with ethanol, but the amount of nitration strongly decreased after 72 h, which might be due to the reduction in immunoprecipitated GCK protein amounts (Fig. 7C). The ratio of nitrated GCK/immunoprecipitated GCK amounts increased and remained elevated after 72 h (right panel). Similar to Fig. 1E, ethanol treatment increased GCK protein expression at 3 and 6 h and thereafter decreased. Therefore, to examine the possibility that ethanol-induced GCK down-regulation could be regulated by peroxynitrite-mediated Tyr nitration or S-nitrosylation, the cells were pretreated with DTT, an S-nitrosylation inhibitor (Fig. 7D). Similar to Tyr nitration (3-nitrotyrosine), ethanol also enhanced the S-nitrosylation of GCK (3-nitrocystein, second and sixth lanes), which was almost abolished by DTT (third and seventh lanes). However, DTT had little impact on ethanol-induced Tyr nitration. Furthermore, ethanol-induced GCK down-regulation may be correlated with enhanced GCK Tyr nitration, not with that of its S-nitrosylation. Next, we examined whether ATF3 can affect ethanol-induced GCK nitration and GCK down-regulation. The decrease of GCK expression induced by ethanol (fifth lane) or ATF3 (second lane) was prominent in cells cotreated with ethanol and ATF3 (sixth lane). However, GCK nitration and iNOS induction were not observed in ATF3-transfected cells (second lane). Furthermore, ethanol-induced GCK nitration and iNOS induction were not changed in ATF3(ΔC)-transfected (seventh lane) or ATF3 siRNA-transfected (eighth lane) cells, indicating that ATF3 did not affect GCK nitration and iNOS expression. However, even though ATF3 did not affect ethanol-induced iNOS expression (sixth lane), ethanol-induced GCK nitration was significantly decreased in ethanol/ATF3-cotreated cells. This might be due to the complete reduction of GCK protein amounts. These results suggest that GCK nitration and iNOS induced by ethanol may act as an upstream regulator of ATF3-mediated GCK down-regulation.
FIGURE 7.
Ethanol-generated peroxynitrite induces tyrosine nitration of GCK, correlated with GCK down-regulation. A, in ethanol-fed mice, immunoprecipitated GCK was probed with anti-nitrotyrosine antibody (left panels). Shown are representative images of iNOS immunohistochemistry (brown) performed on pancreas sections from ethanol-fed mice (arrow, right panels). B, in vitro nitration. Recombinant GST-GCK was treated with proxynitrite (1 mm) for 2 h at 37 °C. Nitrated GCK were detected with a mouse monoclonal anti-nitrotyrosine antibody. C, after treatment with ethanol, endogenous GCK was immunoprecipitated and then subjected to Western blot (left panel). The ratio of nitrated GCK/immunoprecipitated GCK amounts are shown (right panel). *, p < 0.01; **, p < 0.05. D, effects of ethanol-induced GCK nitration or S-nitrosylation on GCK protein expression. E, effects of ATF3 on peroxynitrite-induced GCK nitration and GCK down-regulation. All of the results were obtained from three independent experiments. IP, immunoprecipitation; IB, immunoblot; WB, Western blot; Ab, antibody.
Ethanol-induced GCK Nitration Inhibits GCK Activity and Enhances the Susceptibility to Ubiquitination and Degradation
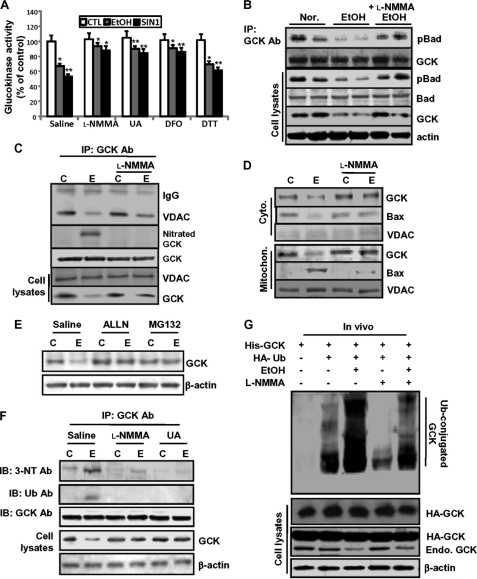
Because protein nitration may cause functional loss of many proteins through inhibition of critical Tyr residues (40) or the rapid degradation of certain proteins (41), we first examined whether GCK nitration is able to affect GCK activity (Fig. 8A). As expected, GCK activity was significantly decreased in ethanol- or SIN-1-treated islet cells, which were attenuated by l-NMMA or UA together with deferoxamine, another peroxynitrite scavenger. However, inhibition of S-nitrosylation by DTT had little or slight reverse effect on the inhibition of GCK activity. Alternatively, GCK activity can be also regulated through protein-protein interactions. Active GCK has been shown to associate with p-Bad, which preserves mitochondrial integrity by forming a complex with GCK and limiting Bax-induced apoptosis through prevention of Bax interaction with mitochondria (18). The interaction of phosphorylated Bad with immunoprecipitated GCK was significantly decreased in ethanol-treated cells, which was remarkably attenuated by l-NMMA (Fig. 8B). Consistently, GCK-VDAC interaction (Fig. 8C) and translocation of GCK into the mitochondria (Fig. 8D) were also decreased in ethanol-treated cells, whereas GCK nitration or mitochondrial translocation of Bax were increased and were attenuated by l-NMMA. Next, we investigated whether the proteasome degradation pathway may be involved in nitration-mediated GCK down-regulation. Ethanol-induced GCK down-regulation was strongly reversed in cells pretreated with proteasome inhibitors, acetyl-leucyl-leucyl-norleucinal (50 μm) or MG132 (10 μm) (Fig. 8E). Furthermore, the levels of GCK ubiquitination and its nitration were simultaneously observed only in ethanol-treated cells, but total GCK protein levels were decreased, which was significantly attenuated by l-NMMA or UA (Fig. 8F). To provide direct evidence that GCK nitration induced by ethanol may be responsible for GCK ubiquitination and degradation, we performed an in vivo ubiquitination assay (Fig. 8G). Concomitant to the decrease of endogenous GCK expression, the amount of the ubiquitinated GCK strongly increased in ethanol-treated cells (third lane), which were inhibited to the control levels (second lane) by l-NMMA. Taken together, these results strongly suggest that GCK proteins nitrated following ethanol treatment may be more susceptible to ubiquitination than the native proteins of control cells and thus results in degradation (Fig. 9).
FIGURE 8.
Ethanol-induced GCK nitration inhibits GCK activity and enhances the susceptibility to ubiquitination and results in degradation. A, effects of peroxynitirite scavengers (l-NMMA, UA, and deferoxamine (DFO)) and DTT, an S-nitrosylation inhibitor, on GCK inactivation induced in ethanol or SIN-1-treated islet cells. The data are expressed as mean percentages ± S.E. of glucokinase activity (control = 100.5 ± 17 pmol/h·islet); n = 6 experiments. *, p < 0.01; **, p < 0.05). B, effects of ethanol-generated peroxynitrite on GCK-pBad interaction. C, effects of ethanol-generated peroxynitrite on GCK-VDAC interaction. C, non-treated control; E, ethanol-treated group. D, effects of ethanol-generated peroxynitrite on GCK mitochondrial translocation. E, GCK down-regulation following ethanol treatment was due to proteasomal degradation. The cells were treated with ethanol in the presence or absence of the proteasome inhibitors, acetyl-leucyl-leucyl-norleucinal (ALLN, 50 μm) and MG-132 (10 μm). F, after treatment with ethanol in the presence or absence of l-NMMA or UA, immunoprecipitated GCK was subjected to Western blotting for nitrated and ubiquitinated GCK using anti-nitrotyrosine and anti-polyubiquitin (FK-1) antibodies. G, in vivo ubiquitination. The cells were transiently cotransfected with the indicated combinations of expression plasmids and treated with MG132. Ubiquitinated products were recovered on nickel-agarose beads and separated by SDS-PAGE, followed by immunoblotting with anti-HA antibody (right). All of the results were obtained from three independent experiments. CTL, control; IP, immunoprecipitation; IB, immunoblot; Ab, antibody; Mitochon., mitochondrial; Nor., normal control; Cyto., cytoplasm.
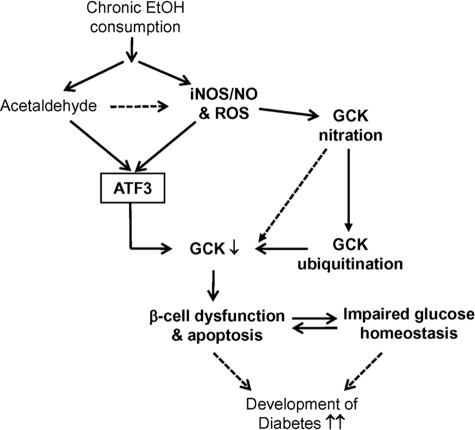
FIGURE 9.
Proposed model by which peroxynitrite-mediated ATF3 and GCK nitration in ethanol consumption mice modulates β-cell function and glucose homeostasis. Chronic ethanol treatment generates peroxynitrite and ROS and then induces ATF3 and GCK nitration. Induced ATF3 down-regulates GCK expression, and the nitrated GCK is more susceptible to protein ubiquitination and degradation, leading to impaired glucose responsiveness, insulin resistance, and β-cell dysfunction and apoptosis. These serial sequence pathways may promote the progression of diabetes development.
DISCUSSION
In this study, we demonstrated that chronic ethanol consumption markedly increased pancreatic β-cell apoptosis and dysfunction, which are correlated with peroxynitrite-mediated GCK down-regulation and ATF3 induction. Although the deleterious effects of chronic heavy alcohol consumption are known (3, 4), the relationships between alcohol consumption and the development of impaired fasting glucose or T2D are still inconsistent and controversial. Furthermore, the exact molecular mechanisms involved in chronic ethanol consumption-induced impaired glucose metabolism and pancreatic β-cell apoptosis and dysfunction are still not clear. Our study demonstrates that β-cell apoptosis and dysfunction induced by chronic ethanol consumption may be determined by impairment of glucose metabolism through GCK down-regulation, revealing the critical roles of ATF3 induction and GCK protein tyrosine nitration in GCK down-regulation and β-cell apoptosis/dysfunction.
Several previous studies have demonstrated that alcohol consumption is associated with a decreased risk of T2D and cardiovascular diseases (6, 7), but there is a great deal of controversy concerning the relationship between alcohol consumption and insulin resistance. One of the reasons for these discrepancies might be associated with the amount and duration of ethanol exposure. Low-to-moderate alcohol intake in obese participants or those with T2D were observed to have low fasting glucose levels, which subsequently may be diagnosed as non-T2D (42). However, participants exposed to heavy alcohol amounts were more fragile with respect to the development of impaired fasting glucose or T2D (10, 11). Similarly, our studies show that chronic alcohol consumption for 8 or 10 weeks significantly increased the development of impaired fasting glucose and β-cell apoptosis, followed by the reduction of insulin and ATP production (Fig. 1, A–C). Consistently, the impaired glucose tolerance in ethanol-fed mice may be due to the reduction of insulin synthesis or secretion via pancreatic β-cell dysfunction and apoptosis (Fig. 1, D and E, and supplemental Fig. S1, C and D). The reduction of insulin synthesis in the β-cells of ethanol-fed mice might be involved in the inhibition of insulin action and gluconeogenesis in the liver (supplemental Fig. S1E). Furthermore, GCK expression decreased in chronic ethanol-fed mice, which was correlated with an increase in ATF3 expression (Fig. 2A and supplemental Fig. S3). Increased ATF3 was predominantly localized in the nucleus of ethanol-treated cells (Fig. 2E). Similar to our recent study (20), we found that ATF3, especially the C-terminal domain of ATF3, may fill an important role in ethanol-mediated GCK down-regulation and apoptosis (Figs. 2 and 3). Although the precise cellular and biochemical causes of ethanol-induced susceptibility to the organ damages including liver, have not been defined, considerable evidence indicates that ethanol-induced oxidative stress plays a critical role in the development of toxicity, which can be triggered by enhancing peroxynitrite generation (24). To our knowledge, ethanol-induced ATF3 can be regulated by oxidative stress generated through CYP2E1 metabolism, and it may act as a critical regulator of GCK down-regulation induced by ethanol-generated oxidative stress in pancreatic β-cells. In this study, we provide several lines of evidence to suggest that both ethanol-mediated GCK down-regulation and ATF3 induction require ethanol metabolism (Fig. 4). First, blocking of ethanol metabolism by 4-MP attenuated ethanol-mediated down-regulation of GCK, insulin, and PDX-1 as well as ATF3 induction (Fig. 4, A and B, lanes 2 and 5). However, 4-MP did not inhibit transfected ATF3 and/or ethanol-induced GCK down-regulation (Fig. 4B, lanes 6 and 7). The reason for these discrepancies is that there are different effects of 4-MP on GCK down-regulation that is mediated by ethanol-induced endogenous ATF3 or exogenously overexpressed ATF3. Second, GCK down-regulation and β-cell apoptosis induced by acetaldehyde were inhibited by ATF3 depletion but not by 4-MP, suggesting that ATF3 may be a downstream regulator of ethanol metabolism and function as an executive effector of ethanol-mediated GCK down-regulation. Our data also show that peroxynitrite-mediated GCK down-regulation and apoptosis were attenuated by the peroxynitrite scavengers l-NMMA or UA (Figs. 5 and 6). Contrary to the potent effects of ATF3 on ethanol-induced GCK down-regulation (Fig. 3A), ATF3 did not affect ethanol-mediated iNOS and NO production (Fig. 5, F and G), indicating that ATF3 may be a downstream regulator of ethanol metabolism-mediated iNOS/NO pathway, which associates GCK down-regulation with β-cell apoptosis.
Glucokinase plays a critical role as a β-cell glucose sensor by integrating blood glucose levels and glucose metabolism with insulin secretion (17). Mice lacking hepatic glucokinase show a typical sign of maturity onset type 2 diabetes of the young, which is impaired glucose tolerance caused by the failure of glucokinase activity to facilitate hepatic glucose utilization and glycogen synthesis (43). Our data show that ethanol-generated peroxynitrite can directly regulate GCK down-regulation and activity. In general, NO generated by iNOS or administrated exogenously can directly modify target proteins through nitration of Tyr residues or S-nitrosylation of cysteine residues, changing pathophysiological processes (26, 27). Previous studies have focused on the role of protein-protein interaction by the GCK regulator (GCKR) or glucose on the regulation of GCK activity (44), whereas the control of cellular GCK activity or its expression at the post-translational level, especially in β-cells, has not been previously considered. Recently, in pancreatic β-cells, insulin activates neuronal-type nitric-oxide synthase, which forms a complex with GCK on the surface of secretory granules, leading to S-nitrosylation of GCK following the dissociation of GCK from the surface of secretory granules (28). Furthermore, other studies have demonstrated that NO and endothelial nitric-oxide synthase generated by insulin-like growth factor-1 and insulin prevents serum starvation-induced RINm5F β-cell apoptosis (45). However, in contrast to the role of iNOS and NO induced by insulin or insulin-like growth factor-1 on GCK S-nitrosylation for preventing pancreatic β-cell dysfunction, peroxynitrite generated by different stresses such as cytokines or endotoxins is also a vital mechanism in causing impaired glucose metabolism and apoptosis of rat or mouse and human pancreatic β-cells (29, 30). Similar to the previous reports showing that peroxynitrite can also directly damage protein, DNA, and lipids (46), our study also shows that ethanol metabolism-generating peroxynitrite increases Tyr nitration of GCK, which was correlated with GCK down-regulation (Fig. 7, A and C). Similarly, recombinant GST-GCK was effectively nitrated on Tyr residues after incubation with peroxynitrite (Fig. 7B). However, ATF3 did not directly affect GCK nitration, although ATF3 plays a critical role on GCK expression (Fig. 7E). Ethanol-induced GCK nitration and iNOS induction were not changed by ATF3(ΔC) (lane 7) or ATF3 siRNA (lane 8). In contrast to this, ATF3 strongly inhibited GCK nitration in ethanol-cotreated cells (lane 6), despite the fact that ethanol-induced iNOS expression did not change by ATF3, which may be due to the almost complete reduction of GCK protein expression by ethanol and ATF3 combination. Previous studies have demonstrated that protein nitration may cause a functional loss of many proteins through inhibition of critical Tyr residues on the nitrated proteins (47). GCK activity to convert glucose to glucose-6-phosphate was also inhibited by ethanol or SIN-1, which was reversibly restored by l-NMMA, UA, and deferoxamine (Fig. 8A). However, GCK inactivation induced by ethanol or SIN-1 was not implicated in the S-nitrosylation of GCK, because DTT had little effect on the inhibition of GCK activity induced by ethanol or peroxynitrite. In addition, the interaction of immunoprecipitated GCK with pBad (Fig. 8B) and GCK translocation into the mitochondria fraction (Fig. 8, C and D) were determined by peroxynitrite-mediated GCK nitration. Moreover, protein nitration may also cause a functional loss of many proteins through rapid degradation (48). Our data also show that ethanol-mediated GCK nitration may be more susceptible to ubiquitination than the native proteins of control cells, resulting in degradation. The levels of GCK nitration and ubiquitination were concurrently increased in ethanol-treated cells, which was correlated with a reduction in GCK protein levels (Fig. 8, F and G), indicating that proteins nitrated by ethanol may be easily ubiquitinated and degraded. Our data indicate that tyrosine nitration is the predominant modification involved in GCK down-regulation and its inactivation (Fig. 9). However, the exact mechanism involved in GCK modification on Tyr residues by ethanol-generated peroxynitrite is still not clear. Further studies are needed to confirm which Tyr residues are involved in peroxynitrite-induced GCK down-regulation and its inactivation through subjection to ESI-MS. In addition, because antioxidant enzymes could be susceptible to the damaging effect of peroxynitrite (49), their inactivation by peroxynitrite may lead to the perturbation of the cellular antioxidant defense system and subsequently exacerbate the harmful effect of peroxynitrite as well as ROS. Also, protein damage by ROS usually results in enhanced proteolytic susceptibility caused by protein unfolding and increased accessibility of peptide bonds to proteases (50). Thus, it is possible that GCK inactivation by peroxynitrite-mediated nitration is at least in part responsible for the perturbation of cellular redox status and oxidative damage in chronic ethanol consumption.
In conclusion, we show for the first time that chronic ethanol consumption induces GCK down-regulation and inactivation by Tyr nitration of GCK, resulting in pancreatic β-cell apoptosis and dysfunction. The peroxynitrite-mediated GCK down-regulation or inactivation may induce the perturbation of glucose metabolism and cellular antioxidant defense mechanisms, increasing susceptibility to insulin resistance and T2D. Furthermore, peroxynitrite-generated ATF3 may serve as a potent upstream key regulator of GCK down-regulation and β-cell apoptosis.
This work was supported by Korea Science and Engineering Foundation Grant R04-2002-000-20112-0.

The on-line version of this article (available at http://www.jbc.org) contains supplemental Figs. S1–S4.
- T2D
- type 2 diabetes
- GCK
- glucokinase (hexokinase IV)
- ATF
- activating transcription factor
- ROS
- reactive oxygen species
- iNOS
- inducible nitric-oxide synthase
- 4-MP
- 4-methypyrazole
- UA
- uric acid
- l-NMMA
- Nγ-monomethyl-l-arginine
- PDX
- pancreatic duodenal homeobox
- GTT
- glucose tolerance test.
REFERENCES
- 1.Teli M. R., Day C. P., Burt A. D., Bennett M. K., James O. F. (1995) Lancet 346, 987–990 [DOI] [PubMed] [Google Scholar]
- 2.Dam-Larsen S., Franzmann M., Andersen I. B., Christoffersen P., Jensen L. B., Sørensen T. I., Becker U., Bendtsen F. (2004) Gut 53, 750–755 [DOI] [PMC free article] [PubMed] [Google Scholar]
- 3.Fueki Y., Miida T., Wardaningsih E., Ito M., Nakamura A., Takahashi A., Hanyu O., Tsuda A., Saito H., Hama H., Okada M. (2007) Clin. Chim. Acta 382, 71–76 [DOI] [PubMed] [Google Scholar]
- 4.Sebastian B. M., Nagy L. E. (2005) Am. J. Physiol. Endocrinol. Metab. 289, 1077–1084 [DOI] [PMC free article] [PubMed] [Google Scholar]
- 5.Kang L., Sebastian B. M., Pritchard M. T., Pratt B. T., Previs S. F., Nagy L. E. (2007) Alcohol Clin. Exp. Res. 31, 1581–1888 [DOI] [PubMed] [Google Scholar]
- 6.Conigrave K. M., Hu B. F., Camargo C. A., Jr., Stampfer M. J., Willett W. C., Rimm E. B. (2001) Diabetes 50, 2390–2395 [DOI] [PubMed] [Google Scholar]
- 7.Di Castelnuovo A., Costanzo S., Donati M. B., Iacoviello L., de Gaetano G. (2007) Nutr. Metab. Cardiovasc. Dis. 17, 561–564 [DOI] [PubMed] [Google Scholar]
- 8.Shaper A. G., Wannamethee S. G. (1998) Novartis Found. Symp. 216, 173–192 [DOI] [PubMed] [Google Scholar]
- 9.Tomie Furuya D., Binsack R., Onishi M. E., Monteiro Seraphim P., Fabres Machado U. (2005) Life Sci. 77, 1813–1824 [DOI] [PubMed] [Google Scholar]
- 10.Wei M., Gibbons L. W., Mitchell T. L., Kampert J. B., Blair S. N. (2000) Diabetes Care 23, 18–22 [DOI] [PubMed] [Google Scholar]
- 11.Roh W. G., Shin H. C., Choi J. H., Lee Y. J., Kim K. (2009) Alcohol 43, 643–648 [DOI] [PubMed] [Google Scholar]
- 12.Dembele K., Nguyen K. H., Hernandez T. A., Nyomba B. L. (2009) Cell Biol. Toxicol. 25, 141–152 [DOI] [PubMed] [Google Scholar]
- 13.Guichard C., Moreau R., Pessayre D., Epperson T. K., Krause K. H. (2008) Biochem. Soc. Trans. 36, 920–929 [DOI] [PubMed] [Google Scholar]
- 14.Elsner M., Tiedge M., Lenzen S. (2003) Diabetologia 46, 1713–1714 [DOI] [PubMed] [Google Scholar]
- 15.Strnad P., Omary M. B. (2009) Gastroenterology 136, 1502–1505 [DOI] [PubMed] [Google Scholar]
- 16.Walsh L., Hastwell P. W., Keenan P. O., Knight A. W., Billinton N., Walmsley R. M. (2005) Mutagenesis 20, 317–327 [DOI] [PubMed] [Google Scholar]
- 17.Shih D. Q., Stoffel M. (2002) Curr. Diab. Rep. 2, 125–134 [DOI] [PubMed] [Google Scholar]
- 18.Kim W. H., Lee J. W., Suh Y. H., Hong S. H., Choi J. S., Lim J. H., Song J. H., Gao B., Jung M. H. (2005) Diabetes 54, 2602–2611 [DOI] [PubMed] [Google Scholar]
- 19.Kim W. H., Lee J. W., Suh Y. H., Lee H. J., Lee S. H., Oh Y. K., Gao B., Jung M. H. (2007) Cell Signal. 19, 791–805 [DOI] [PubMed] [Google Scholar]
- 20.Chakrabarti S. K., Mirmira R. G. (2003) Trends Endocrinol. Metab. 14, 78–84 [DOI] [PubMed] [Google Scholar]
- 21.Kim S. Y., Kim H. I., Kim T. H., Im S. S., Park S. K., Lee I. K., Kim K. S., Ahn Y. H. (2004) J. Biol. Chem. 279, 30823–30829 [DOI] [PubMed] [Google Scholar]
- 22.Lee J. W., Kim W. H., Lim J. H., Song E. H., Song J., Choi K. Y., Jung M. H. (2009) Cell Signal. 21, 69–78 [DOI] [PubMed] [Google Scholar]
- 23.Wolfgang C. D., Liang G., Okamoto Y., Allen A. E., Hai T. (2000) J. Biol. Chem. 275, 16865–16870 [DOI] [PubMed] [Google Scholar]
- 24.Yang E. S., Park J. W. (2009) Biochimie 91, 1020–1028 [DOI] [PubMed] [Google Scholar]
- 25.Lee J. H., Yang E. S., Park J. W. (2003) J. Biol. Chem. 278, 51360–51371 [DOI] [PubMed] [Google Scholar]
- 26.Beck K. F., Eberhardt W., Frank S., Huwiler A., Messmer U. K., Mühl H., Pfeilschifter J. (1999) J. Exp. Biol. 202, 645–653 [DOI] [PubMed] [Google Scholar]
- 27.Romero-Puertas M. C., Laxa M., Mattè A., Zaninotto F., Finkemeier I., Jones A. M., Perazzolli M., Vandelle E., Dietz K. J., Delledonne M. (2007) Plant Cell 19, 4120–4130 [DOI] [PMC free article] [PubMed] [Google Scholar]
- 28.Ding S. Y., Tribble N. D., Kraft C. A., Markwardt M., Gloyn A. L., Rizzo M. A. (2010) Mol. Endocrinol. 24, 171–177 [DOI] [PMC free article] [PubMed] [Google Scholar]
- 29.Van den Berghe G. (2004) J. Clin. Invest. 114, 1187–1195 [DOI] [PMC free article] [PubMed] [Google Scholar]
- 30.Mishra D. P., Dhali A. (2007) Prostaglandins Other Lipid Mediat. 83, 75–88 [DOI] [PubMed] [Google Scholar]
- 31.Polikandriotis J. A., Rupnow H. L., Brown L. A., Hart C. M. (2007) Alcohol 41, 309–316 [DOI] [PMC free article] [PubMed] [Google Scholar]
- 32.Pan H., Sun R., Jaruga B., Hong F., Kim W. H., Gao B. (2006) Alcohol. Clin. Exp. Res 30, 1615–1623 [DOI] [PubMed] [Google Scholar]
- 33.Lee H. J., Oh Y. K., Rhee M., Lim J. Y., Hwang J. Y., Park Y. S., Kwon Y., Choi K. H., Jo I., Park S. I., Gao B., Kim W. H. (2007) J. Mol. Biol. 369, 967–984 [DOI] [PubMed] [Google Scholar]
- 34.Kim J. Y., Lee S. H., Song E. H., Park Y. M., Lim J. Y., Kim D. J., Choi K. H., Park S. I., Gao B., Kim W. H. (2009) Cell Signal. 21, 1758–1767 [DOI] [PMC free article] [PubMed] [Google Scholar]
- 35.Park S. W., Huq M. D., Hu X., Wei L. N. (2005) Mol. Cell Proteomics 4, 300–309 [DOI] [PubMed] [Google Scholar]
- 36.Cabrera-Valladares G., German M. S., Matschinsky F. M., Wang J., Fernandez-Mejia C. (1999) Endocrinology 140, 3091–3096 [DOI] [PubMed] [Google Scholar]
- 37.Kim W. H., Hong F., Jaruga B., Hu Z., Fan S., Liang T. J., Gao B. (2001) FASEB J. 15, 2551–2553 [DOI] [PubMed] [Google Scholar]
- 38.Jaeschke H., Gores G. J., Cederbaum A. I., Hinson J. A., Pessayre D., Lemasters J. J. (2002) Toxicol. Sci. 65, 166–176 [DOI] [PubMed] [Google Scholar]
- 39.Kim B. J., Hood B. L., Aragon R. A., Hardwick J. P., Conrads T. P., Veenstra T. D., Song B. J. (2006) Proteomics 6, 1250–1260 [DOI] [PMC free article] [PubMed] [Google Scholar]
- 40.Abdelmegeed M. A., Moon K. H., Hardwick J. P., Gonzalez F. J., Song B. J. (2009) Free Radic. Biol. Med. 47, 767–778 [DOI] [PMC free article] [PubMed] [Google Scholar]
- 41.Aulak K. S., Miyagi M., Yan L., West K. A., Massillon D., Crabb J. W., Stuehr D. J. (2001) Proc. Natl. Acad. Sci. U.S.A. 98, 12056–12061 [DOI] [PMC free article] [PubMed] [Google Scholar]
- 42.Djoussé L., Biggs M. L., Mukamal K. J., Siscovick D. S. (2007) Obesity 15, 1758–1765 [DOI] [PubMed] [Google Scholar]
- 43.Sagen J. V., Odili S., Bjørkhaug L., Zelent D., Buettger C., Kwagh J., Stanley C., Dahl-Jørgensen K., de Beaufort C., Bell G. I., Han Y., Grimsby J., Taub R., Molven A., Søvik O., Njølstad P. R., Matschinsky F. M. (2006) Diabetes 55, 1713–1722 [DOI] [PubMed] [Google Scholar]
- 44.Vaxillaire M., Cavalcanti-Proença C., Dechaume A., Tichet J., Marre M., Balkau B., Froguel P. (2008) Diabetes 57, 2253–2257 [DOI] [PMC free article] [PubMed] [Google Scholar]
- 45.Tejedo J. R., Cahuana G. M., Ramírez R., Esbert M., Jiménez J., Sobrino F., Bedoya F. J. (2004) Endocrinology 145, 2319–2327 [DOI] [PubMed] [Google Scholar]
- 46.Knight T. R., Kurtz A., Bajt M. L., Hinson J. A., Jaeschke H. (2001) Toxicol. Sci. 62, 212–220 [DOI] [PubMed] [Google Scholar]
- 47.Lee J. R., Kim J. K., Lee S. J., Kim K. P. (2009) Arch. Pharm. Res. 32, 1109–1118 [DOI] [PubMed] [Google Scholar]
- 48.Webster R. P., Roberts V. H., Myatt L. (2008) Placenta 29, 985–994 [DOI] [PMC free article] [PubMed] [Google Scholar]
- 49.Yang E. S., Lee J. H., Park J. W. (2008) Biochimie 90, 1316–1324 [DOI] [PubMed] [Google Scholar]
- 50.Kim S. Y., Kwon O. J., Park J. W. (2001) Biochimie 83, 437–444 [DOI] [PubMed] [Google Scholar]


