

Abstract
Adenosine 5′-triphosphate is a universal molecule in all living cells, where it functions in bioenergetics and cell signaling. To understand how the concentration of ATP is regulated by cell metabolism and in turn how it regulates the activities of enzymes in the cell it would be beneficial if we could measure ATP concentration in the intact cell in real time. Using a novel aptamer-based ATP nanosensor, which can readily monitor intracellular ATP in eukaryotic cells with a time resolution of seconds, we have performed the first on-line measurements of the intracellular concentration of ATP in the yeast Saccharomyces cerevisiae. These ATP measurements show that the ATP concentration in the yeast cell is not stationary. In addition to an oscillating ATP concentration, we also observe that the concentration is high in the starved cells and starts to decrease when glycolysis is induced. The decrease in ATP concentration is shown to be caused by the activity of membrane-bound ATPases such as the mitochondrial F0F1 ATPase-hydrolyzing ATP and the plasma membrane ATPase (PMA1). The activity of these two ATPases are under strict control by the glucose concentration in the cell. Finally, the measurements of intracellular ATP suggest that 2-deoxyglucose (2-DG) may have more complex function than just a catabolic block. Surprisingly, addition of 2-DG induces only a moderate decline in ATP. Furthermore, our results suggest that 2-DG may inhibit the activation of PMA1 after addition of glucose.
Keywords: ATP, Cell Metabolism, Fluorescence, Glycolysis, Yeast, Aptamers, Nanobiosensors, Oscillations, Deoxyglucose
Introduction
Adenosine 5′-triphosphate (ATP) is a highly important biomolecule in living cells: It plays a central role in cell energy metabolism and also serves directly or indirectly in a number of cell signaling processes (1–3). The intracellular concentration of ATP is believed to oscillate in some eukaryotic cells, e.g. in β-cells (4) and in cells of the yeast Saccharomyces cerevisiae (5). However, changes in cytoplasmic ATP concentration with high time resolution have so far only been measured in a few circumstances (6, 7), mainly because methods for such continuous measurements are not generally available, or, in the case of NMR, require very high densities of cells or tissue (8).
The lack of time-resolved measurements has prohibited the understanding of how the level of ATP and other intracellular metabolites are regulated in the cell and how ATP in turn regulates a number of cellular processes. Most current measurements of ATP in cells use extraction of the cell content and measure the concentration of ATP in the extract by various off-line methods such as HPLC (9), luciferase (10), or other enzyme-based methods (11). A few protein-based sensors exist (6, 7, 12–14), which in principle allow for time-resolved measurements of intracellular ATP or ADP, but some of these methods entail expression of the sensor molecule in situ, which is not always possible. Hence, although it is expected that the intracellular concentration of ATP is anything but stationary, this has not been verified by real-time measurements, except in a few cases where rapid extraction and subsequent off-line measurements of ATP were performed (11).
In suspensions of the yeast S. cerevisiae glycolysis is oscillating under anaerobic or semi-anaerobic conditions (5). The latter entails that cyanide is added to inhibit respiration. Oscillations only occur when the cell density is beyond a certain critical value (15, 17–19). The oscillations in glycolysis are usually monitored as oscillations in the autofluorescence of NADH, but also time-resolved oscillations in CO2 evolution (20), mitochondrial membrane potential (21, 22), and intracellular pH (pHi)2 (16) have been recorded. The oscillations in mitochondrial membrane potential and in intracellular pH were suggested to be caused by oscillating activities of the F0F1 ATPase and the plasma membrane ATPase (PMA1) caused by oscillations in intracellular ATP (16). In addition, Richard et al. (11) demonstrated oscillations in a number of glycolytic intermediates, including ATP, ADP, and AMP, by quenching yeast cells and extracting their cell content. However, these measurements had a low time resolution (4–5 s) and were inherently noisy because of the complex procedures in extraction and subsequent off-line measurements of metabolites. Nevertheless, they were able to show that most glycolytic intermediates seem to oscillate with different phases compared with NADH. However, Richard et al. (11) only analyzed one situation of oscillation.
Because of the lack of time-resolved measurements of glycolytic intermediates in a number of different situations and because it has been suggested that also enzymes outside of the glycolytic pathway influence the oscillations (16) the mechanism responsible for the oscillations is still not clear. Analyses of mathematical models of yeast glycolysis suggested that the oscillations may be ascribed to the regulatory properties of phosphofructokinase and the ATP-ADP-AMP system through its interactions with hexokinase, glycogen synthesis, and unspecific ATP consumption (23, 24).
To further examine how the concentration of ATP varies in a yeast cell under conditions where glycolysis is oscillating we constructed a new type of ATP nanobiosensor and inserted it into cells of the yeast S. cerevisiae. Our results show that the intracellular ATP concentration is indeed oscillating, but the amplitude of the oscillations is lower than suggested by previous experiments using quenching of cells and extraction of cell content (11). Furthermore, our measurements of intracellular ATP also corroborate an earlier suggestion that membrane-bound ATPases such as the mitochondrial F0F1 ATPase and the plasma membrane proton-translocating ATPase (PMA1) play important roles in regulating the glycolytic oscillations. At the same time, the activities of these ATPases are rapidly switched on when glucose is added and switched off again within seconds after glucose has been exhausted. Finally, our results suggest that 2-deoxyglucose, an inhibitor of glycolysis, also inhibits the activity of PMA1.
EXPERIMENTAL PROCEDURES
Materials
The DNA library and PCR primers were purchased from Integrated DNA Technologies (Leuven, Belgium). The aptamer switch probe was synthesized by VBC Biotech (Vienna, Austria). Yeast hexokinase was obtained from USB biotech (Staufen, Germany). Streptavidin-coated and hydroxyl activated SiMAG magnetic beads were purchased from Chemicell (Berlin, Germany). 8-[(6-amino)hexyl]-amino-adenosine-5′-triphosphate sodium salt was purchased from Jena Bioscience (Jena, Germany). Taq polymerase was obtained from Fermentas (St. Leon-Rot, Germany). The fluorescent probes Alexa Fluor 488, Texas Red Dextran, 3,3′-diethyloxacarbocyanine iodide (DiOC2(3)) and 2′,7′-bis (2-carboxyethyl), 5 (and -6) carboxyfluorescein (BCECF) were obtained from Molecular Probes (Eugene, OR), and the ATP determination kit was obtained from Biaffin (Kassel, Germany). All other reagents were purchased from Sigma (Munich, Germany).
Preparation of ATP-immobilized Magnetic Beads
Hydroxyl-coated magnetic beads (500 μl, 25 mg) were washed with 0.2 m NaHCO3, pH 8.2 (2 × 750 μl) and suspended in 0.2 m NaHCO3, pH 8.2 (625 μl). 5.0 m CNBr in acetonitrile (150 μl) was added and left to react for 10 min at 0 °C. The beads were then washed with 10 mm sodium phosphate buffer pH 7.25 (2 × 750 μl) and resuspended in 10 mm sodium phosphate buffer, pH 7.25. 50 μl of 10 mm 8-[(6-amino)hexyl]-amino-adenosine-5′-triphosphate sodium salt in ddH2O was added and shaken for 4 h at 30 °C. The magnetic beads were again washed with 10 mm sodium phosphate buffer, pH 7.25 (2 × 750 μl) and resuspended in 500 μl of 10 mm sodium phosphate buffer pH 7.25. The ATP-coated magnetic beads (ATP-beads) were stored in solution at 4 °C until use.
In Vitro Selection
The selection method was similar to Flu-Mag Selex (25). The single-stranded DNA (ssDNA) library, containing 44 random nucleotides flanked by fixed regions (GGCGGCGATGAGGATGAC-N44-ACCACTGCGTGACTGCC), was amplified by PCR. The 100-μl PCR mixture contained 0.2 μm of each primer (Primer 1: Biotin-GGGCAGTCACGCAGTGGT; Primer 2: GGCAGTCACGAGTGGT), 0.2 μm dNTP mix, 5 mm MgCl2 and 1 unit of Taq polymerase. The first cycle is started with 10 pmol of DNA library. PCR consisted of 94 °C for 30 s, 60 °C for 30 s, and 72 °C for 30 s for various number of cycles. The non-biotinylated ssDNA strand was separated from the other strand using streptavidin-coated magnetic beads (26).
The SELEX procedure was completed in 14 cycles. The procedure was designed for ATP specific enrichment by using negative selection with naked beads followed by positive selection with ATP beads for 10 rounds. A negative-positive counter selection of 4 additional rounds was carried out to eliminate sequences binding adenine nucleotides other than ATP. The negative counter selection was achieved by eluting ssDNA library members bound to the ATP beads with a mixture of ADP, AMP, and GTP, and the positive counter selection with 4 mm ATP. In each cycle, ∼6.6 × 10¹⁰ naked beads or ATP-beads were incubated with the ssDNA library in selection buffer (20 mm phosphate buffer, pH 7.4; 140 mm KCl: 10 mm NaCl; 5 mm MgCl2, and 5.5% (w/v) glucose) at 25 °C for 30 min. Washing steps were performed at least four times with the same buffer and the library members bound to the beads were eluted by alkaline treatment in the first 10 cycles. In counter selections, the ATP beads were incubated as described above with ssDNA library and the bound sequences were eluted with 4 mm ATP in selection buffer by incubating for 15 min. The 14th pool sequences were cloned into pCR4 plasmids (Invitrogen, TOPO), and 42 individual colonies were randomly selected and sequenced. A similarity search analysis by MEME (Multiple Em for Motif Elicitation, version 4.3.0 showed that 8 of 42 sequences shared a consensus sequence (TAGTAAGA) indicating a possible binding site for ATP (see supplemental Table S1). These sequences were evaluated for affinity by using ATP-beads. The bound ssDNA library was eluted with 4 mm ATP and it was quantified in a spectrofluorometer for fluorescein emission at 520 nm after excitation at 480 nm using the oli-green DNA quantification kit (27) (Invitrogen, UK). Sequences S10 and S24 were found to have affinity for ATP (see supplemental Fig. S1A). Further evaluations for ATP, ADP, and AMP elution patterns (performed like positive counter selection procedure) indicated that S10 has better affinity for ATP compared with ADP and AMP (see supplemental Fig. S1B).
Surface Plasmon Resonance Analysis
The aptamer S10 was chosen for further characterization, as it had specific binding affinity for ATP based on ATP bead binding assays. The affinity constant (KD) was determined using surface plasmon resonance (SPR) analysis (Biacore 3000, GE Healthcare, Sweden). The biotinylated S10 sequence was immobilized on a streptavidin-coated chip (SA chip, GE Healthcare) to about 1000 RU. The running buffer and binding buffer was the same as the selection buffer but without glucose. Any nonspecific binding to the reference cell was subtracted from the sample flow cell response. A concentration series of ATP was assayed, between 0.5–3 mm. The SPR signals were negative, but concentration dependent and analysis of mirror-imaged signals fitted to a single binding model. Similar negatively correlated results were previously reported for small sugar analytes, and the phenomenon was explained by ligand-induced structural changes (28). KD values were determined from equilibrium binding responses to fit the curves using 1:1 binding by Biaevaluation 4.1 (see supplemental Fig. S2).
Aptamer Switch Probe
The aptamer sequence S10 was converted into a switch probe by adding a polyethylene glycol spacer (36 ethylene glycol molecules) at the 3′-end with an extension of seven nucleotides, which are complementary to the 5′-end of the aptamer sequence using the principle proposed by Tang et al. (29). The quencher (Black Hole 1) was attached at the 5′-end and a fluorophore (Alexa Fluor 488) at the 3′-end. The reverse positions of quencher and fluorophore were also tested and similar levels of fluorescence signals were obtained in ATP titrations. The sequence of the new aptamer switch probe was as follows: BlackHole1-GTAGTAAGAACTAAAGTAAAAAAAAAATTAAAGTAGCCACGCTT-[CH2-CH2-O]36-TTACTAC-AlexaFluor488.
Aptamer-based Nanobiosensor Preparation
Polyacrylamide nanoparticles were prepared by an inverse micro-emulsion polymerization reaction modified from Daubresse et al. (30) in the presence of the ATP aptamer switch probe. Briefly, 3.08 g of dioctyl sulfosuccinate (AOT) and 1.08 g of Brij 30 were dissolved in 43 ml of hexane and deoxygenated by sonication for 1 h. Meanwhile 1.35 g of acrylamide and 0.4 g of N,N-methylenebisacrylamide were dissolved in 4.5 ml of 10 mm sodium phosphate buffer, pH 7.25 and 280 μl of a 100 μm aptamer switch probe solution and 15 μl of 50 mg/ml Texas Red Dextran were added. 2.0 ml of this solution was added dropwise to the hexane solution and left for 20 min under argon to form the microemulsion. Polymerization was initiated by addition of 50 μl of a 10% (w/v) solution of sodium bisulphite and allowed to proceed for 3 h. The hexane was removed in vacuo and the nanosensors were precipitated by the addition of 100 ml ethanol. The suspension was transferred to an Amicon ultrafiltration cell model 2800 (Millipore Corp., Bedford) and filtered through a 100 kDa filter and washed with 4 × 100 ml of ethanol to remove unreacted monomers and surfactants. The particles were resuspended in 50 ml of ethanol, filtered (0.025 μm nitrocellulose filter membrane) and dried in vacuo. Vacuum-dried particles were kept at −20 °C until they were used in experiments. Nanoparticle size was determined by dynamic light scattering method (15 milliwatt laser, incident beam 633 nm; Brookhaven Instruments Corporation, Holtsville, NY) in a non-negative least square curve fit analysis. The measurements were performed in triplicate at room temperature.
Fluorescence Measurements
All fluorescence experiments were performed as triplicates in an Edinburgh FL 920 spectrofluorometer using a 2 ml sample cell with constant stirring and temperature control (Quantum Northwest, WA). The samples contained 0.25 mg/ml of nanoparticles with embedded aptamers or yeast cells (10% wet weight) with inserted nanosensors. The change in fluorescence signal from Texas Red was measured at 605/3 nm with excitation at 580/3 nm, whereas the fluorescence by Alexa Fluor 488 was measured at 520/3 nm with excitation at 470/3 nm. The temperature around the sample cell was maintained at 25.00 ± 0.01 °C. Titration experiments were performed in selection buffer (20 mm phosphate buffer, pH 7.4; 140 mm KCl: 10 mm NaCl; 5 mm MgCl2).
Sensor Response Time and ATP Binding Curves
The sensor response time is fast, i.e. less than a second. Supplemental Fig. S3A shows the change in fluorescence upon addition of ATP to a solution containing the ATP sensor. We note that the response to addition of ATP is almost immediate. We determined the response time to changes in ATP concentration (10–90%) to be less than a second (data not shown). Supplemental Fig. S3B shows the binding curves for ATP and ADP, respectively. Note that the nanosensor is not absolutely specific for ATP, but the maximum fluorescence at saturation of the sensor is lower for ADP compared with ATP and the binding of ADP is weaker compared with the binding of ATP. The nanosensor does not bind AMP or any other purine or pyrimidine nucleotide as illustrated in supplemental Fig. S3B. The fluorescence signals from Alexa Fluor 488 (F520) were normalized to the fluorescence of Texas Red (F605) by Equation 1.
 |
Titrations were analyzed by curve fitting to a three parameter sigmoidal Equation 2 by SigmaPlot (Version 11, San Jose, CA),
 |
where A represents either ATP or ADP and a, b, and x0 are constants. For ATP a, b, and x0 were estimated as 2.27, 1.45 mm, and 3.22 mm, respectively, whereas for ADP they were estimated as 1.55, 1.85, and 4.37 mm, respectively (supplemental Fig. S3B). Thus, from any measured fluorescence signal φmeas (F520/F605 − 1) from the sensor in a mixture of ATP and ADP we can determine the concentration of ATP using Equation 3,
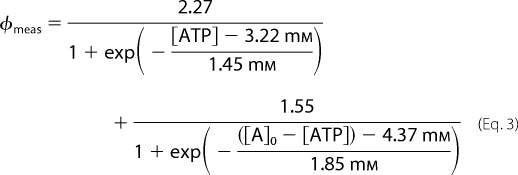 |
where [A]0 is the total concentration of ADP and ATP. It is fairly straightforward to solve this nonlinear equation with only one unknown, namely [ATP]. Alternatively, we may use φmeas to determine the concentration of ADP using Equation 4,
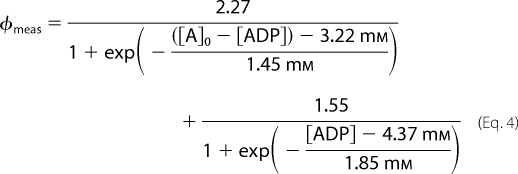 |
where [A]0, has the same meaning as above. However, it should be noted that to determine the concentration of ATP or ADP we must know [A]0. Equations 3 and 4 were solved using the program NSOLVE in Mathematica (Wolfram Research Europe). Note that even though the sensor binds both ATP and ADP Equations 2 and 3 can be used to determine the ATP concentration even in mixtures of ATP and ADP where the concentration of ATP is much lower than the concentration of ADP. To illustrate this we have plotted φmeas for mixtures of ATP and ADP with different ratios of the two nucleotides, but where the total adenine nucleotide concentration ([ATP]+[ADP]) is fixed at 2.5 mm. The results are presented in supplemental Fig. S4. We note that even when ADP is in excess our ATP nanosensor determines the ATP concentration with a reasonable accuracy. However, it should also be noted that at very low ATP concentrations the accuracy of the sensor is lower than at high concentrations.
Measurements of Kinase Activity
A futher test that the sensor does indeed measure the ATP concentration in real time was to record an ATP decline caused by the transfer of phosphate from ATP to glucose catalyzed by the enzyme hexokinase. A typical experiment is shown in supplemental Fig. S5. We note that after addition of hexokinase to a solution containing the nanosensor, ATP and glucose all the ATP is converted into ADP. This experiment confirms that the nanosensor is capable of providing a fairly accurate estimate of the ATP concentration when ADP is in excess of ATP. From ATP progress curves like that in supplemental Fig. S5 we can estimate the initial rate of ATP consumption and plot it against the initial ATP concentration. We observed that the plot is hyperbolic, signifying Michaelis-Menten kinetics with respect to ATP (data not shown), and we estimated a Km for ATP of 0.3–0.5 mm in good agreement with previous estimates (31). Measurements of NADH autofluorescence were done with excitation at 366/3 nm and emission at 450/10 nm.
Luciferase-based Measurements of Intracellular ATP
Measurements of intracellular ATP using the luciferase assay were made on cell extracts as described previously (16).
Mass Spectrometric Measurements of Ethanol Production
Measurements of the production of ethanol were conducted by use of membrane inlet mass spectrometry, as described in Poulsen et al. (20).
Measurements of Mitochondrial Membrane Potential
Measurements of the mitochondrial membrane potential in the yeast cells were done in the presence of 5 μm DiOC2(3) as described previously (21). Excitation wavelength was 488/3 nm and emission at 600/3 nm.
Glucose-induced Medium Acidification
To measure proton pumping from PMA1 activity the cells were first starved for 3 h in 100 mm phosphate buffer and then stored on ice for 2–3 h to reduce metabolic activity to a minimum. Then they were washed twice in distilled water and resuspended in 250 mm sorbitol to a density of 2% wet weight. The initial pH was adjusted with HCl or NaOH to pH 5.1 and 30 mm glucose was added to the suspension. The proton pumping was measured as the pH change after addition of glucose. pH was measured either using a pH-meter or by recording the fluorescence of 2′,7′-bis (2-carboxyethyl), 5-(and -6)-carboxyfluorescein (BCECF) (excitation 470/3 nm, emission 520/3 nm).
Measurements of Intracellular pH
Measurements of the intracellular pH (pHi) in a suspension of yeast cells using the pH-sensitive dye 5-(and 6-)-carboxyfluorescein diacetate succinimidyl ester (CFDA-S.E.) were performed as described previously (16).
Cell Growth and Insertion of Nanosensors
Cells of the yeast S. cerevisiae diploid strain X2180 were grown and harvested as described previously (20). The starved cells were suspended in 50 mm sodium phosphate buffer, pH 6.8 and stored at room temperature before use. Electroporation of ATP nanosensors into yeast cells was performed using sensors that had previously been treated with 100 units/ml of DNase 1 to remove excess nanosensor exposed to the sensor surface. Electroporation was perfomed as described previously (22) in a 1 m sorbitol solution containing 300 mm KCl and 5 mm MgCl2 and ATP sensors corresponding to 50 mg/ml.
RESULTS
A New ATP Nanobiosensor to Measure Intracellular ATP
In a previous report we described a new type of nanobiosensor design which can be used to measure intracellular metabolites, e.g. ATP (32). The nanosensor is based on an aptamer recognition element which has been turned into a signaling molecule using an aptamer switch probe (ASP) design (16). An aptamer is a single-stranded small oligonucleotide selected in vitro, which specifically can bind a target with a pre-chosen affinity (33, 34). Unfortunately the nanobiosensor reported in Ref. 32 was not specific for ATP and hence it was only possible to determine the total intracellular concentration of adenine nucleotides ([ATP]+[ADP]+[AMP]), which does not change with time. In the present study we have selected a new aptamer which has specificity for ATP in the physiological range, i.e. from 1 to 5 mm. Like the previous nanobiosensor the aptamer was converted into an ASP and encapsulated in a polyacrylamide particle with a diameter of ∼30 nm. A reference fluorophore (Texas Red Dextran) was encapsulated in the particles together with the ASP. The particles are porous such that small molecules like ATP can diffuse freely between the particle matrix and the environment. On the other hand, the ASP, which has a molecular weight of 16,750 g/mol, and Texas Red Dextran (MW 10,000 g/mol) are retained in the matrix and molecules of similar size or larger cannot enter the particles. Thus, the encapsulation of the ASP serves to protect the aptamer against e.g. nucleases in the cellular environment. The ASP used is a molecular beacon-type probe containing the aptamer sequence and a complementary hairpin-forming sequence separated by a polyethylene glycol linker (29, 32). A fluorophore (Alexa Fluor 488) and a quencher (Black Hole 1) are covalently attached to the two ends of the sequence. The binding of ATP disrupts the hairpin loop resulting in a rearrangement of the structure separating the fluorophore from the quencher.
Measurements of Intracellular ATP in Yeast Cells with an Oscillating Glycolysis
We inserted the ATP sensor into yeast cells using electroporation (22) to measure changes in the intracellular concentration of ATP when glycolysis is oscillating. Fig. 1, A and B show confocal images of yeast cells with ATP sensors inserted. The green color in Fig. 1A corresponds to the Alexa Fluor 488 attached to the aptamer, while the red color in Fig. 1B is from the reference dye (Texas Red). The fluorescence spectra from Alexa Fluor and Texas Red are shown in Fig. 1D, whereas Fig. 1C shows a bright field image of the cells. The even distribution of nanosensors confirms a cytoplasmic location. In our previous report (32) we have excluded that the ASP is released from the nanoparticles and broken down by nucleases in the cytoplasm by the fact that insertion of control nanoparticles with a similar switch probe containing an unresponsive nucleotide sequence instead of the aptamer showed mainly fluorescence from the reference dye. Furthermore, it was confirmed that the switch probe in the control nanoparticle is functional, i.e. that segregation of the fluorophore and the quencher can take place by melting temperature analysis, which showed that the nonresponsive DNA switch probe and the ASP have almost identical melting temperatures (32). We note that the fluorescence ratio of Alexa Fluor 488 over Texas Red in the cells with the nanosensor (Fig. 1D) evidences an ATP concentration of around 2.6 mm. The corresponding ratio in the cells with control nanoparticles indicated no opening of the hairpin (data not shown). It should be noted here that, even though the cells were always starved for the same amount of time (3 h) before use, the level of ATP after starvation was highly variable, i.e. between 1.5 mm and 2.8 mm (n > 10).
FIGURE 1.

Insertion of nanosensors into yeast cells. Confocal microscopy and bright field pictures of cells with inserted sensors. A and B, fluorescence of Alexa Fluor 488 and Texas Red, respectively. C, bright-field picture. The graphs in D show the fluorescence spectra of the two dyes. The ratio of F520/F605 was estimated as 2.10 ± 0.15 (n = 3), corresponding to an intracellular concentration of 2.6 mm, if we assume total concentration of ATP and ADP of 3.6 mm (11, 32).
The main purpose of the present study is to measure time resolved ATP concentration in intact yeast cells where we have induced oscillations in glycolysis by adding first glucose and then KCN (5) to the starved cells with nanosensors incorporated. Model studies (23, 24) have predicted that the intracellular concentration of ATP should oscillate, and this is supported by measurements on cell extracts of quenched cells (11). Interestingly, it is not possible to observe an oscillating glycolysis in a single isolated yeast cell (35), but observations of such oscillations entail that the yeast cells are in dense suspensions of cells (15, 17, 18). Fig. 2 shows oscillations in NADH fluorescence and in intracellular ATP concentration. The ATP concentration is determined from the fluorescence of the incorporated ATP nanosensor after subtraction of the fluorescence of cells containing “empty” nanoparticles, i.e. polyacryamide particles containing only the reference fluorophore. The resulting difference is then normalized to the signal from the reference fluorophore and the intracellular concentration of ATP is determined using Equation 3, assuming that the concentration of ATP plus the concentration of ADP is equal to 3.6 mm (11, 32). The original fluorescence data are presented in supplemental Fig. S6. Fig. 2A shows the NADH fluorescence and the determined intracellular concentration of ATP. Fig. 2B is a magnification of the data in Fig. 2A, while Fig. 2C represents a phase plot of NADH fluorescence against ATP concentration after removing the overall slow decrease in [ATP]. Although fluctuations in intracellular ATP have been determined earlier by quenching cells (11), Fig. 2 represents the first on-line measurement of oscillations in ATP concentration. As expected the frequency of the ATP oscillations is the same as the frequency of the NADH oscillations. While the ATP oscillations have similar form and amplitude as predicted by models of glycolysis (23) the recorded amplitudes of ATP oscillations (∼0.075 mm) are much smaller than those estimated using cell extracts (11) (∼ 0.5 mm). Furthermore, contrary to our expectation that the average ATP concentration would be relatively stationary, the measured intracellular ATP concentration, slowly declines following addition of glucose and cyanide from about 2.5 mm to below 1 mm and then starts to increase when glucose is nearly exhausted. In order to test if this gradual decrease in ATP was genuine we performed measurements of the intracellular ATP concentration at various times before and after addition of glucose by quenching the cells and measuring ATP in cell extracts using a luciferase assay. These measurements are included in the ATP graph in Fig. 2A, and show good agreement with the time-resolved measurements using the ATP-sensor. The phase plot of ATP concentration versus NADH fluorescence (Fig. 2C) showed a phase shift of 150–180° between NADH and ATP. Even though the phase plot is constructed from two separate experiments we obtained the same phase plot of ATP and NADH in all our experiments, probably because we maintained a strict control of temperature, giving highly reproducible experiments.
FIGURE 2.

Oscillations in intracellular NADH and ATP. A, time-resolved NADH fluorescence and ATP concentration. The ATP concentration was determined from the ratio F520/F605 after subtraction of the signals from cells with incorporated “empty” nanoparticles. The concentration of ATP was then calculated using Equation 3, assuming a total concentration of ADP and ATP of 3.6 mm (11). The points and standard deviations (n = 3–5) in the ATP graph represent off-line measurements of intracellular ATP made by quenching the cells and measuring the ATP content of the cell extract using a luciferase assay. B, magnification of the measurements in A. C, phase plot of ATP concentration versus NADH fluorescence after removing the slow decline in ATP concentration.
Fig. 3 shows a similar experiment to that presented in Fig. 2, but here we have included measurements of ethanol production (Fig. 3A) and the mitochondrial membrane potential (Fig. 3D). Although the initial ATP concentration is higher than that shown in Fig. 2 we note the same trend, namely that the ATP concentration is slowly decreasing after an initial brief rise until glucose is exhausted (ethanol production stops) and then slowly increases again. Measurements of ATP over a longer time scale show that the ATP concentration increases to the initial level before the addition of glucose (data not shown). The slow decrease in intracellular ATP following addition of glucose and KCN was observed in all experiments showing an oscillating glycolysis. The slow decline in ATP concentration is a result of the ATP consumption being greater than the ATP production by glycolysis. Previous experiments suggested that the two main ATP consuming processes are ATP hydrolysis by the mitochondrial F0F1 ATPase and the plasma membrane ATPase (PMA1) (16). ATP hydrolysis by the F0F1 ATPase is associated with pumping of protons out of the mitochondria which again results in the generation of a mitochondrial membrane potential (16, 21) and because the intracellular ATP concentration is oscillating the mitochondrial membrane potential is oscillating too as shown in Fig. 3D. It is noteworthy that after glucose is used up this membrane potential only slowly reverts to its original value before addition of glucose and cyanide.
FIGURE 3.

Time-resolved measurements of glycolytic flux, intracellular ATP, NADH, and mitochondrial membrane potential in a suspension of yeast cells. A, glycolytic flux measured as the production of ethanol using membrane inlet mass spectrometry. B, intracellular ATP concentration measured using the ATP nanosensor. C, NADH autofluorescence. D, mitochondrial membrane potential was measured as the fluorescence of the dye DiOC2(3). Experimental conditions are as described in the legend of Fig. 2.
Effect of Inhibition of F0F1 ATPase on Intracellular ATP
In a previous report we obtained evidence that the activities of F0F1 ATPase and PMA1, are highly important for the glycolytic oscillations to occur. The slow decline in intracellular ATP observed in Figs. 2A and 3B should represent the difference in the mean ATP production by glycolysis and the mean consumption of ATP because of these two ATPases. To determine what effect a decrease in ATPase activity from the F0F1 ATPase would have, we measured the intracellular ATP concentration after addition of sodium azide, which is an inhibitor of the F0F1 ATPase (36). The result is shown in Fig. 4. We note that the oscillations have disappeared and that the decline in ATP concentration is slower than in the control. This result is consistent with a decreased F0F1 ATPase activity. It is worth noting here that measurements of the ethanol production following addition of 30 mm glucose and 5 mm KCN to yeast cells inhibited by azide showed a normal glycolytic flux (data not shown).
FIGURE 4.

Effect of azide on the dynamics of intracellular ATP in yeast cells. Yeast cells were incubated for 10 min in the presence or absence (control) of 2 mm sodium azide before addition of 30 mm glucose and 5 mm KCN as indicated by the arrows. Experimental conditions are as described in the legend of Fig. 2.
Effect of Iodoacetate and 2-Deoxyglucose on Intracellular ATP
Next, we tested the effect of the glycolytic inhibitors iodoacetate and 2-DG on the intracellular ATP concentration after inducing glycolysis by addition of glucose and KCN to a suspension of yeast cells. Iodoacetate is an inhibitor of glyceraldehyde-3-phosphate dehydrogenase (37). 2-DG is phosphorylated in a reaction catalyzed by hexokinase (38). It is generally assumed that the 2-DG-6-phosphate formed cannot be metabolized further, and hence ATP production by the lower part of glycolysis is inhibited, resulting in a decrease in glucose consumption and accumulation of intracellular glucose (22, 38). Addition of 20 mm iodoacetate to a suspension of yeast cells with an oscillating glycolysis resulted in a fast decline in intracellular ATP and also in a decrease in the NADH fluorescence corresponding to a slow oxidation of NADH as shown in Fig. 5. At the same time the ADP concentration rises to a maximum of 3.6 mm (Fig. 5B). Measurements of intracellular ATP using the luciferase assay confirmed that the ATP concentration was indeed zero after addition of 20 mm iodoacetate (n = 3). The amplitude of the ATP oscillations after addition of iodoacetate may be an overestimate as a small change in φmeas may result in fairly large changes in ATP concentration when [ATP] < 0.5 mm (see supplemental Fig. S4). It is interesting, though, that the rapid decline in intracellular ATP is not accompanied by a similar rapid decline in mitochondrial membrane potential (16).
FIGURE 5.

Effect of iodoacetate on the dynamics of NADH and intracellular ATP in yeast cells with an oscillating glycolysis. Time-resolved NADH fluorescence, ATP, and ADP concentrations before and after addition of 20 mm iodoacetate to the yeast suspension. Iodoacetate was added at the indicated arrow. The ADP concentration shown as a dashed curve was determined using Equation 4 instead of Equation 3, again assuming a total concentration of ADP and ATP ([A]0) of 3.6 mm. Experimental conditions are as described in the legend of Fig. 2.
Although iodoacetate and 2-DG are both considered as general inhibitors of glycolysis, 2-DG had a different effect on the yeast cells. Fig. 6 shows recordings of NADH fluorescence and intracellular ATP concentration in yeast cells incubated for 10 min with 5 mm 2-DG. Note that glucose and cyanide do not induce oscillations in 2-DG-treated cells, but the concentration of ATP does not decrease to zero as might be expected. Instead the ATP concentration, which is initially lower than in the control experiment without 2-DG, decreases less rapidly and it does not start to rise again. Again, an independent determination of the intracellular ATP concentration using extraction of the cell content and measuring the amount of ATP in the extract showed a good agreement with the ATP concentration measured with the ATP nanosensor (Fig. 6). To investigate this effect further we added 30 mm 2-DG to a suspension of yeast cells with an oscillating glycolysis (Fig. 7). We note that the oscillations in NADH and ATP stop almost immediately and the slow decline in intracellular ATP also stops. Although 2-DG does not induce a decline in intracellular ATP as might be expected, we were able to verify that 2-DG does indeed inhibit glycolysis. Mass spectrometric measurements showed that while 20 mm iodoacetate blocks the rate of ethanol production 100% only a 40 and 55% decline in ethanol production is observed with 5 mm and 20 mm 2-DG, respectively (supplemental Fig. S7). It is also interesting to note that incubation of yeast cells with 5 and 20 mm 2-DG, respectively, results in an increase in the mitochondrial membrane potential (supplemental Fig. S8) consistent with an increase in intracellular ATP concentration compared with the control. The almost stationary concentration of intracellular ATP observed after addition of 2-DG (Figs. 6 and 7) suggests that the ATP production rate is almost the same as the ATP consumption rate. As the rate of glycolysis is inhibited by 2-DG the rate of ATP consumption must be similarly reduced. However, the rate of ATP hydrolysis by the F0F1 ATPase has not been decreased as evidenced by the increase in mitochondrial membrane potential in the presence of 2-DG (supplemental Fig. S8). Therefore an obvious reaction to investigate is the ATP hydrolysis catalyzed by PMA1. We therefore measured the glucose-induced medium acidification, which provides a relative measure of the proton pumping by PMA1 (39). Fig. 8 shows the effect of 2-DG on the medium acidification. We note that in the presence of 2-DG the decrease in extracellular pH is slower compared with the control. In the presence of 5 mm 2-DG the relative rate of acidification is 0.62 ± 0.06 (n = 4) of the control rate without 2-DG (which is set to 1). Finally, we measured the effect of 2-DG on the intracellular pH (pHi) by incubating yeast cells with the dye CFDA-S.E. as described previously (16). The results are shown in supplemental Fig. S9. When glycolysis is initiated by addition of glucose and KCN pHi first shows a fast rise. After a few hundred seconds pHi peaks and then starts to decline slowly. Small oscillations of pHi can also be observed. The initial fast rise is caused by the pumping of protons out of the cell, catalyzed by PMA1, while the slow decline is mainly caused by acidification of the cytoplasm because of the formation of bicarbonate (16). We note that in the cells treated with 2-DG pHi is initially much lower than in the control cells without 2-DG. Furthermore, the initial rise in pHi is much slower. The slope of the initial rise in pHi was 5.1 (±0.5) × 10−3 s−1 (n = 5) in the control cells and 3.0 (±0.2) × 10−3 s−1 and 1.9 (±0.4) × 10−3 s−1 in the cells treated with 5 mm 2-DG and 20 mm 2-DG, respectively (n = 3). These results are in good agreement with those obtained in the medium acidification experiments. Finally, the slow decline in pHi is less pronounced in the presence of 2-DG because of the overall reduction in the glycolytic flux and hence also the rate of formation of bicarbonate.
FIGURE 6.

Effect of 2-DG on the dynamics of NADH and intracellular ATP following addition of glucose and KCN to a suspension of yeast cells. The cells were incubated with 5 mm 2-DG for 10 min before addition of 30 mm glucose and 5 mm KCN as indicated on the graph. The point at time t = 2400 s and standard deviations (n = 3) in the ATP graph represents an off-line measurement of intracellular ATP made by quenching the cells and measuring the ATP content of the cell extract using a luciferase assay. Experimental conditions are as described in the legend of Fig. 2.
FIGURE 7.

2-DG inhibits the slow decline in intracellular ATP. Oscillations in glycolysis were induced by adding first 30 mm glucose and then 5 mm KCN to a 10% (w/v) suspension of yeast cells with incorporated ATP nanosensor. After ∼10 min 30 mm 2-dexoyglucose was added to the suspension. Other conditions are as described in the legend of Fig. 2.
FIGURE 8.

Effect of 2-DG on the activity of PMA1. PMA1 activity was measured as medium acidification as described under “Experimental Procedures.” The graphs show the fluorescence of the dye BCECF before and after addition of 30 mm glucose to a 2% (w/v) suspension of yeast cells in the absence and in the presence of 5 mm 2-DG.
DISCUSSION
Dynamics of ATP in Yeast Glycolysis
Our measurements of intracellular ATP in yeast cells with an oscillating glycolysis reveals several unexpected results. In addition to a lower amplitude of ATP oscillation compared with an earlier determination using quenching and extraction of cell content, the mean ATP level is not stationary, but slowly declines until glucose is used up. A similar decline in ATP can be spotted in the data of Richard et al. (11), although the time span covered by their discrete measurements only corresponds to 3 excursions. The slow decline suggests that the ATPase activity is higher than the ATP production rate through glycolysis. The effect of the inhibitor sodium azide strongly indicates that part of the ATPase activity is caused by the F0F1 ATPase. Measurements of the slow decline in intracellular ATP in yeast mutants lacking F0F1 ATPase or PMA1 also show a smaller decrease in ATP concentration similar to that shown in Fig. 4 in support of the conclusion that the slow decline in ATP is caused by the activities of these two ATPases (data not shown).
The roles of F0F1 ATPase and PMA1 in the Glycolytic Oscillations
Overall our intracellular ATP measurements support our earlier hypothesis (16, 22) that glycolytic oscillations entail intact F0F1 ATPase and PMA1 activities. As for the F0F1 ATPase the activity needs to be tightly controlled for oscillations to occur. Both inhibition of the ATPase by azide or stimulation of the ATPase by FCCP will result in the disappearance of the oscillations (16, 21). Presumably the same applies to PMA1, although it has not yet been documented that an increase in the activity of this enzyme will make the oscillations disappear. At this point it is not possible to determine if it is the overall rate of ATPase activity set by the F0F1 ATPase and PMA1 that controls the oscillations, or if the two ATPases have more specific roles in the mechanism responsible for the oscillations. Studies of mathematical models of glycolysis seem to favor the former conclusion (23, 24).
Origin of the Slow Increase in ATP after Glucose Exhaustion
An unexpected observation is also the slow increase in ATP after the glucose has been exhausted. This slow increase is observed in yeast cells with an oscillating glycolysis, but also in cells where the F0F1 ATPase was inhibited with azide (Fig. 4). However, the slow increase in intracellular ATP is absent in cells inhibited with iodoacetate and 2-DG. The origin of this slow increase warrants further experimentation, but it seems that any increase in ATP following exhaustion of glucose entails that the activity of the membrane bound ATPases must be switched off or dramatically reduced after the glucose has been used up. Otherwise the ATP concentration should decrease to zero. The mechanism controlling the activity of these ATPases is presently a matter of speculation, but for PMA1 it has been shown that the activity is controlled by glucose (40, 41). The activation (and presumably also the deactivation) involves a threonine and a serine residue at the C terminus, which are rapidly phosphorylated on activation (42) (and presumably dephosphorylated on deactivation).
Effect of 2-DG on ATP Concentration
Yet another surprising observation is the effect of 2-DG on the intracellular ATP level. We expected that the inhibition of glycolytic oscillations by 2-DG would, similar to what is observed after inhibition with iodoacetate (Fig. 5), be accompanied by a dramatic decrease in the intracellular ATP because of its inhibition of the phosphorylation of glucose to glucose 6-phosphate (38). Instead we observed an almost stationary but moderately decreased ATP concentration, indicating that glycolysis is still active. This was confirmed by our measurements using mass spectrometry that the glycolytic flux was only reduced 40% in the presence of 5 mm 2-DG. One possibility that ATP concentration remains relatively high is that 2-DG inhibits ATP hydrolysis to a similar or even greater extent compared with its effect on glycolysis. Here we show that 2-DG seems to affect the activity of PMA1. Because PMA1 is activated by glucose (40–42) we conjecture that 2-DG somehow interferes with this activation. However, this conjecture warrants further investigation. It is also possible that other ATP-consuming processes are affected by 2-DG. Other eukaryotic cells treated with 2-DG also show only moderate decreases in ATP (43, 44), suggesting that the effect of 2-DG cannot be explained adequately by a metabolic block (45).
Usefulness of Nanobiosensors
We have demonstrated here that our aptamer-based ATP nanosensor is highly versatile and relatively easy to use. Furthermore it is reversible and has a short response time, so it is capable of monitoring ATP dynamics in real time inside living cells. A similar nanosensor, which does not discriminate between ATP, ADP, and AMP, showed that the total concentration of these nucleotides is constant in the non-growing yeast cells (32). Our measurements of intracellular ATP demonstrate that the ability to measure metabolite concentrations in real time may provide new and very useful information about metabolism and its regulation.
Acknowledgments
We thank Anita Lunding for skilled technical assistance. The work was performed in the LiMeS collaborative network. We thank Prof. Ursula Kummer, University of Heidelberg, for reading the manuscript and for helpful comments.
This research was supported by the Danish Natural Science Research Council (J. no. 09-062275) and the Danish Research Council for Technology and Production (Grant no. 274-07-0172).

The on-line version of this article (available at http://www.jbc.org) contains supplemental Figs. S1–S9 and Table S1.
- pHi
- intracellular pH
- 2-DG
- 2-deoxyglucose
- ssDNA
- single-stranded DNA
- SPR
- surface plasmon resonance.
REFERENCES
- 1.Bell P. D., Komlosi P., Zhang Z. R. (2009) Purinergic Signalling 5, 461–471 [DOI] [PMC free article] [PubMed] [Google Scholar]
- 2.Verkhrasky A., Krishtal O. A., Burnstock G. (2009) Mol. Neurobiol. 39, 190–208 [DOI] [PubMed] [Google Scholar]
- 3.Fellin T., Carmignoto G. (2004) J. Physiol-London 559, 3–15 [DOI] [PMC free article] [PubMed] [Google Scholar]
- 4.Bertram R., Satin L. S., Pedersen M. G., Luciani D. S., Sherman A. (2007) Biophys. J. 92, 1544–1555 [DOI] [PMC free article] [PubMed] [Google Scholar]
- 5.Richard P. (2003) Fems Microbiol. Rev. 27, 547–557 [DOI] [PubMed] [Google Scholar]
- 6.Imamura H., Nhat K. P., Togawa H., Saito K., Iino R., Kato-Yamada Y., Nagai T., Noji H. (2009) Proc. Nat. Acad. Sci. U.S.A. 106, 15651–15656 [DOI] [PMC free article] [PubMed] [Google Scholar]
- 7.Kim J. H., Ahn J. H., Barone P. W., Jin H., Zhang J. Q., Heller D. A., Strano M. S. (2010) Angew. Chem. Int. Edit. 49, 1456–1459 [DOI] [PubMed] [Google Scholar]
- 8.Neves A. R., Ramos A., Nunes M. C., Kleerebezem M., Hugenholtz J., de Vos W. M., Almeida J., Santos H. (1999) Biotechnol. Bioeng. 64, 200–212 [DOI] [PubMed] [Google Scholar]
- 9.Viarengo A., Secondini A., Scoppa P., Orunesu M. (1986) Experientia 42, 1234–1235 [DOI] [PubMed] [Google Scholar]
- 10.Hara K. Y., Mori H. (2006) J. Biomol. Screen 11, 310–317 [DOI] [PubMed] [Google Scholar]
- 11.Richard P., Teusink B., Hemker M. B., VanDam K., Westerhoff H. V. (1996) Yeast 12, 731–740 [DOI] [PubMed] [Google Scholar]
- 12.Kunzelmann S., Webb M. R. (2009) J. Biol. Chem. 284, 33130–33138 [DOI] [PMC free article] [PubMed] [Google Scholar]
- 13.Berg J., Hung Y. P., Yellen G. (2009) Nat. Methods 6, 161–166 [DOI] [PMC free article] [PubMed] [Google Scholar]
- 14.Kunzelmann S., Webb M. R. (2010) ACS. Chem. Biol. 5, 415–425 [DOI] [PMC free article] [PubMed] [Google Scholar]
- 15.De Monte S., d'Ovidio F., Danø S., Sørensen P. G. (2007) Proc. Natl. Acad. Sci. U.S.A. 104, 18377–18381 [DOI] [PMC free article] [PubMed] [Google Scholar]
- 16.Olsen L. F., Andersen A. Z., Lunding A., Brasen J. C., Poulsen A. K. (2009) Biophys. J. 96, 3850–3861 [DOI] [PMC free article] [PubMed] [Google Scholar]
- 17.Aldridge J., Pye E. K. (1976) Nature 259, 670–671 [DOI] [PubMed] [Google Scholar]
- 18.Aon M. A., Cortassa S., Westerhoff H. V., Vandam K. (1992) J. Gen. Microbiol. 138, 2219–2227 [Google Scholar]
- 19.Warnke C., Mair T., Witte H., Reiher A., Hauser M. J. B., Krost A. (December2009) Phys. Biol. 10.1088/1478-3975/6/4/046011 [DOI] [PubMed] [Google Scholar]
- 20.Poulsen A. K., Lauritsen F. R., Olsen L. F. (2004) Fems Microbiol. Lett. 236, 261–266 [DOI] [PubMed] [Google Scholar]
- 21.Andersen A. Z., Poulsen A. K., Brasen J. C., Olsen L. F. (2007) Yeast 24, 731–739 [DOI] [PubMed] [Google Scholar]
- 22.Poulsen A. K., Andersen A. Z., Brasen J. C., Scharff-Poulsen A. M., Olsent L. F. (2008) Biochemistry 47, 7477–7484 [DOI] [PubMed] [Google Scholar]
- 23.Hynne R., Danø S., Sørensen P. G. (2001) Biophys. Chem. 94, 121–163 [DOI] [PubMed] [Google Scholar]
- 24.Madsen M. F., Danø S., Sørensen P. G. (2005) FEBS. J. 272, 2648–2660 [DOI] [PubMed] [Google Scholar]
- 25.Stoltenburg R., Reinemann C., Strehlitz B. (2005) Anal. Bioanal. Chem. 383, 83–91 [DOI] [PubMed] [Google Scholar]
- 26.Espelund M., Stacy R. A., Jakobsen K. S. (1990) Nucleic Acids Res. 18, 6157–6158 [DOI] [PMC free article] [PubMed] [Google Scholar]
- 27.Wochner A., Glökler J. (2007) BioTechniques 42, 578–582 [DOI] [PubMed] [Google Scholar]
- 28.Gestwicki J. E., Hsieh H. V., Pitner J. B. (2001) Anal. Chem. 73, 5732–5737 [DOI] [PubMed] [Google Scholar]
- 29.Tang Z. W., Mallikaratchy P., Yang R. H., Kim Y. M., Zhu Z., Wang H., Tan W. H. (2008) J. Am. Chem. Soc. 130, 11268–11269 [DOI] [PubMed] [Google Scholar]
- 30.Daubresse C., Grandfils C., Jerome R., Teyssie P. (1994) J. Colloid Interface Sci. 168, 222–229 [Google Scholar]
- 31.Fromm H. J., Zewe V. (1962) J. Biol. Chem. 237, 3027–3032 [PubMed] [Google Scholar]
- 32.Nielsen L. J., Olsen L. F., Ozalp V.C. (2010) ACS Nano 4, 4361–4370 [DOI] [PubMed] [Google Scholar]
- 33.Bunka D. H., Stockley P. G. (2006) Nat. Reviews Microbiology 4, 588–596 [DOI] [PubMed] [Google Scholar]
- 34.Mairal T., Ozalp V. C., Lozano Sánchez P., Mir M., Katakis I., O'Sullivan C. K. (2008) Anal. Bioanal. Chem. 390, 989–1007 [DOI] [PubMed] [Google Scholar]
- 35.Poulsen A. K., Petersen M. Ø., Olsen L. F. (2007) Biophys. Chem. 125, 275–280 [DOI] [PubMed] [Google Scholar]
- 36.Harris D. A. (1989) Biochim. Biophys. Acta 974, 156–162 [DOI] [PubMed] [Google Scholar]
- 37.Webb J. (1966) Enzyme and Metabolic Inhibitors, Vol. III, Academic Press Inc., New York, NY [Google Scholar]
- 38.Herve M., Wietzerbin J., Tran-Dinh S. (1993) Eur. J. Biochem. 218, 221–228 [DOI] [PubMed] [Google Scholar]
- 39.Perlin D.S., Brown C.L., Haber J.E. (1988) J. Biol. Chem. 263, 18118–18122 [PubMed] [Google Scholar]
- 40.Serrano R. (1983) FEBS Lett. 156, 11–14 [DOI] [PubMed] [Google Scholar]
- 41.Lecchi S., Allen K. E., Pardo J. P., Mason A. B., Slayman C. W. (2005) Biochemistry 44, 16624–16632 [DOI] [PubMed] [Google Scholar]
- 42.Lecchi S., Nelson C. J., Allen K. E., Swaney D. L., Thompson K. L., Coon J. J., Sussman M. R., Slayman C. W. (2007) J. Biol. Chem. 282, 35471–35481 [DOI] [PubMed] [Google Scholar]
- 43.Karczmar G. S., Arbeit J. M., Toy B. J., Speder A., Weiner M. W. (1992) Cancer Res. 52, 71–76 [PubMed] [Google Scholar]
- 44.Schulz T. J., Zarse K., Voigt A., Urban N., Birringer M., Ristow M. (2007) Cell Metabolism 6, 280–293 [DOI] [PubMed] [Google Scholar]
- 45.Ralser M., Wamelink M. M., Struys E. A., Joppich C., Krobitsch S., Jakobs C., Lehrach H. (2008) Proc. Natl. Acad. Sci. U.S.A. 105, 17807–17811 [DOI] [PMC free article] [PubMed] [Google Scholar]