

Abstract
A group of 70 adults with end-stage liver disease received 87 homologous liver transplants from 7/11/81 and 7/11/83. The recipients fell into the following diagnostic categories: postnecrotic cirrhosis (PNC) in 22, primary biliary cirrhosis (PBC) in 18, cancer or neoplasia (CA) in 11, sclerosing cholangitis (SC) in 8 and miscellaneous (MISC) in 11. Survival for six months or longer was 46%: survival by group was PBC=67%, CA=55%, PNC=45%, SC=25%, and MISC=18%. Preoperative coagulation profiles were evaluated on 64 of the 70 first transplant patients by assigning a score derived from one point per abnormality in each of 8 tests. Mean coagulation abnormality scores (CAS) were strikingly elevated in the PNC and MISC groups. Mean intraoperative blood product usage was 43 units of RBCs, 40 units of fresh frozen plasma (FFP), 21 units of platelets, and 9 bags of cryoprecipitate. Direct correlations were found between CAS and RBC usage (+0.454, P=<.001), CAS, and survival of 6 months or longer (−0.281, P=<.02), and RBC usage and survival (−0.408, P=<.001). These findings indicate that the degree of coagulation abnormality and the type of liver disease may be predictive of intraoperative blood usage and survival in liver transplantation in adults.
Liver transplantation has been used to treat patients with a wide variety of end-stage liver disorders (1–3). Better methods for the procurement, preservation, and transport of donor livers, improved and innovative surgical techniques, and the use of cyclosporine for immunosuppression have recently made this procedure feasible for an increasing number of patients.
Liver disease in which the parenchyma is severely and extensively damaged is frequently accompanied by clotting abnormalities and it may result in serious spontaneous (4) or postoperative bleeding (5). Previously, in patients undergoing liver transplantation, the evaluation of preoperative parameters was sporadic and unsystematic (6–12). In this study preoperative coagulation studies have been ordered on most of the liver transplant candidates as an aid in diagnosis of the severity and type of liver disease. Data on blood product usage was correlated with preoperative coagulation abnormalities and survival in an attempt to predict which patients are at risk for massive bleeding during transplantation.
MATERIALS AND METHODS
Patient categorization
Seventy adult liver transplant recipients whose first operation occurred between 7/11/81 and 7/11/83 have been categorized into five major diagnostic groups. In an otherwise consecutive series, the first four adult transplants done in Pittsburgh were omitted because the donated livers were inadequately preserved; two other candidates were excluded because the operation was impossible—in one because of the thrombosed portal vein, and in the other because of absence of the hepatic artery consequent to trauma and previous surgical repair. As shown in Table 1, the most frequent type of liver disease was postnecrotic cirrhosis (PNC)2 with 22 patients, five of whom had had hepatitis B, seven of whom had chronic active hepatitis (CAH), and the remaining ten of whom were being followed for hepatitis—presumably of the non-A, non-B type. The next most common category was primary biliary cirrhosis (PBC), which consisted of 18 female patients. Of the 11 patients in the cancer-neoplasia (CA) group, 7 suffered from hepatoma—1 of which followed tyrosinemia, two from cholangiocarcinoma, one from angiosarcoma, and one from multiple hepatic adenomas that had previously been partially resected. Eight patients suffered from sclerosing cholangitis (SC). In the miscellaneous category, there were four patients with fulminant hepatitis—one from gold toxicity, one from exposure to paint containing 2-nitropropane, and two following presumed non-A non-B hepatitis—two patients with α1 antitrypsin deficiency (one with hemochromatosis), and one each with alcoholic cirrhosis plus postnecrotic cirrhosis, congenital biliary hypoplasia, secondary biliary cirrhosis (resulting from postoperative stricture), secondary biliary cholangiectasis, and venoocclusive disease.
Table 1.
Categorization of patients
| Diagnosis | No. | F | M | Age range |
|---|---|---|---|---|
| Postnecrotic cirrhosis (PNC) | 22 | 8 | 14 | 18–48 |
| Primary biliary cirrhosis (PBC) | 18 | 18 | 0 | 36–59 |
| Carcinoma/neoplasia (CA) | 11 | 7 | 4 | 21–54 |
| Sclerosing cholangitis (SC) | 8 | 2 | 6 | 17–45 |
| Miscellaneous (Misc) | 11 | 3 | 8 | 25–47 |
| Totals | 70 | 38 | 32 | 17–59 |
Laboratory
Coagulation tests were performed using standard or previously described methods (13–15). Preoperative tests were performed on 64 of the 70 patients within three months of the operation. The standard coagulation profile included the eight tests listed below and assays for coagulation factors II, V, VII, X, VIII, IX, XI, XII, and Fletcher (prekallikrein); bleeding time; platelet glass retention index; and platelet aggregation tests. In order to simplify the handling of coagulation data, a score, called the coagulation abnormality score, was derived for each patient by allowing one point for each abnormality in the following tests. To obviate any gray areas only the distinctly abnormal values given below were counted:
| Range | Abnormal | Normal | |
|---|---|---|---|
| PT | Prothrombin time (sec) | 13.5 or > | 10.8–13.0 |
| APTT | Act. partial thromboplastin time (sec) | 36.0 or > | 26–34 |
| TT | Thrombin time (sec) | 20.0 or > | 13–18 |
| I | Fibrinogen (mg/dl) | 149 or < | 150–450 |
| Plat. C. | Platelet count ×108/μl | 149 or < | 150–450 |
| AT-III | Antithrombin III—U/ml | 70 or < | 80–120 |
| FSP | Fibrinogen split products (ethanol gel (2–4+) and Thrombo-Wellcotest (≥2 ng/ml) | + | 0 |
| Lysis | Euglobulin lysis time (hr) | 2 or < | 4 |
Operative techniques
The operative techniques have been described elsewhere (1–3). During a three-month period, 6/15/82 to 9/6/82, heparin was used during 12 transplant procedures in nine patients. The heparin was used to prevent clotting while shunting blood from the operative area. Three operative deaths (25%) occurred in the heparinized patients, in comparison with 6 operative deaths in the other 75 liver transplants (8%). More recently a special polyvinylchloride tubing (ARGYLY; Sherwood Medical Industries, St. Louis, MO) coated with TDMAC/heparin complex has been used for bypass. This coating inhibits clot formation without causing generalized heparinization.
Pathological findings
Organs removed at the operation were weighed and examined for the presence or absence of any focal abnormalities and disorders of the vascular and biliary structures. They were then sectioned in 1-cm slices and reexamined. After initial fixation in 10% formaldehyde, tissues were processed and embedded in paraffin, sectioned at 3-μ, and stained with hematoxylin and eosin, Massey trichome, and reticulin stains using standard techniques. Tissue sections were then read blindly by two examiners and classified into cirrhotic and noncirrhotic groups, which were then subclassified according to whether the cirrhosis was postnecrotic. Following these determinations, and based upon the major gross and histologic fixtures of each case, a specific diagnostic and/or etiologic category was determined (Table 1). In each of primary biliary cirrhosis, the disease process was well advanced, in stage 3 or stage 4. Similarly, in each case of sclerosing cholangitis, the disease process was well advanced, and accompanied by cirrhotic changes.
Statistical methods
Significance was determined by the Mann-Whitney test; correlations were obtained by the Spearman ranked test.
RESULTS
Survival
Thirty-two (46%) patients have survived at least 6 months from the time of the most recent liver transplant. Entry of survival date was closed 1/11/84, six and a half months after the first liver transplant in the last of the 70 recipients studied. Table 2 analyzes survival by disease category and date of last transplant, and it shows the number who survived compared with the number of operations done. The bottom line shows that survival was best in the PBC and CA groups, intermediate in PNC, and worst in MISC and SC. Rather surprisingly, survival was best in the earliest procedures, followed by a distinct drop during 1982 and then an increase in early 1983. As of 1/11/84, there were seven patients who had survived for more than 2 years, thirteen for 1–2 years, and twelve for 6 months to 1 year.
Table 2.
Survival (as of 1/11/84) after last liver transplant by disease category and date of transplant
| Date of last liver transplant | No. survived/No. performed |
% | |||||
|---|---|---|---|---|---|---|---|
| PNC | PBC | CA | SC | Misc | Total | ||
| 7/11/81–12/31/81 | 3/6 | 1/1 | 1/2 | 1/1 | 1/1 | 7/11 | 64 |
| 1/01/82–6/30/82 | 1/5 | 3/4 | 2/4 | 0/0 | 0/1 | 6/14 | 43 |
| 7/01/82–12/31/82 | 2/3 | 3/6 | 1/2 | 1/5 | 0/4 | 7/20 | 35 |
| 1/01/83–6/27/83 | 4/8 | 5/7 | 2/3 | 0/2 | 1/5 | 12/25 | 48 |
| Total | 10/22 | 12/18 | 6/11 | 2/8 | 2/11 | 32/70 | |
| % | 45 | 67 | 55 | 25 | 18 | 46 | |
Causes of death
Of the 38 patients who died, four died after 200 days—two of recurrent disease, one of infection, and one from myocardial infarction. Eight patients died 50–200 days after the last transplant; four from rejection with or without sepsis, one from thrombosis of the graft, two from hemorrhage (one hepatic artery and one intrathoracic), and one from splenic rupture. Seventeen patients died 2–49 days after the operation. In eleven the major cause was infection, and in three it was rejection—although all probably had some degree of both. Aspergillosis was identified in four. Nine patients died during the operative period.
Coagulation
Table 3 gives the mean CAS values for each patient group, listed in order of decreasing severity of coagulation abnormalities. The standard deviations for CAS values in each group and the significance of the difference of the mean of each from the mean of the CA group, the group with the lowest CAS, is calculated. The P values for PNC and MISC are highly significant.
Table 3.
Coagulation abnormality points (CAS [means for each group])
| No. patients | Mean points | Standard deviation | Significance (P) | |
|---|---|---|---|---|
| PNC | 20 | 5.3 | 1.2 | <.0001 |
| Misc | 10 | 4.8 | 2.0 | <.001 |
| SC | 8 | 2.8 | 1.9 | <.05 |
| PBC | 16 | 1.9 | 1.4 | NS |
| CA | 10 | 0.8 | 0.8 | — |
Table 4 shows the number of patients in each group on whom preoperative coagulation profiles were performed, the mean value, and the percentage that was abnormal in each of the general coagulation tests. In the entire group (64) the thrombin time was the most frequently abnormal test, followed by AT-III, APTT, and platelet count.
Table 4.
Mean values of coagulation tests and percentage of patients abnormal in each category and in the entire group
| Group | No. | TT (sec) (%) | AT-III (U/ml) % | APTT (sec) (%) | Plt. Ct. (×103/μl) (%) | PT (sec) (%) | I (mg/dl) (%) | FSP (%) | Lysis (%) |
|---|---|---|---|---|---|---|---|---|---|
| PNC | 20 | 30.3 (85) | 36 (95) | 40.9 (79) | 92 (90) | 16.8 (95) | 182 (40) | —a (25) | —a (20) |
| Misc | 10 | 29.2 (80) | 49 (90) | 48.3 (80) | 199 (70) | 28.9 (80) | 183 (50) | —a (11) | —a(33) |
| SC | 8 | 21.2 (63) | 82 (50) | 39.8 (75) | 189 (63) | 13.0 (25) | 473 (0) | 0 (0) | 0 (0) |
| PBC | 16 | 21.7 (56) | 94 (25) | 35.7 (38) | 249 (38) | 12.3 (25) | 389 (0) | —a (13) | 0 (0) |
| CA | 10 | 20.1 (55) | 97 (22) | 30.9 (10) | 308 (0) | 11.9 (0) | 455 (0) | 0 (0) | 0 (0) |
| ALL | 64 | 25.3 (67) | 67 (60) | 39.0 (59) | 188 (55) | 16.3 (52) | 313 (20) | —a (13) | —a (11) |
| Normal | 20 or < | 70 or > | 36.0 or < | 150 or > | 13.5 or < | 150 or > | 0 | 0 |
Mean values for + or 0 tests not meaningful.
Table 5 shows the mean values in factor assays for each patient group. The PNC and MISC groups are abnormal in almost all factors, but the mean values for the PBC, CA, and SC groups are normal.
Table 5.
Mean values (U/ml) for coagulation factors for patients in each category and in the entire group
| Number in group | Coagulation Factor |
|||||||
|---|---|---|---|---|---|---|---|---|
| II | V | VII | IX | X | XI | XII | ||
| PNC | 20 | 0.33 | 0.35 | 0.27 | 0.43 | 0.56 | 0.44 | 0.65 |
| Misc | 10 | 0.46 | 0.45 | 0.52 | 0.45 | 0.64 | 0.46 | 0.67 |
| SC | 8 | 1.13 | 0.64 | 1.42 | 1.02 | 1.43 | 0.63 | 1.00 |
| PBC | 16 | 0.95 | 1.00 | 1.00 | 0.90 | 0.95 | 0.76 | 1.07 |
| CA | 10 | 0.81 | 1.10 | 0.92 | 1.05 | 0.80 | 1.00 | 1.11 |
| Total | 64 | 0.68 | 0.68 | 0.74 | 0.73 | 0.81 | 0.63 | 0.87 |
| Normal for all factors = 0.50–1.50 U/ml | ||||||||
Factor VIII:C is not included in Table 5 because it was consistently normal or high (mean for 63 = 2.3 U/ml) in all patient categories. The one patient with hemophilia is excluded from this statement.
Blood components used
Tables 6 and 7 show the mean number of units of red blood cells (RBC), fresh frozen plasma (FFP), platelets (Plat), and bags of cryoprecipitate (cryo) used during the operative procedures. For all 70 first transplants, the mean RBC used was 43 units, FFP 40 units, plat 21 units, and cryo 9 units. The range was very large for RBCs—from 3 to 251. Figure 1 shows the wide distribution in numbers of RBCs used. The median was 24 and the mean was 43 units of RBCs, indicating that the large numbers used in a few patients outweighed the lesser numbers in calculating the mean. Seven patients received over 100 units of red cells. Table 7 shows that the blood used in retransplantation is less than half that used in the first operation.
Table 6.
Blood products usage during 70 first liver transplants (mean values for each disease category and for all patients
| No. patients | RBC | FFP | Plat | Cryo | |
|---|---|---|---|---|---|
| PNC | 22 | 58.0 | 55.0 | 31.3 | 9.8a |
| Misc | 11 | 43.7 | 42.1 | 23.0 | 12.5 |
| SC | 8 | 58.1 | 47.6 | 21.6 | 24.3 |
| PBC | 18 | 23.0 | 23.4 | 10.9 | 3.9 |
| CA | 11 | 32.6 | 28.5 | 11.5 | 3.3 |
| All | 70 | 42.8 | 39.9 | 20.5 | 9.3a |
Excluding the hemophiliac.
Table 7.
Mean blood product usage in 17 retransplantations
| No. patients | RBC | FFP | Plat | Cryo | |
|---|---|---|---|---|---|
| PNC | 2 | 8.5 | 8.0 | 21.5 | 6.0 |
| Misc | 5 | 16.8 | 18.8 | 12.4 | 10.4 |
| SC | 5 | 38.0 | 22.2 | 16.6 | 6.0 |
| PBC | 5 | 11.6 | 9.0 | 9.8 | 2.4 |
| CA | 0 | 0 | 0 | 0 | 0 |
| All | 17 | 20.5 | 15.6 | 14.2 | 6.2 |
Figure 1.
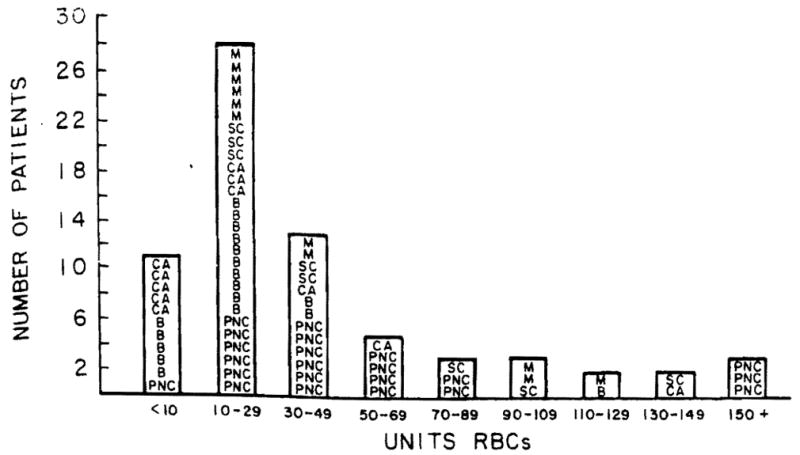
Intraoperative RBCs used in 70 patients. Diagnosis: (M) miscellaneous; (B) primary biliary cirrhosis; (SC) sclerosing cholangitis; (CA) tumor/cancer; and (PNC) postnecrotic cirrhosis.
This large blood component usage constituted a significant fraction of the total amount used in 1982 in Presbyterian-University Hospital (550 beds), as shown in Table 8.
Table 8.
1982 blood products used in Presbyterian-University Hospital and in 35 liver transplant patients
| Product | 17,706 Patients | 35 Patients (43 transplants) | % |
|---|---|---|---|
| RBC | 21,701 | 2768 | 13 |
| FFP | 13,032 | 2752 | 21 |
| Plat | 11,577 | 1908 | 16 |
| Cryo | — | 314 | — |
Figure 2 shows the relationship between CAS and blood products used during the operation. There is little difference in components used when the coagulation scores range from 4 to 7. Only when the coagulation defects are minor (score 0–2), is the use of lesser amounts of blood components evident.
Figure 2.
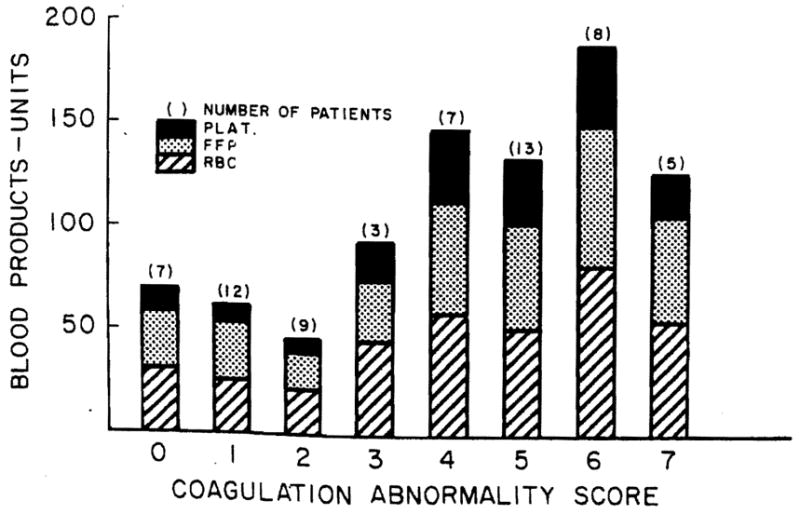
First liver transplants. Operative blood product used versus coagulation abnormality score in 64 patients.
Operative deaths
Nine patients died in the operating room (eight first transplants and one second transplant). The preoperative CAS for the eight first transplants was 5.13, as compared with 3.15 for the 55 who survived the immediate operative period and for whom preoperative coagulation data is available. This is a significant difference at the P<.03 level.
Looking at all 70 first transplants, the mean blood component use in the eight operative deaths was significantly higher than in the 62 operative survivals. RBC use was 107 units in the operative deaths and 34 units in the survivors, FFP use was 90 units vs. 33 units, and platelets were 35 units vs. 19. The P values are <.001 for RBCs, <.001 for FFP, and <.07 for platelets. Three of the seven patients who received more than 100 units of RBCs at operation died during the operative period.
Correlations of coagulation abnormalities, blood components used during operation and survival
In the 64 patients with preoperative coagulation studies, the CAS, as correlated with RBC usage, showed a correlation coefficient of 0.454 (P=.001), and with survival it showed a correlation coefficient of −0.281 (P<.02). Intraoperative RBC use in 70 first transplants correlated with a survival gave a correlation coefficient of −0.408 (P=.001). These correlations are still significant if the intraoperative deaths are omitted.
DISCUSSION
The liver plays a central role in the maintenance of adequate hemostasis. Among its many functions are the synthesis and degradation of clotting factors I (fibrinogen), II (prothrombin), V, VII, IX, X, XI, XII, Fletcher, and Fitzgerald; clotting inhibitors alpha-1-antitrypsin, alpha-2-macroglobulin, antithrombin III; and plasminogen. Only F VIII is an exception: both F VIIIR:Ag and F VIIIR:vW are synthesized in vascular endothelium, and the site of synthesis of F VIII:C is unknown. When parenchymal liver cells suffer widespread damage, as in postnecrotic or Laennec’s cirrhosis, fulminant hepatitis and longstanding α1 antitrypsin deficiency, severe clotting abnormalities are observed. When bile ducts are involved (PBC and SC) or malignancy is present, large areas of normal parenchymal tissue are still able to produce normal amounts of coagulation factors. These relationships held relatively true among our patient groups. The correlation between the degree of preoperative coagulation abnormality (CAS) and the amount of red cells transfused (used as a measure of bleeding) is fairly impressive. For the eight intraoperative deaths during first transplant, the mean CAS was significantly higher than that of the survivors. Blood use was also far greater in these patients. This suggests that immediate preoperative correction of the coagulation defect by plasma exchange and platelet transfusions might be of significant benefit in patients with preoperative CAS’s of 4 or more.
Many factors influence the difficulty of the operation and the amount of bleeding. Previous surgery with scarring and shortening of vessels may make the operation next-to-impossible. This partially explains the unusually large amount of blood used in cases of sclerosing cholangitis. Other factors that may contribute to excessive bleeding are intercurrent local infection, abnormalities of the vascular pattern (collaterals, etc.), or intake of drugs that interfere with hemostasis, such as aspirin or warfarin.
Survival of the 70 patients with liver transplants was 46% for six months or longer. If the intraoperative period is excluded, deaths in the first six months after transplant were usually caused by infection or rejection, or both. After six months, recurrent disease or an unrelated cause were most often found.
Survival has a strong negative correlation with the CAS and the numbers of RBC units used. Even with the elimination of operative deaths, there is still an inverse correlation between CAS and survival, particularly in the PNC group. This is hard to explain because the preoperative CAS would seem to have no bearing on the new liver unless the original disease is recurrent. The significance of RBC usage correlated with survival is much less if the intraoperative deaths are eliminated. Transfusions of large amounts of blood products greatly increase the risk of transmission of a blood-borne infection such as non-A, non-B hepatitis or AIDS, although we have not recognized any in this group of liver transplant patients. Recovery and re-use of the patient’s own red cells is slow, and it would only reduce this risk by a small amount because FFP and platelets would still be necessary.
The Central Blood Bank of Pittsburgh handles 130,000 units of blood annually, such that the increase caused by the transplants (about 2700 units per year) is only about 2%. However, the need is sufficiently episodic that continual vigilance in monitoring blood supply is required. Recovery and re-use of the patient’s own blood cells from the operative site is tedious and has not significantly reduced the blood bank demand. The speed necessary to meet blood product demand during liver transplant procedures, which almost always occur at night and last 12–24 hr, has required an added technologist, additional clerical support, and a “runner” to deliver blood products to the operating room. Committed shipments of volunteer blood have eased the extra stress on the blood supply caused by the large numbers of patients for transplant and other surgical or medical procedures coming from geographical areas outside of our drawing area.
This study has shown that widespread parenchymal liver damage, occurring in PNC, α1 antitrypsin deficiency, and fulminant hepatitis, is consistently associated with preoperative clotting abnormalities. The greater the abnormality, the greater the number of transfused red cells required during the operation. This suggests that immediate preoperative repair of the abnormalities might improve survival in these critically ill patients.
Acknowledgments
We give thanks to Dr. Floyd Taylor for his advice with statistical analysis, and to Mrs. Beverly Caputo for her secretarial assistance in preparation of the manuscript.
Footnotes
Abbreviations used in this article: CA, cancer or neoplasia; CAS, coagulation abnormality scores; cryo, cryoprecipitate; FFP, fresh frozen plasma; MISC, miscellaneous; PBC, primary biliary cirrhosis; plat, Platelets; PNC, postnecrotic cirrhosis; RBC, red blood cells; SC, sclerosing cholangitis.
References
- 1.Starzl TE, Iwatsuki S, Van Thiel DH, et al. Evolution of liver transplantation. Hepatology. 1982;2:614. doi: 10.1002/hep.1840020516. [DOI] [PMC free article] [PubMed] [Google Scholar]
- 2.Van Thiel DH, Schade RR, Starzl TE, et al. Liver transplantation in adults. Hepatology. 1982;2:637. doi: 10.1002/hep.1840020517. [DOI] [PMC free article] [PubMed] [Google Scholar]
- 3.Iwatsuki S, Shaw BW, Starzl TE. Current status of hepatic transplantation. Semin Liver Dis. 1983;3:173. doi: 10.1055/s-2008-1040683. [DOI] [PMC free article] [PubMed] [Google Scholar]
- 4.Ragni MV, Lewis JH, Spero JA, Hasiba U. Bleeding and coagulation abnormalities in alcoholic cirrhotic liver disease. Alcohol: Clin Exp Res. 1982;6:267. doi: 10.1111/j.1530-0277.1982.tb04973.x. [DOI] [PubMed] [Google Scholar]
- 5.Ragni MV, Lewis JH, Spero JA. Ascites-induced LeVeen shunt coagulopathy. Ann Surg. 1983;198:91. doi: 10.1097/00000658-198307000-00018. [DOI] [PMC free article] [PubMed] [Google Scholar]
- 6.Starzl TE, Marchioro TL, Von Kaulla KN, Hermann G, Brittain RS, Waddell WR. Homotransplantation of the liver in humans. Surg Gynecol Obstet. 1963;117:659. [PMC free article] [PubMed] [Google Scholar]
- 7.Von Kaulla KN, Kaye H, Von Kaulla E, Marchioro TL, Starzl TE. Changes in blood coagulation before and after hepatectomy or transplantation in dogs and man. Arch Surg. 1966;92:71. doi: 10.1001/archsurg.1966.01320190073016. [DOI] [PMC free article] [PubMed] [Google Scholar]
- 8.Hutchinson DE, Genton E, Porter KA, et al. Platelet changes following clinical and experimental hepatic homotransplantation. Arch Surg. 1968;97:27. doi: 10.1001/archsurg.1968.01340010057003. [DOI] [PMC free article] [PubMed] [Google Scholar]
- 9.Howland WS, Ryan GM, Bettigole RE, Fortner JG. Coagulation abnormalities associated with liver transplantation. Surg. 1970;68:591. [PubMed] [Google Scholar]
- 10.Popov S, Kalinke H, Etzel F, Boymann EE, Egli H. Coagulation changes during and after liver transplantation in man. In: Von Kaulla KN, editor. Coagulation problems in transplantation of organs. Springfield, IL: Thomas; 1972. p. 31. [Google Scholar]
- 11.Calne RY, Williams R, Dawson JL, et al. Liver transplantation in man: II. A report of two orthotopic liver transplants in adult recipients. Br Med J. 1968;4:541. [PMC free article] [PubMed] [Google Scholar]
- 12.Bohmig HJ. The coagulation disorder of orthotopic hepatic transplantation. Semin Thromb Hemostas. 1977;4:57. doi: 10.1055/s-0028-1087128. [DOI] [PubMed] [Google Scholar]
- 13.Lewis JH. Coagulation defects. JAMA. 1961;178:1014. doi: 10.1001/jama.1961.73040490010008. [DOI] [PubMed] [Google Scholar]
- 14.Lewis JH. Hemostasis and hemorrhage. Sci Clin. 1971;1:1–66. [Google Scholar]
- 15.Lewis JH, Spero JA, Hasiba U. Bleeding disorders. Garden City, NY: Medical Exam; 1978. Diagnostic methods: laboratory tests; p. 22. [Google Scholar]