

Abstract
Both acetylcholine (ACh) and theta oscillations are important for learning and memory, but the dynamic interaction between these two processes remains unclear. Recent advances in amperometry techniques have revealed phasic ACh releases in vivo. However, it is unknown whether phasic ACh release co-occurs with theta oscillations. We investigated this issue in the CA1 region of urethane-anesthetized male rats using amperometric and electrophysiological recordings. We found that ACh release was highly correlated with the appearance of both spontaneous and induced theta oscillations. Moreover, the maximal ACh release was observed around or slightly above the pyramidal layer. Interestingly, such release lagged behind theta initiation by 25–60 s. The slow ACh release profile was matched by the slow firing rate increase of a subset of medial–septal low-firing-rate neurons. Together, these results establish, for the first time, the in vivo coupling between phasic ACh release and theta oscillations on spatiotemporal scales much finer than previously known. These findings also suggest that phasic ACh is not required for theta initiation and may instead operate synergistically with theta oscillations to promote neural plasticity in the service of learning and memory.
Introduction
Both acetylcholine (ACh) and theta oscillations are essential components of normal hippocampal functions (Vertes and Kocsis, 1997; Buzsaki, 2002; Gold, 2003; Hasselmo, 2006). Theta oscillations (3–12 Hz), at the electrophysiological level, organize the activity of hippocampal neuronal ensembles over both temporal and spatial domains (Lubenov and Siapas, 2009) and promote synaptic plasticity (Larson et al., 1986; Vertes, 2005). At the neurochemical level, ACh from the medial septum–vertical limb of the diagonal band of Broca (MSvDB) enhances hippocampal neuronal activity and plasticity (Jerusalinsky et al., 1997; Power et al., 2003; Hasselmo, 2006). Disruption of either of these two processes leads to impairment of hippocampus-dependent learning and memory functions (for review, see Jerusalinsky et al., 1997; Buzsaki, 2002; Power et al., 2003; Parent and Baxter, 2004).
Hippocampal ACh and theta oscillations appear to be tightly coupled. Lesions or pharmacological impairments of normal cholinergic activities dampen theta oscillations, suggesting that the septohippocampal cholinergic projection is an integral part of the theta generation system (Vanderwolf, 1975; Lee et al., 1994) (but see Goutagny et al., 2009). Higher ACh levels, revealed by microdialysis, are associated with theta-dominant behavioral states (Marrosu et al., 1995; Bianchi et al., 2003) and learning (Stancampiano et al., 1999; McIntyre et al., 2003).
Despite these converging observations, limitations on the temporal resolution of prior experimental approaches (5–10 min fastest) have prevented the direct investigation of how hippocampal ACh concentration fluctuations and theta oscillations are dynamically coupled on faster time scales. Theta oscillations can appear or disappear as fast as a few seconds (Vanderwolf, 1969; DeCoteau et al., 2007). Recently, fast (phasic) ACh release lasting a few seconds was observed in behaving animals using amperometry (Parikh et al., 2007). These observations raise the question of whether ACh fluctuations are dynamically coupled to theta oscillations on time scales such as seconds. Furthermore, establishing the finer temporal relationship between ACh release and theta oscillations may also help to resolve the debate on whether MSvDB cholinergic neurons could pace theta oscillations (Brazhnik and Fox, 1997; Apartis et al., 1998) (for opposing views, see Markram and Segal, 1990; Simon et al., 2006).
To circumvent limitations of traditional approaches and to directly observe the temporal interaction between ACh release and theta oscillations on finer scales, we used amperometry to acquire ACh dynamics on the level of seconds with a choline sensor (Burmeister et al., 2003), while simultaneously monitoring theta activities reflected in the high-frequency component (HFC) of amperometric signals (Zhang et al., 2009). Using this novel experimental approach, we asked whether phasic ACh release could accompany the appearance of theta oscillations on temporal scales of seconds to tens of seconds and whether ACh release was spatially modulated across hippocampal layers. In urethane-anesthetized rats, we observe for the first time a strong coupling between phasic ACh releases and theta oscillations on the time scale of tens of seconds. Subsequently, we further investigated whether such phasic ACh release was required for the initiation of theta oscillations, and how individual MSvDB neurons behaved in relation to ACh release/theta oscillations.
Materials and Methods
Animals
Animal use and procedures were approved by the Duke Institutional Animal Care and Use Committee and performed in accordance with National Institutes of Health guidelines. Twenty-seven adult male Long–Evans rats (3–8 months old, 350–500 g) were used in the experiments.
Choline sensors
Choline sensor manufacture has been described previously (Burmeister et al., 2003, 2008; Zhang et al., 2009). Briefly, two sites on an “R2” ceramic-based multielectrode array (total of four sites, 50 × 150 μm per site with 50 μm space between sites) were coated with choline oxidase (1 U in 5 μl coating solution) as choline-sensitive channels, whereas the remaining two sites were coated with the same coating solution except the oxidase, serving as self-referencing control channels. Coated sensors were then plated with meta-phenylenediamine dihydrochloride (Sigma) to exclude large interfering molecules such as dopamine, ascorbic acid, etc.
Choline sensors were calibrated in vitro before and after acute recordings. Sensitivity and selectivity were calculated based on regression [postcalibration sensitivity, 27.0 ± 2.0 pA/μm; selectivity, 301 ± 63 (choline vs ascorbic acid); average ± SEM]. In the analysis, we only included the experiments performed with sensors showing satisfactory postcalibration properties (sensitivity, >15 pA/μm; selectivity, >150). Limit of detection (LOD) was calculated based on in vivo signal (see below, Choline signals and noise reduction). Using data from in vitro calibration, choline sensor response time was estimated as the time between choline addition and the time when the choline response reached 80% of its maximal value. Since this conservative estimation included additional choline diffusion time, the actual sensor response time should be shorter (compare with supplemental Fig. 2B, available at www.jneurosci.org as supplemental material).
Acute recording
Acute recordings were performed in rats with urethane anesthesia (1.25–1.5 g/kg body weight, i.p.). Rats were positioned in a stereotaxic frame, and craniotomies were opened for hippocampus [anteroposterior (AP), −4.0 mm; mediolateral (ML), 2.5 mm; relative to bregma] and/or MSvDB (AP, +0.7 mm; ML, 1.5 mm).
Amperometry.
For choline recordings, a miniature Ag/AgCl reference electrode was secured above the frontal cortex. A choline sensor was then lowered into the hippocampus, and signals were recorded with the FAST-16 electrochemical recording system (Quanteon). After 30–60 min when baseline stabilized, data acquisition started. The choline sensor was lowered from −1.8 mm to −3.4 mm (below dura) at 0.2 mm increments, and tail pinches (30–120 s) were applied at each depth to induce theta activity (Kramis et al., 1975) and potential choline increase. Five to 10 minutes were set between trials for local field potential (LFP) and choline signal to return to baseline.
Electrophysiology.
For single-unit recordings, stainless steel screws were secured above frontal and parietal cortex as grounds. A 4 × 4 multielectrode array (35 μm tungsten wires, 250 μm spacing) was inserted at a 15° angle targeting MSvDB. Single units were identified as the array was lowered between 5.8–7.5 mm from dura. Activities were sampled at every 0.2–0.3 mm where a maximal number of single units were found. Tail pinches were applied similarly as in amperometry recordings, and the activities of single units were recorded with the Plexon Neurosurgery WorkStation (Plexon).
Data analysis
All data analyses were performed with MATLAB (The MathWorks), except off-line sorting of single-unit waveforms.
Theta oscillations in HFC of amperometric signals.
The total frequency spectrum of amperometric signals contains both low-frequency chemical signals and HFCs that reflects LFPs as described previously (Zhang et al., 2009). We high-pass filtered the raw signal (>0.5 Hz), and used this HFC as indicative of LFP activity. Power spectrograms were calculated using multitaper spectral methods (Chronux package, www.chronux.org) (Mitra and Bokil, 2007).
Theta oscillations were recognized when a dominant band appeared in the power spectrogram within the frequency range of 2.2–5 Hz (Manns et al., 2000; Varga et al., 2008). For each individual experiment (rat), the exact frequency range of the theta band was determined based on the actual frequency range of the dominant oscillation band. These oscillations were confirmed as theta since they reversed their phases as the sensor electrodes reached deeper layers of hippocampus. Recordings with a prominent theta band, but without phase reversal, were not included for analysis. We calculated the depth profile of amplitude and phase and determined the depth that theta phase fully reversed from the phase in stratum oriens and used this depth as depth “0” for calculating the choline depth profile in each experiment. Considering the slight difference between our phase-reversal definition and that in the literature (midpoint of phase reversal) (Bland and Whishaw, 1976; Zhang et al., 2009), and the fact that our sensor electrode was much larger (150 μm vertical size) than microelectrodes used in most previous studies, the depth 0 in our experiments was around 300 μm below the pyramidal layer (supplemental Fig. S3, available at www.jneurosci.org as supplemental material). Relative theta power (theta index) was calculated as the ratio between power in the theta band and the theta plus delta bands (delta is defined as 0.5 Hz to the low end of theta) with a moving window (8 s, 0.5 s step). Occasionally, breathing would induce an artifact around 1 Hz. If this artifact was visible in the power spectrum, the power from this band was excluded.
Choline signals and noise reduction.
After removing the HFCs, the remaining lower-frequency amperometric signal (≤0.5Hz) was further processed to obtain the choline signal (supplemental Fig. S1B, available at www.jneurosci.org as supplemental material). First, data pieces that contained pinch trials (5–15 min) were separated out. Very slow decay of baseline, approximated as a linear decay, was removed from all channels for each individual trial, which aligned the signal during baseline delta periods to 0 (low-frequency, baseline-removed amperometric signal denoted as i′x, x = 1–4). Then, we also removed common noise, including the common electrophysiological signal, using a self-referencing procedure (Parikh et al., 2007; Zhang et al., 2009). Additionally, we also took into account the effective electrode area that may vary slightly between channels, by calculating normalization factors (nx, x = 1–4, n4 was arbitrarily defined as 1) based on the averaged HFC amplitude for all the baseline delta periods during each experiment (Zhang et al., 2009) (Fig. 2A and supplemental Fig. S3, available at www.jneurosci.org as supplemental material). Using these normalization factors, we performed corrected self-referencing (see equations below) on choline channels to generate denoised choline channel signals. The two control channels were referenced to each other to generate denoised control channel signals. These signals were finally converted to the choline/control signal based on the in vitro choline channel sensitivity [Sx, x = 1–4; sensitivity on control channels was taken as the average of sensitivity on choline channels, Sctrl = (Scho-1 + Scho-2)/2]. Therefore, the corrected self-referencing procedure described above can be expressed in the following equations:
 |
Figure 2.

Phasic choline increase coupled to theta oscillations. A, An example of phasic choline increase coupled to theta oscillations induced by tail pinch (between pink lines). Red and blue traces, Choline and control signals; black lines, local fit of the two signals. Horizontal dotted lines indicate ±3 × SD of baseline fluctuations. The pseudocolor spectrogram (bottom) shows theta oscillations caused by pinch. B, Phasic choline increases averaged from 10 rats, each from the depth that showed maximal choline increase in an individual rat (more details about depth distribution in Fig. 3). For all trials included (29 trials total), choline increase exceeded its baseline fluctuation (3 × SD). Pink line, Pinch start; solid lines and shading, average ± SEM; Control (Time), signals on control channels in the same pinch trials but at other depths; Control (Depth), signals on control channels at the same depth that showed choline increase but in other trials in the same experiment. C, Choline increase quantified (averaged for 120 s after pinch) for all trials in B. Black dots, Values from individual trials; **p < 0.001. D, Choline increases accompanying spontaneous as well as pinch-induced theta. Overlaying gray boxes indicate three pinches. Red and blue traces, Choline and control; black trace, theta index calculated from spectrogram; gray trace in the bottom, HFC of amperometric signal. Spectrogram calculated from HFC shows the spontaneous and induced theta. Arrows indicate spontaneous choline/theta with amplitude comparable to pinch-induced ones (opaque gray boxes).
This denoise/self-referencing procedure produced signals with low noise and could achieve LOD usually lower than 100 nm (3 times the SD of choline signal during baseline) (supplemental Fig. 1C, available at www.jneurosci.org as supplemental material). Self-referencing between the two control channels only helped lowering signal noise but did not change the conclusion on choline increase (control channels without self-referencing showed results similar to those in Fig. 2, B and C). For each pinch trial, signals were displayed for 60 s before pinch start to 240 s after, and baseline values were calculated for 30 s before pinch start. ACh release was calculated as the average of choline signal 0–120 s after pinch start, with baseline subtracted. Baseline choline signals in 4 of 14 rats had large noise in vivo, making the detection of potential choline release impossible. These four rats were thus excluded from further analysis.
Estimation of choline or theta rising time.
After pinch, theta index and choline signal rose to a maximum and then decayed. To estimate the speed of such rise, we calculated the rise time and slope. Before this calculation, choline signal was first smoothed using a local-fit algorithm (Chronux) to remove residual transient artifacts. Maximal values (baseline subtracted) were found for choline signal or theta index between 0 and 180 s after pinch start, and rise time (T80) was defined as the time the signal reached 80% of its maximal. The slope was defined as the reciprocal of the time between 30 and 70% of the maximal, and multiplied by 0.4.
We also used an alternative means to estimate the lag between theta and choline rise. Cross-correlation was calculated between the two signals for each trial, and lag time corresponding to the correlation maximum between −100 and +180 s was determined and used for estimating time lag.
Single-unit activities.
Electrophysiological recordings were processed off-line to obtain single-unit data using Offline Sorter software (Plexon). Single units were identified with their distinctive waveforms, separation from noise clusters, and clear refractory period (>1 ms) based on the interspike interval histogram (Nicolelis et al., 2003). Of 159 MSvDB single units (neurons), 96 were included in further analysis, as they were from trials in which theta appeared instantaneously after pinch onset. Time stamps of action potentials (spikes) were analyzed in MATLAB. Firing rates were calculated by binning spikes with 0.5 s bins and smoothed for 2 s windows. The overall firing rate was calculated as the average of the whole recording session for each neuron. Pinch-on neurons (68 of 96) were defined as neurons that had increased firing rate beyond their baseline fluctuations (3 times the SD) after pinch onset. Rising time (T80) was defined similarly as for choline signal or theta index, and slope was calculated between 0 and 70% of maximum (baseline subtracted).
Statistical methods.
Nonparametric comparisons were used for tests on the amount of ACh release and the temporal characteristics of signals (rise time or slope). Specifically, the Mann–Whitney test (or Kruskal–Wallis test) was used for comparisons between two (or more) independent groups; the Wilcoxon signed ranks test was used for paired comparisons.
Results
To study the dynamics of both ACh and theta oscillations on the time scale of seconds, and the interactions between these two types of signals, one approach is to implement two independent recording systems, amperometry and electrophysiology, simultaneously in the same animal. Such combined recordings have been technically difficult to achieve, particularly because two separate recording probes would have to be used concurrently. Using a novel approach recently developed in our laboratory (Zhang et al., 2009), we circumvented this crucial bottleneck and acquired both types of signals using a modified amperometric recording apparatus alone. With amperometric choline sensors (Burmeister et al., 2003) placed in the dorsal CA1 area of urethane-anesthetized rats, we separated the resulting amperometric signal, based on its overall frequency spectrum, into a low-frequency component, containing chemical information, and a HFC, representing LFPs (Zhang et al., 2009) (Fig. 1). By further processing the lower-frequency component, through corrected self-referencing, we were able to extract choline signals (supplemental Fig. S1A, available at www.jneurosci.org as supplemental material) whose time-dependent changes reflect the dynamics of ACh releases (Parikh et al., 2004, 2007). Overall, this new experimental approach allowed us to simultaneously monitor the dynamics of both ACh release and theta oscillations, from the same recording site (sensor electrode).
Figure 1.

Simultaneous recording of choline fluctuation and theta oscillations with amperometry. A, Schematics and example of amperometry recording with a four-channel choline sensor in the hippocampus. In this example, channel 1 (Ch#1; blue) and channel 2 (Ch#2; green) were coated with choline oxidase, whereas channel 3 (Ch#3; red) and channel 4 (Ch# 4; cyan) were control channels. Channel assignment for enzyme coating was reversed in half of the sensors. B, Amperometric signal from an individual channel can be separated into low- and high-frequency components, reflecting chemical and LFP signals, respectively (Zhang et al., 2009).
Phasic choline increase coupled to theta oscillations
To study theta-related ACh release on the level of seconds, we first tested whether phasic ACh release co-occurs with theta oscillations induced by tail pinch (Kramis et al., 1975). As a representative trial shown in Figure 2A, tail pinch induced a clear switch from baseline delta activity (1–2 Hz) to theta oscillations (2.2–5 Hz), and a concomitant increase of choline concentration, peaking around 100 nm and lasting about 200 s. This increase in choline reflected a significant phasic ACh release that accompanied the appearance of theta oscillations on the time scale of tens of seconds. We observed such release in 10 of 14 rats in which theta oscillations were induced (remaining 4 rats had large noise in vivo and were thus excluded from further analysis). We pooled trials from individual rats at a depth that had the largest choline increase (depth-related analysis will be described in detail in the next section) and summarized results for all the trials with choline increases exceeding 3 times the SD of the baseline (Fig. 2B, 29 of 42 trials). To confirm that the increases were indeed choline signal and not resulting from nonspecific signals that occurred in the same trials, signals on choline-sensitive channels were compared with signals from non-enzyme-coated control channels recorded at the same time (but at different depths). Furthermore, to control for the difference in channel depths, we also compared the choline signals with signals from control channels recorded at the same depth where the choline increase was observed (but in different trials). Quantification of these choline increases (average choline signals for the first 120 s after pinch start) showed that they were significantly different from the signals on control channels (Fig. 2C, right) (Mann–Whitney test, both p < 0.001). The lack of significant signals on control channels confirmed that the choline increases, and thus the phasic ACh releases, did not result from nonspecific chemical signals, nor did it reflect very slow LFP signals.
Although occurring together, the phasic ACh release and theta oscillations described above could have been two independent responses brought together by the pinch. Alternatively, these two phenomena may share a common mechanism and may co-occur in the absence of external stimuli. Therefore, we asked whether the fluctuations of the choline signal would accompany the appearance of spontaneously occurring theta oscillations. This was indeed the case in three of four rats when spontaneous theta occurred without any external stimulation. Choline signals in the remaining rat were noisy during the experiment and thus prevented the detection of significant increases in the choline signal. As the example shown in Figure 2D, these choline fluctuations had similar or slightly smaller amplitudes compared with those induced by pinch and could occur as frequently as every 10–20 s, closely matching the rise and ebb of spontaneous theta oscillations. These results suggest that phasic ACh release is highly correlated with theta oscillations on the time scale of tens of seconds, regardless of whether theta is spontaneous or induced.
Maximal choline increase around CA1 pyramidal layer
Cholinergic axons and varicosities in the hippocampus show layer-specific distributions (Mechawar et al., 2000), suggesting that ACh release may differ across layers. To test this hypothesis, we quantified phasic choline increases at different depths in the dorsal CA1 area, which has been divided into layers based on morphology and cell distributions (Andersen et al., 1996). Taking advantage of the theta information obtained from the same sensor electrodes, we determined the depth of the recording site relative to the site of theta phase reversal, which is situated characteristically below the pyramidal layer (Bland and Whishaw, 1976; Zhang et al., 2009). In the example shown in Figure 3, A and B, we observed maximal choline increase 0.3 mm above the point of full theta phase reversal. Aligned to the phase reversal point in individual rats, choline increases were largest 0.3–0.6 mm above the phase reversal point (Fig. 3C) (Kruskal–Wallis test, p < 0.001). The release at 0.3–0.4 mm were marginally larger than at 0.5–0.6 mm (Fig. 3D) (Mann–Whitney test, p = 0.08, two tailed). The median values at each depth similarly demonstrated such depth-related variation. Based on anatomy and the theta amplitude profile (Bland and Whishaw, 1976; Winson, 1976; Scarlett et al., 2004), 0.3–0.4 mm above phase reversal corresponds to the CA1 pyramidal layer and/or slightly above (supplemental Fig. S3, available at www.jneurosci.org as supplemental material). Thus, our results suggest that the maximal phasic ACh release in the CA1 occurs around or slightly above the pyramidal layer.
Figure 3.

Maximal phasic choline increase observed around CA1 pyramidal layer. A–C, Examples of phasic choline increases in one experiment. A, Depth profiles of theta amplitude and phase for HFC on all four channels. Depth 0, Phase fuly reversed; horizontal box, putative pyramidal layer. B, Choline and control signals induced by pinch. Pink line, Pinch start. C, Choline increase quantifications (120 s average) at different depths, with maximal observed at +0.3 mm. D, Summary of depth distribution of choline increase from 10 rats. Histograms show varying choline increase distributions at different depths. Maximal choline increase appeared around 0.3–0.6 mm above phase reversal. Red and blue lines indicate median values at each depth, with a peak at 0.3–0.4 mm for choline. *p < 0.05, compared with distributions at other depths; increases at 0.3–0.4 mm were marginally larger than those at 0.5–0.6 mm; p = 0.08, two tailed.
Choline increase lagging behind theta initiation
Previous studies hypothesized that MSvDB cholinergic neurons could pace theta oscillations (Smythe et al., 1992; Brazhnik and Fox, 1997). If they do, ACh should be released at the same time as the initiation of theta oscillations. Other studies, however, suggest that these neurons may not be directly responsible for the generation/pacing of theta oscillations (Griffith and Matthews, 1986). To disambiguate these competing hypotheses, we investigated the temporal relationship between phasic ACh signals and the initiation of theta oscillations. As the example in Figure 4A illustrates, the phasic choline increase was often very slow, ramping up over a few tens of seconds. On the other hand, the onset of theta was very fast (usually <5 s), illustrated by the abrupt increases of the theta power index (see Materials and Methods). Over all trials, the theta index rose much faster than the choline signal, reflected by either the rise time or the rise slope (Fig. 4B) (Wilcoxon signed ranks test, both p < 0.001). We further estimated the difference of rise time between these two signals using the time offset of the peak in the cross-correlogram (Fig. 4C). The delay of choline signals relative to theta oscillations was around 20–50 s, consistent with the estimate from the difference in their respective rise time (Fig. 4D) (H0: lag time = 0; Wilcoxon signed ranks test, p < 0.001). Such a time lag could not be attributed to a delay caused by the choline sensor (sensor response time, 6.2 ± 0.9 s, average ± SEM; p < 0.001 compared with choline signal rise time, t test) (flow-injection analysis example in supplemental Fig. S2, available at www.jneurosci.org as supplemental material). Overall, these results indicate that there was a genuine lag between the slow rise of ACh release and the rapid theta initiation. This consistent delay supports the view that the phasic ACh release does not participate in the initiation of theta oscillations.
Figure 4.
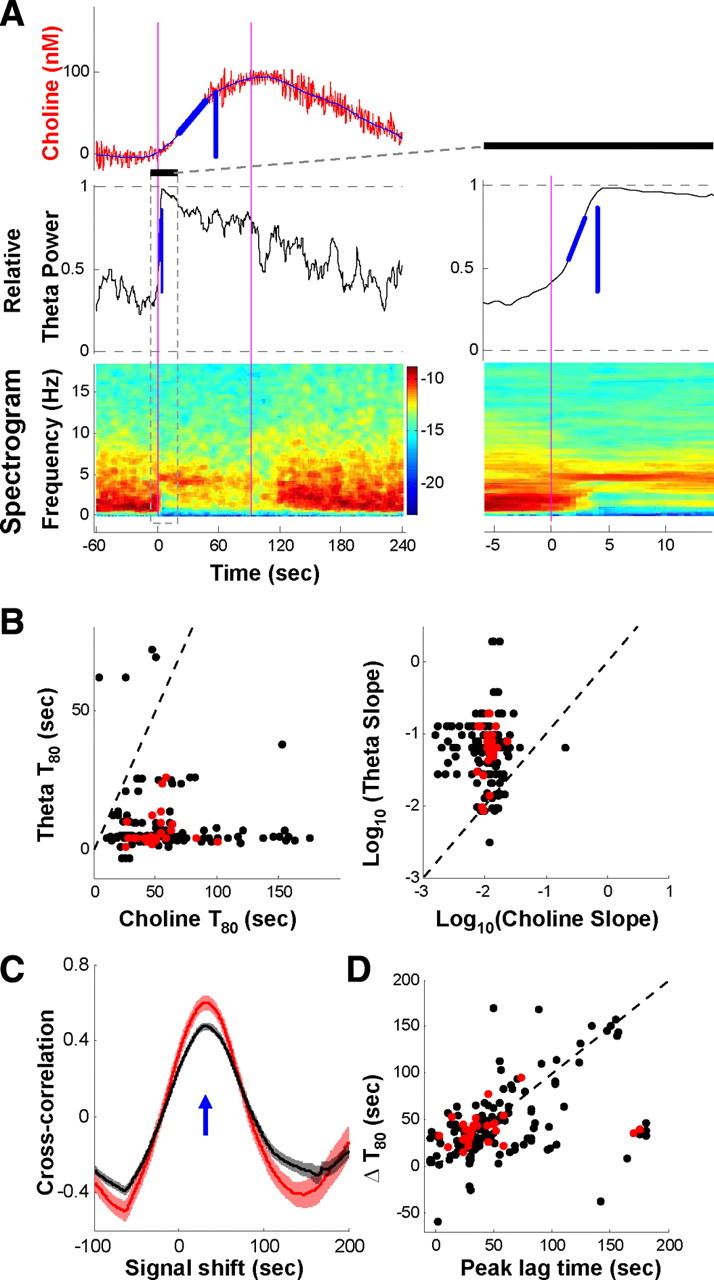
Phasic choline increase often lags theta initiation. A, An example of slower choline increase compared to concomitant theta oscillations. Vertical blue lines indicate the time at which the choline signal or theta index reached 80% of its maximal value (T80, or rise time). Oblique blue lines indicate slopes for the signals to rise from 30 to 70% of maximum. Inset, Magnified view of rapid rise of theta index (indicated by the box and black bar on the left). B, Summary of rise time (left) and slope (right) for simultaneous pair of choline signal and theta index. Each pair (one point) from one trial with significant choline increase; red points from the trials displayed in Figure 2, B and C. Dashed lines indicate unity. Rise time for theta (theta initiation) was usually very short (<5 s), much faster than choline rise (both T80 and slope, p < 0.001). C, Cross-correlation between choline signal and theta index. Red curves, Trials in Figure 2, B and C; black curves, all trials with choline increase; solid lines and shading, average ± SEM. The blue arrow indicates the lag time with the maximal correlation (30–70 s, theta leading). D, Summary of correlation lag time and rise time difference (ΔT80) for all trials in B. The dashed line indicates unity.
Activities of a subpopulation of low-firing-rate neurons in MSvDB matching the slow choline increase
To further corroborate our observation that phasic ACh rises slowly, lagging the onset of theta oscillations, we tested the prediction that the MSvDB cholinergic neurons similarly increase their firing rate at a slow speed to account for the slow ramping of choline signals. Since recent studies suggested that MSvDB cholinergic neurons in vivo have a low firing rate (below 4 Hz) (Simon et al., 2006), we were particularly interested in the firing properties of low-firing-rate MSvDB neurons, which have not been the focus in most MSvDB single-unit studies.
To test our prediction, we implemented simultaneous extracellular recording in the MSvDB and concurrent choline amperometry in the hippocampus in the same animal (Zhang et al., 2009). Figure 5A illustrates an MSvDB neuron that was virtually silent during the baseline period and only fired after the onset of theta oscillations, with firing rate increases closely matching the simultaneous choline signal. We found two neurons of such behavior out of 24 neurons recorded. Because of the extreme difficulty and low yield of carrying out these concurrent recordings, most MSvDB extracellular recording sessions were acquired without simultaneous choline recordings, while maintaining the same pinch stimulation protocol to induce theta oscillations and the slow ramping of ACh release. Overall, MSvDB neurons displayed two major patterns of firing rate changes: high-firing-rate neurons (overall firing rate >4 Hz) often had a rapid increase in firing at pinch onset, whereas low-firing-rate neurons (<4 Hz) increased their firing rate over tens of seconds during pinch-induced theta oscillations (see an example of six neurons in a single trial shown in Fig. 5B). We identified pinch-on MSvDB neurons that increased their firing because of the pinch and quantified the rise time and slope of the firing increase (Fig. 5C). The two groups of pinch-on MSvDB neurons (>4 or <4 Hz) were significantly different for both temporal dynamics measures (Fig. 5D) (Mann–Whitney test, both p = 0.001). The majority of the high-firing-rate MSvDB neurons increased their firing rapidly at theta onsets (Fig. 5E) (rise time < 10 s, 23 of 33, 70%), consistent with a role in pacing theta oscillations. In contrast, a substantial proportion of the low-firing-rate MSvDB neurons increased their firing slowly (rise time > 20 s, 18 of 35, 51%, compare to 21% for high-firing-rate neurons), matching the slow increase of choline signal shown in Figure 4.
Figure 5.

A subpopulation of low-firing-rate MSvDB neurons has slow firing rate increase matching the slow choline increase. A, Firing rate change of a single MSvDB neuron matching simultaneously recorded choline signal, both rising slowly, whereas theta initiation was much faster (spectrogram on top). Pink lines, Pinch start/end; raster in bottom, neuronal spikes. Inset, Raw spike waveforms. B, Six MSvDB neurons (single units) recorded simultaneously during one pinch trial. Pink lines, Start and end of the pinch. Three neurons on the left had a high average firing rate (>4 Hz) and increased their firing rates rapidly after pinch, whereas the three low-firing-rate MSvDB neurons (right) increased their firing over tens of seconds. C, Example of two simultaneously recorded neurons with rise time (T80, vertical blue line) and slope (0–70% maximal, oblique blue line) calculated. Time 0, Pinch start, cyan and black traces, 2 s smoothed and local-fit firing rates; horizontal dotted lines, 3 × SD of baseline fluctuation. Insets, Raw spike waveforms. D, Summary for all neurons (single units) with significant increase in firing during pinch-induced theta episode, grouped according to their average firing rates (>4 or <4 Hz). Most high-frequency neurons have rapid rise, matching the rapid theta initiation. In contrast, a substantial proportion of low-firing-rate neurons (gray rectangles; 51%) increase their firing much slower, consistent with the relative slow increase of choline signals in Figure 4. E, Summary table of the number of neurons in different categories. Columns show categories defined by firing rate (FR). Pinch-on neurons are further separated into slow-increase (T80 > 20 s) and fast-increase (T80 < 10 s) categories, and the percentages are shown in parentheses. F, Pooled signals show matching dynamics. Each signal (choline, theta index, and unit firing rate) from individual trials was baseline removed and normalized to its maximum. Solid and dotted lines, Average ± SEM. Choline/theta signals and unit recordings were obtained from separate experiments. Left, Firing rate changes of low-firing-rate, slow-increase (T80 > 20 s) neurons (n = 18) matched the slow increase of choline signals (n = 29 trials in Fig. 2, B and C). Right, Firing rate changes of high-firing-rate, fast-increase (T80 < 10 s) neurons (n = 23) matched the fast theta dynamics (n = 29 trials in Fig. 2, B and C). Normalized unit firing rate signals were scaled to match choline and theta signals (left, 3; right, 1.4).
To further compare the dynamics of the choline/theta signals to the firing rate changes of different neuronal groups, we inspected the pooled, normalized signal traces. Although the amperometry (choline/theta signals) and the electrophysiology (unit firing) recordings were performed separately, the population results showed very similar dynamics (Fig. 5F), with the low-firing-rate, slow-increase (T80 > 20 s) neurons matching the slow increase of choline signals and the high-firing-rate, fast-increase (T80 < 10 s) neurons matching the fast theta dynamics. All the results above demonstrated that a subpopulation of MSvDB low-firing-rate neurons modulate their firing rate similar to the slow choline ramp, suggesting that these neurons may represent septohippocampal cholinergic neurons.
Discussion
Using amperometric techniques, we demonstrated for the first time that the in vivo phasic ACh release is highly correlated with theta oscillations on spatiotemporal scales finer than traditional views. In the dorsal CA1 area of urethane-anesthetized rats, phasic ACh releases lasting tens of seconds occurred maximally around or slightly above the pyramidal layer (Fig. 3), cofluctuating with spontaneous or induced theta oscillations (Fig. 2). These phasic releases were not required for the initiation of theta oscillations, because the ACh concentration ramped up slowly, trailing theta onset by tens of seconds (Fig. 4). Such dynamics matched the firing rate change of a subpopulation of MSvDB low-firing-rate neurons (Fig. 5), which are likely putative cholinergic neurons and the source of the phasic ACh release. Demonstration of such fine-scale ACh dynamics in the hippocampus provides new insights on the functions of in vivo ACh signals and raises new questions regarding the relationship between ACh dynamics and theta oscillations.
Generic method to study interaction between rhythmic activities and neurotransmitters/neuromodulators
Our study is the first one, to our knowledge, that addressed the dynamics of a major neurotransmitter/neuromodulator associated with particular brain oscillations on fast temporal scales of seconds to tens of seconds in vivo. In general, studies on interactions between brain oscillations and associated neurochemical mechanisms have been hindered by technical difficulties. Although voltammetric methods have opened up venues for fast acquisition of chemical dynamics (Adams, 1990; Dale et al., 2005), it remains very difficult to obtain simultaneous recordings of both neurochemical and electrophysiological signals with independent recording setups. Our method, which circumvents such key technical difficulty, can be applied universally to other investigations of similar type.
ACh and theta oscillations
Previous lesion and pharmacological studies have shown that an intact cholinergic system is required for certain attributes of theta oscillations, including the occurrence of type II theta oscillations and modulation of the power of type I theta oscillations (for review, see Bland, 1986; Vanderwolf, 1988; Vertes and Kocsis, 1997; Buzsaki, 2002). Our data add to this literature and show that ACh release accompanies the appearance of theta oscillations, revealing yet another level of the tight connection between ACh and theta oscillations on much faster temporal scales than previously known.
The function of such phasic ACh release is still unclear. Because the ACh system is required for the occurrence of type II theta oscillations, one possibility could be that phasic ACh releases directly contribute to theta generation. Our data do not support this possibility, at least for the initiation of theta oscillations, because theta onset in our experiments was much faster and earlier than the phasic ACh releases (Fig. 3). Our estimation of theta onset was conservative, because the calculation of theta index smoothed the almost instantaneous appearance of theta oscillations (supplemental Fig. S2A, available at www.jneurosci.org as supplemental material). On the other hand, the slow increase of choline signal did not result from the response time of choline sensors (supplemental Fig. S2B, available at www.jneurosci.org as supplemental material). Rather, it reflected the true temporal dynamics of in vivo ACh signals in our experiments, as ACh dynamics in similar experimental setups could be faster when induced by other means (Parikh et al., 2004; Burmeister et al., 2008; Giuliano et al., 2008). Together, theta initiation clearly does not require these phasic ACh releases. It is important to note, however, that our observation does not rule out the possibility that a tonic baseline level of ACh is required for theta generation/initiation.
Alternatively, the functions of phasic ACh releases may be to contribute to the power and/or duration of theta oscillations (Monmaur et al., 1997; Keita et al., 2000). Since theta power/duration is influenced by anesthesia depth (Bland et al., 2007; Musizza et al., 2007), this hypothesis needs to be tested more systematically in subsequent studies.
A more intriguing possibility concerns the roles in neural plasticity and memory formation played by ACh and theta, either of which has been separately implicated in many early studies. Particularly, cholinergic transmission permits and promotes hippocampal long-term potentiation formation (Jerusalinsky et al., 1997; Segal and Auerbach, 1997; Leung et al., 2003; Doralp and Leung, 2008) and permits the reorganization of cortical sensory representation (Kilgard and Merzenich, 1998; Sachdev et al., 1998; Conner et al., 2005; Origlia et al., 2008) as well as associated behavioral memory (Bakin and Weinberger, 1996). Temporally specific activation of cholinergic nuclei was shown to be effective in inducing such plastic changes also (Bakin and Weinberger, 1996), whereas temporally mismatched activation interferes with specific memory (Winters et al., 2007). Similarly, theta oscillations also promote plasticity and learning (Larson et al., 1986; Pavlides et al., 1988; Kahana et al., 2001; Hyman et al., 2003) and have been speculated to serve as a short-term tag for memory, designating memory traces to be consolidated by neuromodulatory inputs (Vertes, 2005). Based on these lines of observation, we propose that the function of phasic ACh releases, which are called on after the onset of theta oscillations, may be to work synergistically with theta oscillations to consolidate the synapses that have been tagged and selected by the preceding theta oscillations. This coordination between theta oscillations and ACh releases may thus provide an exceptional opportunity to consolidate recent memory traces and to dynamically modulate neural plasticity on much finer temporal windows than traditionally assumed.
Temporally and spatially refined ACh action
More generally, elucidating the functions of the cholinergic systems requires the understanding of the temporal and spatial characteristics of ACh release. Because of the lack of experimental evidence on faster time scales, the assumptions that in vivo ACh dynamics are very slow have been incorporated into modeling and theoretical frameworks (Woolf, 1996; Cartling, 2001; Hasselmo et al., 2002), limiting the consideration of ACh functions most often to the time scale of arousal state alternations. The time scale of phasic ACh release that we observed in the hippocampus is much faster than previously assumed and is consistent with the dynamics of ACh action on its targets, particularly through muscarinic receptors (Cole and Nicoll, 1984; Hasselmo and Fehlau, 2001). Comparable phasic ACh releases have recently been observed in the cortex in behaving rats (Parikh et al., 2007), with considerably faster dynamics (a few seconds) and larger peak amplitude. These differences may result from intrinsic differences in firing properties between cholinergic neurons in MSvDB and in caudal basal forebrain (Lee et al., 2005; Simon et al., 2006), projecting to hippocampus and cortex, respectively. Alternatively, phasic ACh releases in unanesthetized rats may have faster onset and temporal dynamics, in general.
The functioning of ACh also depends on the spatial distribution of its release, which has long been considered as diffuse transmission (Descarries et al., 1997). However, histological studies have shown that cholinergic innervations in CA1 are higher in the strata oriens and pyramidale (Lysakowski et al., 1989; Arvidsson et al., 1997; Mechawar et al., 2000), consistent with the layer-specific distribution of phasic ACh release (Fig. 3). Since different layers of CA1 substantiate different input–output functions (Andersen et al., 1996; Freund and Buzsaki, 1996; Megias et al., 2001), the local heterogeneity of phasic ACh release that we observed is well positioned to influence the soma and directly modulate the output of the CA1 hippocampal neurons. The spatial distribution of phasic ACh release in other hippocampal subfields needs further investigation.
Together, our results provide experimental bases for future theoretical framework and modeling regarding the functions of ACh and theta oscillations in the hippocampus on much finer spatiotemporal scales than long-held traditional views.
Putative cholinergic neurons in MSvDB
Our single-unit recording revealed two major groups of neurons in MSvDB with distinct physiological properties (Fig. 5), which may reflect the different types of neurotransmitter used.
Since cholinergic and GABAergic neurons in MSvDB are critical for theta generation (Mizumori et al., 1989; Lee et al., 1994; Leung et al., 1994; Yoder and Pang, 2005), a lot of interest and debate have been devoted to the chemical identity of the MSvDB neurons recorded in vivo. Previous studies speculated that both cholinergic and GABAergic neurons can fire at high frequencies and pace theta oscillations (Stewart and Fox, 1989; Brazhnik and Fox, 1997; Apartis et al., 1998). However, more recent studies seem to be reaching a consensus that only fast firing GABAergic neurons in MSvDB fire rhythmically and pace theta oscillations (Serafin et al., 1996; Borhegyi et al., 2004), whereas cholinergic neurons probably discharge at a low rate (Markram and Segal, 1990; Sotty et al., 2003; Simon et al., 2006). Given the technical difficulty in determining the chemical identities of the in vivo-recorded neurons, only one study has identified cholinergic neurons in vivo and concluded that the few cholinergic neurons in their study were all low firing rate and could not rhythmically burst in relation to theta (Simon et al., 2006). Our results are consistent with the idea that a subpopulation of low-firing-rate neurons are cholinergic neurons. Those low-firing-rate neurons with a slow firing rate increase may be the cholinergic neurons responsible for the observed ACh release. Interestingly, despite their slow increase over tens of seconds matching the choline dynamics, the firing rates of the putative cholinergic neurons also showed a modest but fast rise at theta onset (Fig. 5F). Such transient acceleration may result in a transient and modest ACh release which, if present, is too fast and/or too small to be captured by the detection technique currently available. On the other hand, the majority of the high-firing-rate neurons increased their firing almost instantaneously, consistent with the view that GABAergic neurons pace theta oscillations. Future technical advancement with improved resolution may help to test these hypotheses.
Footnotes
This research was supported by National Institutes of Health (NIH) Grant 5R01 DE011451-11 and NIH–National Institute of Neurological Disorders and Stroke Grant R33NS049534 to M.A.L.N. and by the National Alliance for Research on Schizophrenia and Depression 2008 Young Investigator Award and the Intramural Research Program of the National Institute on Aging (NIH) to S.-C.L. We thank Dr. Georgia Alexander for critical discussions and comments on this manuscript, G. Lehew and J. Meloy for technical assistance, and Susan Halkiotis for proofreading this manuscript.
References
- Adams RN. In vivo electrochemical measurements in the CNS. Prog Neurobiol. 1990;35:297–311. doi: 10.1016/0301-0082(90)90014-8. [DOI] [PubMed] [Google Scholar]
- Andersen P, Morris R, Amaral D, Bliss T, O'Keefe J, editors. Oxford: Oxford UP; 1996. The hippocampus book. [Google Scholar]
- Apartis E, Poindessous-Jazat FR, Lamour YA, Bassant MH. Loss of rhythmically bursting neurons in rat medial septum following selective lesion of septohippocampal cholinergic system. J Neurophysiol. 1998;79:1633–1642. doi: 10.1152/jn.1998.79.4.1633. [DOI] [PubMed] [Google Scholar]
- Arvidsson U, Riedl M, Elde R, Meister B. Vesicular acetylcholine transporter (VAChT) protein: a novel and unique marker for cholinergic neurons in the central and peripheral nervous systems. J Comp Neurol. 1997;378:454–467. [PubMed] [Google Scholar]
- Bakin JS, Weinberger NM. Induction of a physiological memory in the cerebral cortex by stimulation of the nucleus basalis. Proc Natl Acad Sci U S A. 1996;93:11219–11224. doi: 10.1073/pnas.93.20.11219. [DOI] [PMC free article] [PubMed] [Google Scholar]
- Bianchi L, Ballini C, Colivicchi MA, Della Corte L, Giovannini MG, Pepeu G. Investigation on acetylcholine, aspartate, glutamate and GABA extracellular levels from ventral hippocampus during repeated exploratory activity in the rat. Neurochem Res. 2003;28:565–573. doi: 10.1023/a:1022881625378. [DOI] [PubMed] [Google Scholar]
- Bland BH. The physiology and pharmacology of hippocampal formation theta rhythms. Prog Neurobiol. 1986;26:1–54. doi: 10.1016/0301-0082(86)90019-5. [DOI] [PubMed] [Google Scholar]
- Bland BH, Whishaw IQ. Generators and topography of hippocampal theta (RSA) in the anaesthetized and freely moving rat. Brain Res. 1976;118:259–280. doi: 10.1016/0006-8993(76)90711-3. [DOI] [PubMed] [Google Scholar]
- Bland BH, Declerck S, Jackson J, Glasgow S, Oddie S. Septohippocampal properties of N-methyl-D-aspartate-induced theta-band oscillation and synchrony. Synapse. 2007;61:185–197. doi: 10.1002/syn.20357. [DOI] [PubMed] [Google Scholar]
- Borhegyi Z, Varga V, Szilagyi N, Fabo D, Freund TF. Phase segregation of medial septal GABAergic neurons during hippocampal theta activity. J Neurosci. 2004;24:8470–8479. doi: 10.1523/JNEUROSCI.1413-04.2004. [DOI] [PMC free article] [PubMed] [Google Scholar]
- Brazhnik ES, Fox SE. Intracellular recordings from medial septal neurons during hippocampal theta rhythm. Exp Brain Res. 1997;114:442–453. doi: 10.1007/pl00005653. [DOI] [PubMed] [Google Scholar]
- Burmeister JJ, Palmer M, Gerhardt GA. Ceramic-based multisite microelectrode array for rapid choline measures in brain tissue. Anal Chim Acta. 2003;481:65–74. [Google Scholar]
- Burmeister JJ, Pomerleau F, Huettl P, Gash CR, Werner CE, Bruno JP, Gerhardt GA. Ceramic-based multisite microelectrode arrays for simultaneous measures of choline and acetylcholine in CNS. Biosens Bioelectron. 2008;23:1382–1389. doi: 10.1016/j.bios.2007.12.013. [DOI] [PubMed] [Google Scholar]
- Buzsaki G. Theta oscillations in the hippocampus. Neuron. 2002;33:325–340. doi: 10.1016/s0896-6273(02)00586-x. [DOI] [PubMed] [Google Scholar]
- Cartling B. Neuromodulatory control of interacting medial temporal lobe and neocortex in memory consolidation and working memory. Behav Brain Res. 2001;126:65–80. doi: 10.1016/s0166-4328(01)00246-7. [DOI] [PubMed] [Google Scholar]
- Cole AE, Nicoll RA. Characterization of a slow cholinergic post-synaptic potential recorded in vitro from rat hippocampal pyramidal cells. J Physiol. 1984;352:173–188. doi: 10.1113/jphysiol.1984.sp015285. [DOI] [PMC free article] [PubMed] [Google Scholar]
- Conner JM, Chiba AA, Tuszynski MH. The basal forebrain cholinergic system is essential for cortical plasticity and functional recovery following brain injury. Neuron. 2005;46:173–179. doi: 10.1016/j.neuron.2005.03.003. [DOI] [PubMed] [Google Scholar]
- Dale N, Hatz S, Tian F, Llaudet E. Listening to the brain: microelectrode biosensors for neurochemicals. Trends Biotechnol. 2005;23:420–428. doi: 10.1016/j.tibtech.2005.05.010. [DOI] [PubMed] [Google Scholar]
- DeCoteau WE, Thorn C, Gibson DJ, Courtemanche R, Mitra P, Kubota Y, Graybiel AM. Learning-related coordination of striatal and hippocampal theta rhythms during acquisition of a procedural maze task. Proc Natl Acad Sci U S A. 2007;104:5644–5649. doi: 10.1073/pnas.0700818104. [DOI] [PMC free article] [PubMed] [Google Scholar]
- Descarries L, Gisiger V, Steriade M. Diffuse transmission by acetylcholine in the CNS. Prog Neurobiol. 1997;53:603–625. doi: 10.1016/s0301-0082(97)00050-6. [DOI] [PubMed] [Google Scholar]
- Doralp S, Leung LS. Cholinergic modulation of hippocampal CA1 basal-dendritic long-term potentiation. Neurobiol Learn Mem. 2008;90:382–388. doi: 10.1016/j.nlm.2008.05.013. [DOI] [PubMed] [Google Scholar]
- Freund TF, Buzsaki G. Interneurons of the hippocampus. Hippocampus. 1996;6:347–470. doi: 10.1002/(SICI)1098-1063(1996)6:4<347::AID-HIPO1>3.0.CO;2-I. [DOI] [PubMed] [Google Scholar]
- Giuliano C, Parikh V, Ward JR, Chiamulera C, Sarter M. Increases in cholinergic neurotransmission measured by using choline-sensitive microelectrodes: enhanced detection by hydrolysis of acetylcholine on recording sites? Neurochem Int. 2008;52:1343–1350. doi: 10.1016/j.neuint.2008.02.002. [DOI] [PMC free article] [PubMed] [Google Scholar]
- Gold PE. Acetylcholine modulation of neural systems involved in learning and memory. Neurobiol Learn Mem. 2003;80:194–210. doi: 10.1016/j.nlm.2003.07.003. [DOI] [PubMed] [Google Scholar]
- Goutagny R, Jackson J, Williams S. Self-generated theta oscillations in the hippocampus. Nat Neurosci. 2009;12:1491–1493. doi: 10.1038/nn.2440. [DOI] [PubMed] [Google Scholar]
- Griffith WH, Matthews RT. Electrophysiology of AChE-positive neurons in basal forebrain slices. Neurosci Lett. 1986;71:169–174. doi: 10.1016/0304-3940(86)90553-7. [DOI] [PubMed] [Google Scholar]
- Hasselmo ME. The role of acetylcholine in learning and memory. Curr Opin Neurobiol. 2006;16:710–715. doi: 10.1016/j.conb.2006.09.002. [DOI] [PMC free article] [PubMed] [Google Scholar]
- Hasselmo ME, Fehlau BP. Differences in time course of ACh and GABA modulation of excitatory synaptic potentials in slices of rat hippocampus. J Neurophysiol. 2001;86:1792–1802. doi: 10.1152/jn.2001.86.4.1792. [DOI] [PubMed] [Google Scholar]
- Hasselmo ME, Hay J, Ilyn M, Gorchetchnikov A. Neuromodulation, theta rhythm and rat spatial navigation. Neural Netw. 2002;15:689–707. doi: 10.1016/s0893-6080(02)00057-6. [DOI] [PubMed] [Google Scholar]
- Hyman JM, Wyble BP, Goyal V, Rossi CA, Hasselmo ME. Stimulation in hippocampal region CA1 in behaving rats yields long-term potentiation when delivered to the peak of theta and long-term depression when delivered to the trough. J Neurosci. 2003;23:11725–11731. doi: 10.1523/JNEUROSCI.23-37-11725.2003. [DOI] [PMC free article] [PubMed] [Google Scholar]
- Jerusalinsky D, Kornisiuk E, Izquierdo I. Cholinergic neurotransmission and synaptic plasticity concerning memory processing. Neurochem Res. 1997;22:507–515. doi: 10.1023/a:1027376230898. [DOI] [PubMed] [Google Scholar]
- Kahana MJ, Seelig D, Madsen JR. Theta returns. Curr Opin Neurobiol. 2001;11:739–744. doi: 10.1016/s0959-4388(01)00278-1. [DOI] [PubMed] [Google Scholar]
- Keita MS, Frankel-Kohn L, Bertrand N, Lecanu L, Monmaur P. Acetylcholine release in the hippocampus of the urethane anaesthetised rat positively correlates with both peak theta frequency and relative power in the theta band. Brain Res. 2000;887:323–334. doi: 10.1016/s0006-8993(00)03021-3. [DOI] [PubMed] [Google Scholar]
- Kilgard MP, Merzenich MM. Cortical map reorganization enabled by nucleus basalis activity. Science. 1998;279:1714–1718. doi: 10.1126/science.279.5357.1714. [DOI] [PubMed] [Google Scholar]
- Kramis R, Vanderwolf CH, Bland BH. Two types of hippocampal rhythmical slow activity in both the rabbit and the rat: relations to behavior and effects of atropine, diethyl ether, urethane, and pentobarbital. Exp Neurol. 1975;49:58–85. doi: 10.1016/0014-4886(75)90195-8. [DOI] [PubMed] [Google Scholar]
- Larson J, Wong D, Lynch G. Patterned stimulation at the theta frequency is optimal for the induction of hippocampal long-term potentiation. Brain Res. 1986;368:347–350. doi: 10.1016/0006-8993(86)90579-2. [DOI] [PubMed] [Google Scholar]
- Lee MG, Chrobak JJ, Sik A, Wiley RG, Buzsaki G. Hippocampal theta activity following selective lesion of the septal cholinergic system. Neuroscience. 1994;62:1033–1047. doi: 10.1016/0306-4522(94)90341-7. [DOI] [PubMed] [Google Scholar]
- Lee MG, Hassani OK, Alonso A, Jones BE. Cholinergic basal forebrain neurons burst with theta during waking and paradoxical sleep. J Neurosci. 2005;25:4365–4369. doi: 10.1523/JNEUROSCI.0178-05.2005. [DOI] [PMC free article] [PubMed] [Google Scholar]
- Leung LS, Martin LA, Stewart DJ. Hippocampal theta rhythm in behaving rats following ibotenic acid lesion of the septum. Hippocampus. 1994;4:136–147. doi: 10.1002/hipo.450040204. [DOI] [PubMed] [Google Scholar]
- Leung LS, Shen B, Rajakumar N, Ma J. Cholinergic activity enhances hippocampal long-term potentiation in CA1 during walking in rats. J Neurosci. 2003;23:9297–9304. doi: 10.1523/JNEUROSCI.23-28-09297.2003. [DOI] [PMC free article] [PubMed] [Google Scholar]
- Lubenov EV, Siapas AG. Hippocampal theta oscillations are travelling waves. Nature. 2009;459:534–539. doi: 10.1038/nature08010. [DOI] [PubMed] [Google Scholar]
- Lysakowski A, Wainer BH, Bruce G, Hersh LB. An atlas of the regional and laminar distribution of choline acetyltransferase immunoreactivity in rat cerebral cortex. Neuroscience. 1989;28:291–336. doi: 10.1016/0306-4522(89)90180-2. [DOI] [PubMed] [Google Scholar]
- Manns ID, Alonso A, Jones BE. Discharge profiles of juxtacellularly labeled and immunohistochemically identified GABAergic basal forebrain neurons recorded in association with the electroencephalogram in anesthetized rats. J Neurosci. 2000;20:9252–9263. doi: 10.1523/JNEUROSCI.20-24-09252.2000. [DOI] [PMC free article] [PubMed] [Google Scholar]
- Markram H, Segal M. Electrophysiological characteristics of cholinergic and non-cholinergic neurons in the rat medial septum-diagonal band complex. Brain Res. 1990;513:171–174. doi: 10.1016/0006-8993(90)91106-q. [DOI] [PubMed] [Google Scholar]
- Marrosu F, Portas C, Mascia MS, Casu MA, Fa M, Giagheddu M, Imperato A, Gessa GL. Microdialysis measurement of cortical and hippocampal acetylcholine release during sleep-wake cycle in freely moving cats. Brain Res. 1995;671:329–332. doi: 10.1016/0006-8993(94)01399-3. [DOI] [PubMed] [Google Scholar]
- McIntyre CK, Marriott LK, Gold PE. Cooperation between memory systems: acetylcholine release in the amygdala correlates positively with performance on a hippocampus-dependent task. Behav Neurosci. 2003;117:320–326. doi: 10.1037/0735-7044.117.2.320. [DOI] [PubMed] [Google Scholar]
- Mechawar N, Cozzari C, Descarries L. Cholinergic innervation in adult rat cerebral cortex: a quantitative immunocytochemical description. J Comp Neurol. 2000;428:305–318. doi: 10.1002/1096-9861(20001211)428:2<305::aid-cne9>3.0.co;2-y. [DOI] [PubMed] [Google Scholar]
- Megias M, Emri Z, Freund TF, Gulyas AI. Total number and distribution of inhibitory and excitatory synapses on hippocampal CA1 pyramidal cells. Neuroscience. 2001;102:527–540. doi: 10.1016/s0306-4522(00)00496-6. [DOI] [PubMed] [Google Scholar]
- Mitra P, Bokil H. Oxford: Oxford UP; 2007. Observed brain dynamics. [Google Scholar]
- Mizumori SJ, Barnes CA, McNaughton BL. Reversible inactivation of the medial septum: selective effects on the spontaneous unit activity of different hippocampal cell types. Brain Res. 1989;500:99–106. doi: 10.1016/0006-8993(89)90303-x. [DOI] [PubMed] [Google Scholar]
- Monmaur P, Collet A, Puma C, Frankel-Kohn L, Sharif A. Relations between acetylcholine release and electrophysiological characteristics of theta rhythm: a microdialysis study in the urethane-anesthetized rat hippocampus. Brain Res Bull. 1997;42:141–146. doi: 10.1016/s0361-9230(96)00200-6. [DOI] [PubMed] [Google Scholar]
- Musizza B, Stefanovska A, McClintock PV, Palus M, Petrovcic J, Ribaric S, Bajrovic FF. Interactions between cardiac, respiratory and EEG-delta oscillations in rats during anaesthesia. J Physiol. 2007;580:315–326. doi: 10.1113/jphysiol.2006.126748. [DOI] [PMC free article] [PubMed] [Google Scholar]
- Nicolelis MA, Dimitrov D, Carmena JM, Crist R, Lehew G, Kralik JD, Wise SP. Chronic, multisite, multielectrode recordings in macaque monkeys. Proc Natl Acad Sci U S A. 2003;100:11041–11046. doi: 10.1073/pnas.1934665100. [DOI] [PMC free article] [PubMed] [Google Scholar]
- Origlia N, Kuczewski N, Pesavento E, Aztiria E, Domenici L. The role of cholinergic system in neuronal plasticity: focus on visual cortex and muscarinic receptors. Arch Ital Biol. 2008;146:165–188. [PubMed] [Google Scholar]
- Parent MB, Baxter MG. Septohippocampal acetylcholine: involved in but not necessary for learning and memory? Learn Mem. 2004;11:9–20. doi: 10.1101/lm.69104. [DOI] [PMC free article] [PubMed] [Google Scholar]
- Parikh V, Pomerleau F, Huettl P, Gerhardt GA, Sarter M, Bruno JP. Rapid assessment of in vivo cholinergic transmission by amperometric detection of changes in extracellular choline levels. Eur J Neurosci. 2004;20:1545–1554. doi: 10.1111/j.1460-9568.2004.03614.x. [DOI] [PubMed] [Google Scholar]
- Parikh V, Kozak R, Martinez V, Sarter M. Prefrontal acetylcholine release controls cue detection on multiple timescales. Neuron. 2007;56:141–154. doi: 10.1016/j.neuron.2007.08.025. [DOI] [PMC free article] [PubMed] [Google Scholar]
- Pavlides C, Greenstein YJ, Grudman M, Winson J. Long-term potentiation in the dentate gyrus is induced preferentially on the positive phase of theta-rhythm. Brain Res. 1988;439:383–387. doi: 10.1016/0006-8993(88)91499-0. [DOI] [PubMed] [Google Scholar]
- Power AE, Vazdarjanova A, McGaugh JL. Muscarinic cholinergic influences in memory consolidation. Neurobiol Learn Mem. 2003;80:178–193. doi: 10.1016/s1074-7427(03)00086-8. [DOI] [PubMed] [Google Scholar]
- Sachdev RN, Lu SM, Wiley RG, Ebner FF. Role of the basal forebrain cholinergic projection in somatosensory cortical plasticity. J Neurophysiol. 1998;79:3216–3228. doi: 10.1152/jn.1998.79.6.3216. [DOI] [PubMed] [Google Scholar]
- Scarlett D, Dypvik AT, Bland BH. Comparison of spontaneous and septally driven hippocampal theta field and theta-related cellular activity. Hippocampus. 2004;14:99–106. doi: 10.1002/hipo.10151. [DOI] [PubMed] [Google Scholar]
- Segal M, Auerbach JM. Muscarinic receptors involved in hippocampal plasticity. Life Sci. 1997;60:1085–1091. doi: 10.1016/s0024-3205(97)00051-9. [DOI] [PubMed] [Google Scholar]
- Serafin M, Williams S, Khateb A, Fort P, Muhlethaler M. Rhythmic firing of medial septum non-cholinergic neurons. Neuroscience. 1996;75:671–675. doi: 10.1016/0306-4522(96)00349-1. [DOI] [PubMed] [Google Scholar]
- Simon AP, Poindessous-Jazat F, Dutar P, Epelbaum J, Bassant MH. Firing properties of anatomically identified neurons in the medial septum of anesthetized and unanesthetized restrained rats. J Neurosci. 2006;26:9038–9046. doi: 10.1523/JNEUROSCI.1401-06.2006. [DOI] [PMC free article] [PubMed] [Google Scholar]
- Smythe JW, Colom LV, Bland BH. The extrinsic modulation of hippocampal theta depends on the coactivation of cholinergic and GABA-ergic medial septal inputs. Neurosci Biobehav Rev. 1992;16:289–308. doi: 10.1016/s0149-7634(05)80203-9. [DOI] [PubMed] [Google Scholar]
- Sotty F, Danik M, Manseau F, Laplante F, Quirion R, Williams S. Distinct electrophysiological properties of glutamatergic, cholinergic and GABAergic rat septohippocampal neurons: novel implications for hippocampal rhythmicity. J Physiol. 2003;551:927–943. doi: 10.1113/jphysiol.2003.046847. [DOI] [PMC free article] [PubMed] [Google Scholar]
- Stancampiano R, Cocco S, Cugusi C, Sarais L, Fadda F. Serotonin and acetylcholine release response in the rat hippocampus during a spatial memory task. Neuroscience. 1999;89:1135–1143. doi: 10.1016/s0306-4522(98)00397-2. [DOI] [PubMed] [Google Scholar]
- Stewart M, Fox SE. Firing relations of medial septal neurons to the hippocampal theta rhythm in urethane anesthetized rats. Exp Brain Res. 1989;77:507–516. doi: 10.1007/BF00249604. [DOI] [PubMed] [Google Scholar]
- Vanderwolf CH. Hippocampal electrical activity and voluntary movement in the rat. Electroencephalogr Clin Neurophysiol. 1969;26:407–418. doi: 10.1016/0013-4694(69)90092-3. [DOI] [PubMed] [Google Scholar]
- Vanderwolf CH. Neocortical and hippocampal activation relation to behavior: effects of atropine, eserine, phenothiazines, and amphetamine. J Comp Physiol Psychol. 1975;88:300–323. doi: 10.1037/h0076211. [DOI] [PubMed] [Google Scholar]
- Vanderwolf CH. Cerebral activity and behavior: control by central cholinergic and serotonergic systems. Int Rev Neurobiol. 1988;30:225–340. doi: 10.1016/s0074-7742(08)60050-1. [DOI] [PubMed] [Google Scholar]
- Varga V, Hangya B, Kranitz K, Ludanyi A, Zemankovics R, Katona I, Shigemoto R, Freund TF, Borhegyi Z. The presence of pacemaker HCN channels identifies theta rhythmic GABAergic neurons in the medial septum. J Physiol. 2008;586:3893–3915. doi: 10.1113/jphysiol.2008.155242. [DOI] [PMC free article] [PubMed] [Google Scholar]
- Vertes RP. Hippocampal theta rhythm: a tag for short-term memory. Hippocampus. 2005;15:923–935. doi: 10.1002/hipo.20118. [DOI] [PubMed] [Google Scholar]
- Vertes RP, Kocsis B. Brainstem-diencephalo-septohippocampal systems controlling the theta rhythm of the hippocampus. Neuroscience. 1997;81:893–926. doi: 10.1016/s0306-4522(97)00239-x. [DOI] [PubMed] [Google Scholar]
- Winson J. Hippocampal theta rhythm. I. Depth profiles in the curarized rat. Brain Res. 1976;103:57–70. doi: 10.1016/0006-8993(76)90686-7. [DOI] [PubMed] [Google Scholar]
- Winters BD, Bartko SJ, Saksida LM, Bussey TJ. Scopolamine infused into perirhinal cortex improves object recognition memory by blocking the acquisition of interfering object information. Learn Mem. 2007;14:590–596. doi: 10.1101/lm.634607. [DOI] [PMC free article] [PubMed] [Google Scholar]
- Woolf NJ. Global and serial neurons form A hierarchically arranged interface proposed to underlie memory and cognition. Neuroscience. 1996;74:625–651. doi: 10.1016/0306-4522(96)00163-7. [DOI] [PubMed] [Google Scholar]
- Yoder RM, Pang KC. Involvement of GABAergic and cholinergic medial septal neurons in hippocampal theta rhythm. Hippocampus. 2005;15:381–392. doi: 10.1002/hipo.20062. [DOI] [PubMed] [Google Scholar]
- Zhang H, Lin SC, Nicolelis MA. Acquiring local field potential information from amperometric neurochemical recordings. J Neurosci Methods. 2009;179:191–200. doi: 10.1016/j.jneumeth.2009.01.023. [DOI] [PMC free article] [PubMed] [Google Scholar]