

Abstract
A previous hypothesis stated that during osteoarthritis (OA) increased insulin-like growth factor (IGF) binding proteins (IGFBPs) sequester IGFs and limit their access to the cell.
Objective
To test this by: (1) quantifying IGF and IGFBP-3 as well as their ratios in human OA cartilages, and (2) measuring the metabolic responses of diseased cartilage to IGF-I and its IGFBP-insensitive analogs.
Design
Knee or hip OA cartilages were staged for OA by histology. Cartilage slices were either extracted for assays of IGF proteins, or maintained intact as organ cultures. Proteoglycan (PG) metabolism ± IGFs was measured by use of the 35S-sulfate precursor.
Results
IGFBP-3 (ng/mg protein) was weakly correlated with OA score by regression analysis (R2=.122; p=.040; n=35). IGF-I (ng/mg protein) was constant across all OA groups (ANOVA; p=.428, n=18) and the IGF-I/IGFBP-3 ratios were >1 in most samples. All OA cartilages responded to hrIGF-I by increasing PG synthesis (average 2.29 fold ± 0.55 [± S.D.] at saturation, n=12) irrespective of OA score. The des (1-3) IGF-I analog (which lacks the 3 N-terminal amino acids) had similar maximal effects (average 2.23-fold stimulation ± 0.71, n=10), but it was more effective in 2 out of 3 samples at suboptimal doses. The effect of hrIGF-I, des (1-3) IGF-I, or the B-Chain analog on degradation was minimal.
Conclusions
Catabolism was insensitive to IGF-I, and this was probably not due to IGFBPs. By contrast, IGF-I exerted a robust stimulation of anabolism at sufficiently high doses, even though IGFBPs could tone down the ligand effect at low doses.
Keywords: Insulin-like growth factor-I (IGF-I), IGF-binding proteins (IGFBPs), human cartilage, osteoarthritis, IGF-I analog
Introduction
Insulin-like Growth Factor-I (IGF-I) was discovered by its ability to stimulate proteoglycan synthesis in cartilage1. Subsequent studies have verified and extended this key finding, showing that IGF-I also synchronizes matrix synthesis and catabolism to maintain cartilage homeostasis2,3. Osteoarthritis (OA) is a degenerative disease characterized by deregulated cartilage matrix metabolism, with catabolism exceeding synthesis4. The role of signaling factors and cytokines in this demise is of keen importance.
The IGF axis is a tightly regulated signaling system wherein the two closely related ligands; IGF-I and IGF-II signal primarily through the type I IGF receptor (IGF-IR)5,6. The activities of the two ligands are regulated by the high affinity IGF-binding proteins (IGFBPs), a system of 6 homologous proteins encoded by different genes7,8. The IGFBPs are a highly versatile group of proteins with the ability to inhibit or enhance IGF action depending on tissue specific regulation7-9. Interestingly, several of the IGFBPs are also capable of signaling independently of the IGFs presumably through their own cellular receptors10, and/or by direct nuclear interactions11.
Several studies have been carried out to assess levels of IGFBPs in OA Vs normal cartilage. These investigations include the use of culture systems such as chondrocyte monolayers12,13 and cartilage explant cultures14, as well as direct extractions in chaotropic buffers15 or successive cartilage desorptions16 from fresh cartilage derived from surgical interventions. Taken together, the studies provide evidence that IGFBPs are higher in human OA cartilage compared to their normal counterparts. This is most consistently seen with IGFBP-3. Autocrine production of the later IGFBP15,16 has been observed, suggesting the hypothesis that chondrocytes play an active role in the increase of IGFBP-3 during OA. Several studies report increases in other critical proteins of the IGF axis during OA, including the IGF-IR17 and the IGF-I ligand12,18,19. Refractoriness of OA chondrocytes to IGF-I stimulation13,14 has been reported and hypothetically linked to the increase in IGFBPs. To further investigate this proposal, we now hone into the relationship between IGF-I and IGFBPs at both the biochemical and functional levels. Human cartilage extracts from fresh specimens and cartilage organ cultures were used since these experimental systems are more likely to reflect the pathophysiology of the tissue than cultured cells.
Materials and Methods
The Massachusetts General Hospital IRB under protocol 2001-P-000214 approved the research on human cartilages reported here.
Tissue Sources and Preparations: Direct Extracts
Human articular cartilage was dissected from the femoral heads of 8 donors that underwent hip arthroplasty for OA (ages 45-55, average age=51 years; 5 males and 3 females). For each source that had a defined ulcer and sufficient cartilage left on the joint, two pools of cartilage were prepared. The fibrillated cartilage was obtained mostly from the rim of the ulcer, comprising ∼3-4 mm of the surrounding tissue but also from distal sites. The unfibrillated cartilage was obtained mostly from sites distal to the ulcer, and included smooth and superficially fibrillated cartilage (total # samples = 13). Initially, the femoral head was sketched on paper to depict the fibrillated and unfibrillated areas and then the fibrillated sites were marked on the femoral head itself by making a cut around the area (perpendicular to the bone axis) without removing the tissue from the bone. Starting with the fibrillated sites, slices were then shaved off from the femoral heads by using a # 15 sterile scapel. The slices from corresponding sites were transferred into a petri dish containing media during the dissection. After the dissection was completed, two to 3 slices from each dish were selected for histological assessment of OA and transferred to cold formalin. Processing and grading was essentially as described by Mankin et al20. Briefly, the cartilage was fixed in the cold overnight, dehydrated and processed by standard paraffin embedding techniques. Five μm sections were cut and stained with hematoxilin and eosin and with Saffranin-O-fast green-iron hematoxilin. The Mankin method20 for scoring OA is detailed in Table I, which also shows one representative slide of samples that were scored in the mild, intermediate and severe OA range in these studies. The integrity of the tidemark was not evaluated in this study. The best score obtained with this method is 0 (normal) and the worse is 13 (most severe OA). One blinded evaluator (C.Trahan, from Dr. Mankin's laboratory) and the unblinded author scored the samples; the grades were averaged. Remaining portions of cartilage from each site were blotted dry, weighed, and subjected to extraction in 0.05 M Tris maleate buffer, pH 6.0 containing 0.3 M NaCl, 8 M urea, 0.5% CHAPS and proteinase inhibitors (5 mM phenylmethylsulfonyl fluoride, 3 mM o-phenanthroline, 6.5 μM pepstatin and 9.5 μM leupeptin), as described before15. Thereafter, the tissue residues were extracted with proteinase K15. Chondroitin sulfate was measured in both the urea and proteinase K extracts by the dimethylmethylene blue assay21. The urea extracts were subjected to DEAE-chromatography to remove proteoglycans, the eluants were dialyzed, dried in aliquots of 25 μg protein, and then stored at −80 °C15. A set of 22 additional samples used for the previous study15 had been previously prepared and stored in the same way.
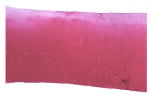
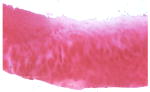
TABLE I. Histological Scoring System for OA.
The scoring system is derived from ref. 20 and reproduced with permission from Dr. Henry Mankin. The figure inserts below the table show representative slices of cartilage samples scored in the mild, intermediate and OA stages in the present study.
Method
| Category | Description | Numerical Score |
|---|---|---|
| I STRUCTURE | Normal | 0 |
| Surface Irregularities | 1 | |
| Pannus and surface irregularities | 2 | |
| Clefts to transitional zone | 3 | |
| Clefts to radial zone | 4 | |
| Clefts to calcified zone | 5 | |
| Complete disorganization | 6 | |
| II CELLS | Normal | 0 |
| Diffuse hypercellularity | 1 | |
| Cloning | 2 | |
| Hypocellularity | 3 | |
| III MATRIX (Safranin-0 Stain) | Normal | 0 |
| Slight reduction | 1 | |
| Moderate reduction | 2 | |
| Severe reduction | 3 | |
| No dye noted | 4 | |
 |
 |
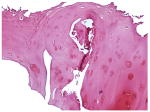 |
| MILD | INTERMEDIATE | SEVER |
IGF-I and IGFBP Assays
IGF-I and IGF-II assays were carried out using the Diagnostic Systems Laboratories (DSL) ELISA kit for total Active IGF-I and IGF-II respectively. Both IGF-I and IGF-II assays were carried out with acid-ethanol extraction to remove the IGF-binding proteins following the manufacturer's instructions. It is noted that the IGF-II assay is less sensitive than the IGF-I assay (compare the DSL reported mean absorbance over blank of 0.005 for the lowest IGF-II standard [0.5 ng/ml] to the reported mean absorbance over blank of 0.05 for 0.1 ng/ml IGF-I). Validation of the use of the DSL IGF-I assay for crude cartilage protein mixtures was reported by Schneiderman et al19; these authors spiked cartilage desorbates with known amounts of IGF-I and demonstrated good recoveries. Morales15 reported validation of the IGFBP-3 IRMA for use with cartilage extracts. In the present work, samples were measured for IGFBP-3 levels using both the ELISA and IRMA kits from DSL, as described in Results. IGF-I does not interfere with the IGFBP-3 assays15, so the samples were assayed for this binding protein without prior fractionation. The DSL RIA kit measured IGFBP-2. Since most of the values of the cartilage assays fell below the lowest DSL standard (3 ng/ml), the standard curve was extended to lower concentrations by diluting aliquots of the high range DSL standards to 1 and 2 ng/ml. The values for these dilute standards fell within the linear portion of the log-linear IGFBP-2 standard curve. All IGFBP and IGF-I values were calculated as ng/mg protein (protein content was determined in parallel in the DEAE-purified, dialyzed urea extract by the Pierce BCA assay). Previous work showed a variable but statistically significant difference in protein levels between the mild and OA groups of ∼40%15. Thus, normalization to soluble protein was selected as it yields the specific activity of IGFBP-3, i.e. the increase in IGFBP-3 over that of general protein. The molar ratios of IGF-I to IGFBP-3 were calculated using molecular weights of 7,600 for IGF-I, 29,000 for IGFBP-3 (unglycosylated protein) and 31,000 for IGFBP-2.
Cartilage Organ Cultures
Articular cartilage was obtained from 3 knee replacements for OA (1 male, 2 females; ages 44-50; average age 51) and from 8 femoral heads (4 females, 4 males; ages 44-71; average age 55). The knee cartilages arrived in the lab as large fragments and ulcerated or fibrillated sites were not apparent. Rather, all the cartilages were white, thick and unfibrillated by visual inspection. A panus-like soft adherent tissue was observed on occasion in a few areas and removed during dissection. On the other hand, all of the femoral heads were whole and had a large ulcer; whenever possible, the ulcer rim and distal sites were separately dissected as described above. For all specimens and pools, cartilage slices were diced and washed several times with DMEM-F12 containing 2× penicillin-streptomycin (200 U penicillin and 200 μg streptomycin per ml). For the biosynthesis experiments, cartilage portions were blotted dry on sterile gauze, weighed on sterile Petri dishes of known weight, and transferred to 24-well culture dishes immediately after harvest or within 2 days in batch culture. Each sample was cultured in 1 ml of DMEM-F12 (serum-free) containing 0.1% BSA (basal medium) ± varying concentrations of IGF-I or des (1-3) IGF-I as indicated in the text or in DMEM-F12 containing 10-20% FCS. Media and additives were changed every 48 h and the tissues incubated for a week. Labeling with 35S-sulfate was carried out under identical intra-experiment conditions (5-20 μCi/ml for 4 to 16 h). The tissues were subsequently stirred with 0.2 N NAOH overnight in the cold to extract glycosaminoglycans (GAGs). Aliquots of each extract were subjected to chromatography on PD10s and the cpm in the peak of incorporated radioactivity used to calculate the total 35S incorporation per sample. Results were normalized to the wet weight. For the catabolism experiments, the cartilage slices were maintained in basal medium for 1-2 days and then labeled in batch overnight with 35S-sulfate. Thereafter they were washed with fresh media, sorted into individual culture plates, and cultured without additives for 2 days to help remove any unincorporated isotope. The tissues were then chased for 7-10 days in basal media enriched with the growth factors, as indicated. Media was collected daily or every 2-3 days, and at the end of the catabolic period the tissues were extracted in 0.2 N NaOH. The conditioned media samples and the NAOH extracts were counted for 35S-radioactivity and the total radioactivity in the combined media and extract were calculated for each sample. The % release of 35S-radioactivity for each sample at each time point was then estimated.
Results
Levels of IGFBP-3 in Osteoarthritic Cartilage
A previous report from this laboratory showed statistically significant differences in IGFBP-3 levels in human cartilage extracts from mild vs. severe OA groups15. We set out to analyze the interrelationships of IGFBP-3 with the IGF-I ligand in the present study, and in the course of these studies we prepared, purified and assayed a new set of 13 samples from fresh human femoral heads. This afforded the opportunity to combine both data sets from this laboratory (13 newly assayed + 22 archival) to examine the quantitative relation between IGFBP-3 and individual OA score.
While both data sets for IGFBP-3 were obtained by assaying proteoglycan-depleted cartilage extracts prepared in identical manner, the archival experiments used IRMA and the new ones used ELISA for quantification of IGFBP-3. Two types of comparisons of ELISA and IRMA assays were carried out to determine the validity of data set combination. Parallel assays of the same 6 cartilage samples (OA scores 1 to 3) showed no significant difference by the Student t test of average values obtained by either assay (p=.302). Compare: an average 10.16 ± 5.27 to 11.42 ± 4.42 ng IGFBP-3/mg protein for the ELISA and IRMA respectively. In addition, when all the IGFBP-3 values (n=35) were subdivided by assay method into 3 arbitrary OA stages (Figure 1A) and the relationships analyzed by 2-Way ANOVA, there were no (assay) method differences (p=.878) or method by group interactions (p=.626), but significant inter OA group differences (p=.034). Thus, we concluded that it was reasonable to combine the results from the new and old data sets. The average IGFBP-3/mg protein ± S.D. in each the mild, intermediate and severe groups were: 7.43 ± 3.3 (n=10); 13.39 ± 7.05 (n=16); and 16.34 ± 2.28 (n=9). ANOVA tests of between-subject effects showed significant differences between the OA groups (.012), as computed using α=.05. Bonferroni post-hoc tests showed that the only significant difference was between the mild and severe OA groups (p=.013). This agrees with previous observations with the smaller data set15. Regression analysis was then performed for the full data set to assess the relation between IGFBP-3 and OA progression. The R2 was low (.122) denoting a very weak relationship of IGFBP-3 to individual OA score. This relation was significant (p=.040) for the large combined data set (n=35), but not for the individual ELISA and IRMA sets (p=0.109 and 0.061 respectively) (Figure 1B).
Figure 1. A. IGFBP-3 Levels Vs Osteoarthritis Group. B. IGFBP-3 Levels Vs OA Score.

Samples were staged for OA by the histological criteria of Mankin and prepared for assay as described (Methods, ref. 15). IGFBP-3 was measured in cartilage extracts by the DSL ELISA or IRMA kits as indicated and values normalized to protein content in the urea-soluble extracts. A. Groups are arbitrarily designated as mild (OA scores of 0-3); intermediate (3.5-7) and severe (7.5-11). The numbers in parenthesis are the number of samples assayed.
Total IGF-I and Molar Ratios of IGF-I to IGFBP-3
To gain better understanding of the context in which the IGFBP-3 increase takes place, we quantified levels of endogenous IGF during disease. Assays for total IGF-I and IGFBP-3 were run in parallel on aliquots from 18 samples (because of the large amounts of sample required for the acid-ethanol extractions prior to IGF-I assay there were insufficient amounts of protein in the rest of the samples [100-150 μg of proteoglycan-depleted protein were required/assay tube]. ANOVA showed no significant differences in total ng IGF-I/mg protein with OA group (p=.428), even though the average IGF-I content of samples with mild OA was somewhat lower than the corresponding value for the samples with more advanced OA (Figure 2). The IGF-II isoform was not detectable with the DSL ELISA even when doubling the starting protein levels for the acid extractions (n= 3 samples).
Figure 2. Total IGF-I Levels in OA Cartilage.

Samples were prepared as in Figure 1. IGF-I levels were determined by DSL total IGF-I assay. OA groups defined as in Figure 1.
To zero in on the quantitative relationship between IGF-I and IGFBP-3, the molar ratios of IGF-I to IGFBP-3 were calculated. The majority of samples (11 of 18) had ratios >1 (IGF-I dominates). There were no significant differences in the average total IGF-I/IGFBP-3 molar ratio with OA group in the 2-Way ANOVA model (p=.530). To consider these results in the context of the contributions of other IGFBPs, IGFBP-2 was measured since this binding protein is also quite abundant in OA cartilage15. Only 8 samples had measurable levels of IGFBP-2 using the ELISA or RIA assays from DSL (see Methods). The average value was 13.9 ng IGFBP-2/mg protein ± 4.56 (by RIA). The molar ratio of IGF-I to IGFBP (2+3) in these samples suggested a dominance of IGFBPs (not shown). The data from this limited set is consistent with the hypothesis that the increased IGFBP-3 (over the IGFBP background) helps to create an excess of IGFBP over IGF-I, and raises the question of the functional relationships between IGF-I and IGFBPs.
Functional Measures: Cartilage Organ Cultures
To test the effect of endogenous IGFBPs on IGF-I signaling, we used the mutated IGF variant des (1-3) IGF-I. This protein lacks the 3 N-terminal amino acids and has a significantly reduced ability to interact with binding proteins (∼20-100 fold decreased potency) while retaining full activity on the IGF type I signaling receptor22-26. Thus, when it is tested in parallel with native IGF-I it provides information regarding the function of endogenous IGFBPs26,27. Organ cultures from human knees were prepared using smooth, thick cartilage that appeared normal by gross inspection. These were maintained under serum-free conditions and treated ± native and mutated forms of IGF-I. Figure 3 shows a dose response for a cartilage sample from a 44-year-old donor with grossly intact, thick cartilage. At sub maximal doses, the des (1-3) analog tended to stimulate higher levels of anabolism than the native isoform, shifting the point of half-maximal stimulation (the apparent ED50) from 8.5 ng/ml (for IGF-I) to 2.3 ng/ml. At the highest dose (30 ng/ml), the effect of the IGFs (3-fold and 3.88-fold stimulation for IGF-I and des, respectively) were in a range comparable to that of 10% FCS (4.11-fold stimulation). Two additional experiments were carried out to test the effect of 30 ng/ml and 100 ng/ml of each IGF-I (2 females, age 50, average OA score=3). The average stimulation of proteoglycan anabolism by the native IGF-I was 2.14 ± 0.57 (average ± S.D.; n=3) at 30 ng/ml and 2.0 ± 0.23 (average ± range; n=2) at 100 ng/ml. This confirmed that 30 ng/ml saturated the response. Likewise, des (1-3) IGF-I stimulated anabolism 3.14 fold ± 0.63 (n=3) and 2.79 ± 0.51 (n=3) at 30 and 100 ng/ml respectively. In addition, FCS was tested at 20% in 2 of the 3 experiments. At this higher dose, FCS treatment resulted in a variable stimulation of proteoglycan synthesis, which largely exceeded the stimulation by IGF-I in one experiment (compare 4.87-fold to 2.23-fold stimulation) but this differential was not as striking in the 2nd experiment (2.5 Vs 2.1-fold stimulation).
Figure 3. Dose Response of des (1-3) IGF-I and native IGF-I in Human Knee Cartilage Organ Cultures.

Knee cartilage was from a 44 year old male donor. The cartilage slices were maintained in culture for a week ± the IGFs as indicated; the culture media and the additives were replenished every 48 hrs. FCS was present at 10% only in the indicated sample. At the end of the culture period, the tissues were incubated with 20 μCi/ml of 35S-sulfate for 4.5 hrs and then extracted by gentle mixing in 0.2 N NAOH at 4°C overnight. The level of 35S-incorporation in each sample was assessed by performing PD10 chromatography and then normalizing the total cpm incorporated per sample to mg wet weight.
Similar sets of experiments were carried out using human femoral head cartilages. Figure 4 shows a set of dose responses for the IGFs carried out with cartilage from two individual donors, one with mild OA (score 4) and one with advanced OA (score 8). The response of the cartilage with advanced OA (score = 8) to native IGF-I was somewhat blunted at lower doses, but a significant ∼2.6 fold increase in proteoglycan anabolism was seen at 30 ng/ml. The des (1-3) analog had a stronger effect at lower doses and reached saturation at the lower 10 ng/ml concentration. Accordingly, the estimated ED50 for the des analog was at 3.2 ng/ml compared to the ED50 of 15 ng/ml for native IGF-I. On the other hand, the sample with a milder degree of OA (score 4) responded optimally to low level of native IGF-I (3 ng/ml) and this was comparable to the effect of the des variant (compare 1.8-fold stimulation Vs 1.78-fold for IGF-I and des, respectively). At 30 ng/ml, the stimulation remained at a similar level (1.71 fold Vs. 2.2 fold for IGF-I and des, respectively). Table II shows the results of similar experiments using femoral heads from 4 additional donors, all of which responded to 30 ng/ml IGF-I by stimulation of proteoglycan synthesis (average 2.25 ± 0.57, n=9 sites). At saturation, the stimulation observed for the femoral heads was not different than that observed with the knees (p=0.69). Indeed, all of the cartilage samples examined from the knee or femoral heads irrespective of OA stage responded to IGF-I stimulation (2.29 fold stimulation ± 0.55 at the optimal dose of 30 ng/ml; average ± S.D. for 12 samples from different sites). Similarly, the des (1-3) isoform showed an average 2.34 stimulation ± 0.71; 10 samples). A student t test showed that there were no statistical differences between IGF-I and des (1-3) IGF-I at the optimal dose of 30 ng/ml (p=0.86).
Figure 4. Dose Response of des (1-3) IGF-I and native IGF-I in Human Femoral Head Cartilage Organ Cultures.

Cartilage was obtained from the femoral heads of each of 2 donors (OA scores 8 and 4). The cartilage organ cultures were maintained in the presence of each additive as indicated and labeled after a week with 35S-sulfate (Methods). Results were expressed as cpm incorporated over mg wet weight and the fold stimulation over basal samples calculated. The numbers on the X axis refer to the concentration of IGFs in the incubation medium (ng/ml).
TABLE II. Stimulation of 35S-sulfate Incorporation in Cartilage Organ Cultures.
Abbreviations: Samples marked (U) were obtained from the ulcer rim or fibrillated sites and samples marked (D) were from the distal sites. F=female, M=male. Y=years old.
| Treatment | Donor 606 Score U=8 D=5 F, 71y |
706 Score U=7.5 D=6.0 F, 47y |
906 Score U=7.5 D=8.0 F, 64y |
1406 Score U=8.0 D=4.0 M, 55y |
2006 Score D=2.3 M, 54y |
507 Score D=8.7 M, 46y |
Average Anabolic Stimulation | Donor 1706 Score D=3 F, 58y |
2006 Score D=2.3 |
507 Score D=8.7 |
1007 M, 44y |
Av. Cat |
|---|---|---|---|---|---|---|---|---|---|---|---|---|
| Fold Anabolic Stimulation | Fold Catabolic Stimulation T1/2/basal | |||||||||||
| 1 ng/ml IGF-I | 1.17 D | 1.03 D | 1.1 ± 0.07 | |||||||||
| 3 ng/ml IGF-I | 1.74 U 1.25 D |
1.8 D |
1.74 1.53 ± 0.28 |
|||||||||
| 10 ng/ml IGF-I | 1.47 D | 1.64 D | 1.55 ± 0.058 | |||||||||
| 30 ng/ml IGF-I | 2.96 U, 1.35 D |
2.14 U, 2.73 D |
2.63 D | 1.83 U 1.71 D |
2.9 D | 2.0 D |
2.31 ± 0.58 2.22 ± 0.63 |
1.1 | 0.83 | 0.9 | 1.04 | 0.96 ± 0.12 |
| 1 ng/ml des IGF-I | 1.28 | 1.25 | 1.26 ± 0.01 | |||||||||
| 3 ng/ml des IGF-I | 1.79 U 1.56 D |
1.78 |
1.79 1.67 ± 0.11 |
|||||||||
| 10 ng/ml des IGF-I | 2.27 | 1.96 | 2.11 ±0.15 | |||||||||
| 30 ng/ml des IGF-I | 1.96 U, 1.66 D |
1.5 U, 2.74 D |
2.22 D | 1.72 U 2.20 D |
1.73 ± 0.23 2.20 ± 0.44 |
1.16 | 0.8 | 0.9 | 1.03 | 0.97 ± 0.16 | ||
| 30 ng/ml B chain | 1.33 | 0.83 | 0.8 | 1.08 | 1.01± 0.25 | |||||||
The effect of IGF-I and its analogs was also studied in catabolic experiments similarly carried out in organ cultures. The OA tissue (donor 507, score = 8.7) behaved similarly ± IGF-I (30 ng/ml), (Figure 5, Table II). The t1/2 for proteoglycan catabolism was directly read or extrapolated from the decay curves for 35S by reference to the point where 50% of the labeled proteoglycan remained in the matrix. Compare the t1/2 of 11 ± 0.1 days for the basal control (average ± range), to 10 days ±1 for the IGF-I treated sample and 10 days ± 0.4 for the des (1-3) IGF treated sample. Another IGF-I mutant with decreased ability to bind to IGFs, the B Chain analog, was also tested. This variant is reportedly one of the most effective analogs in bypassing IGFBP inhibition while retaining receptor affinity25. The B-chain analog was only slightly more active than the des analog, with a 20% faster catabolic rate (t1/2 = 9 ± 0.3). To determine if the unresponsiveness of the catabolic pathway was due to extensive cell death in this sample, a synthesis control was performed. The sample responded to IGF-I with a 2-fold increase in levels of proteoglycan synthesis. Another 3 samples were assayed and similar results were obtained (Table II). Lower doses of IGF-I or its analogs (1-10 ng/ml) or a higher dose (100 ng/ml) were not substantially more effective than 30 ng/ml (not shown). Experiment 1007 (Table II) yielded enough tissue to run triplicates of each condition. Student t test analysis of the results showed no statistical differences between basal and native IGF-I or either analog (30 or 100 ng/ml).
Figure 5. Effect of Native IGF-I and IGF-I Analogs on Catabolism of Proteoglycans in Femoral Head Cartilage Organ Cultures.

Cartilage was labeled in a batch with 35S-sulfate, distributed into individual wells and chased under various treatments as indicated, with IGF-I and analogs at 30 ng/ml.
Discussion
In this study, quantitative data on endogenous levels of IGFBP-3 and IGF-I as well as measures of functional cartilage responses to native and mutated forms of IGF-I are reported. This resulted in the generation of the largest available data set for IGFBP-3 values. As seen before with a smaller data set, when the data is stratified into arbitrary OA groups (mild, intermediate, severe) there is a significant difference only between the mild and severe OA groups15. Regression analysis using a linear model showed that the relationship of IGFBP-3 to OA score is very weak but statistically significant. This is suggestive of an effect that may be influenced by variables inherent in the complexity of the experimental system, such as the accuracy of the individual (subjective) OA scores, and the dilution of IGFBP-3 stores (eg. paracrine and autocrine sources, matrix Vs cellular stores). As an example of the later variable, recent IHC studies suggest that matrix IGFBP-3 may be most prominent in the top half of cartilage in normal and OA cartilages28 and that this is most pronounced in the intermediate to severe OA cartilages. On the other hand, cellular increases of IGFBP-3 with OA may be particularly prominent in deep zone cells. This points to the need for future studies focused on individual cartilage IGFBP-3 pools and their interactions.
The present study also shows the OA tissue remains responsive to anabolic IGF-I. This suggests that the signaling machinery for IGF-I stimulation is functional at least in terms of its ability to up-regulate proteoglycan synthesis. The effects of the mutated IGF-I analog, des-(1-3) IGF-I, which has greatly diminished ability to interact with IGFBPs were also tested herein. These mutated forms of IGF-I allow testing the net effect of endogenous IGFBPs. It was observed that des-IGF-I tended to induce a stronger anabolic response at lower doses from the native IGF-I analog. This is consistent with the prevailing hypothesis that IGFBPs can contribute to lowering the IGF-I responses in OA cartilage, but the results do not support an absolute insensitivity or lesion of the anabolic pathway to IGF-I.
On the other hand, the catabolism experiments did not show a significant effect of native IGF-I, or its analogs. Previous experiments using cartilage organ cultures derived from young and adult bovines established a dual synchronized effect of IGF-I on proteoglycan metabolism: synthesis was increased and catabolism was decreased. This lead to a net homeostatic maintenance of proteoglycan levels in the cartilage during culture3. The present study tested human OA cartilage responses by using a similar organ culture model and the same proteoglycan metabolism assay techniques used in the bovine studies, but uncovered a lack of response of the catabolic pathway to the IGF-I ligand at any dose tested. Interestingly, an experimental dissociation of the anabolic and catabolic pathways was noted in the studies of bovine cartilage organ cultures. The catabolic pathway was more responsive to lower levels of the IGF-I ligand than the anabolic system, and it was estimated that the half maximal response for catabolism occurred at 3-fold lower doses than that for the anabolic pathway3. The mechanisms underlying the differential sensitivity of the anabolic and catabolic pathways for aggrecan are unknown, and will require in depth studies of their signaling intermediaries. It may also be of interest to note that the bovine and the human OA cartilages differ in IGFBP expression, as assessed by similar urea buffer extractions of uncultured cartilage slices followed by DEAE purification and IGFBP analysis by Western ligand blots and immunoblots. The bovine cartilages contain high levels of IGFBP-6 and very low levels of IGFBP-326,27. In fact, IGFBP-3 is only weakly detected in bovine tissue extracts after culture with TGF- β26. In contrast, the human OA cartilages contain high levels of IGFBP-3 and IGFBP-6 has not been detected in these tissues.15 It is presently unclear whether or how these differences in IGFBP content between the two species could affect metabolic function. The analog experiments reported in this paper suggest that the IGFBPs do not regulate catabolism at a receptor-signaling level, but it is conceivable that they contribute to post-receptor events, as IGFBP-3 is closely associated with the cell28. Indeed separate studies have shown that IGFBP-3 is present within chondrocyte nuclei and is also associated with the cell cytoplasm28. The possible IGF-independent effects of IGFBPs on catabolism are speculative, but deserve future investigation.
The maintenance of the chondrocytes in their natural matrix habitat during the culture period (cartilage organ cultures) leads to numerous consequences that undoubtedly affect cell dynamics, including integrin-mediated and matrix-derived growth factor signaling. This consideration can help to explain the differences between our study and previous ones that analyzed proteoglycan synthesis in isolated chondrocytes13 and reported refractoriness to IGF-I stimulation. Another important consideration is that in the cell studies, full dose response to IGF-I or its analog (s) were not carried out. In one of the studies29, the authors reported on a higher effect of the R3-IGF-I analog than native IGF-I on proteoglycan synthesis of OA chondrocytes, but the effectors were compared at subsaturating doses. Interestingly, in the same study a substantial increase in proteoglycan synthesis was seen at a 4-fold higher IGF-I dose. Another study examined IGF-I stimulation of cartilage organ cultures14 using 100 ng/ml of IGF-I. These authors found that all the cartilages were able to respond to exogenous IGF-I, although some responded more weakly than others. A third critical variable that needs to be considered is the age of the cartilage/cell donor. The present studies were carried out using tissue from donors with a relatively narrow age distribution, centering on the 50th decade, which may have contributed to minimizing effects of aging on anabolism. Others have observed that sensitivity to IGF-I in rat and monkey cartilage declines with age due to IGFBP increases 30,31. A study of normal cartilage organ cultures showed a decline proteoglycan synthesis with age in the presence of adult human sera32, which correlated with an increase in advanced glycation products.
In summary, this study explored the relation between IGFBP-3 levels and individual OA scores in direct human cartilage extracts for the first time. Further, the levels of IGF-I ligand were evaluated and related to IGFBP-3 levels. In addition, a series of OA cartilages were maintained in organ cultures to determine their responsiveness to IGF-I and to its des (1-3) analog in both the anabolic and catabolic pathways. As noted above, other studies had evaluated effects of IGF-I on OA cartilage or cells13,14,29, but had centered on the anabolic effect and only one of the cell studies explored the role of the analogs29. The present approach uncovered new information indicating that IGF-I is able to robustly stimulate proteoglycan synthesis at saturating doses, but that it is unable to modulate proteoglycan catabolism in OA cartilage organ cultures.
Acknowledgments
The work was supported by NIH R01 grant AR48304. The knee organ culture studies were also supported by a summer medical student fellowship from the Arthritis Foundation, Massachusetts Chapter to Ms. Emily Pfeil (Johns Hopkins Medical School). Her outstanding interest in the project and technical skills are particularly appreciated. The assistance of Dr. Adetola Adesida in training E.P. and Katherine Almendinger in tissue culture methods and participation with K.A. in the performance of selected experiments is acknowledged and greatly appreciated. Thanks to all that contributed outstanding technical assistance to this project, including Carol Trahan (histology and OA grading), Lihua Zhang, Alison Mahan, and Katherine Almendinger. Dr. Chris McGibbon (University of New Brunswick, New Brunswick Canada) provided statistical consultant ship and analysis, as well as fruitful suggestions for the completion of the IGFBP-3 and IGF-I quantitation experiments. His participation was particularly valuable.
Supported by: National Institute of Arthritis, Musculoskeletal and Skin Diseases, NIH.
References
- 1.Salmon WD, Jr, Daughaday WH. A hormonally controlled serum factor, which stimulates sulfate incorporation by cartilage in vitro. J Lab Clin Invest. 1957;49:825–36. [PubMed] [Google Scholar]
- 2.McQuillan DJ, Handley CJ, Campbell MA, Bolis S, Milway VE, Herington A. Stimulation of proteoglycan biosynthesis by serum and insulin-like growth factor-I in cultured bovine articular cartilage. Biochem J. 1986;240:423–30. doi: 10.1042/bj2400423. [DOI] [PMC free article] [PubMed] [Google Scholar]
- 3.Luyten FP, Hascall VC, Nissley SP, Morales TI, Reddi AH. Insulin-like growth factors maintain steady-state metabolism of proteoglycans in bovine articular cartilage explants. Arch Biochem Biophys. 1988;267:416–25. doi: 10.1016/0003-9861(88)90047-1. [DOI] [PubMed] [Google Scholar]
- 4.Mankin HJ, Mow VC, Buckwalter JA. Articular cartilage repair and osteoarthritis. In: Buckwalter JA, Einhorn TA, Simon SR, editors. Orthopaedic Basic Science. Chicago: American Academy of Orthopaedic Surgeons; 2000. pp. 471–88. [Google Scholar]
- 5.Blakeley VA, Butler AA, Koval AP, Okubo Y, LeRoith D. IGF-I receptor function. In: Rosenfeld R, Roberts C Jr, editors. Contemporary Endocrinology: The IGF System. Totowa, N.J.: Humana Press; 1999. pp. 143–63. [Google Scholar]
- 6.Nissley SP. Type II Receptor Mediated Events. In: Rosenfeld R, Roberts C Jr, editors. Contemporary Endocrinology: The IGF System. Totowa, N.J.: Humana Press; 1999. pp. 165–97. [Google Scholar]
- 7.Firth SM, Baxter RC. Cellular actions of the insulin-Like growth factor binding proteins. Endocrine Reviews. 2002;23:824–54. doi: 10.1210/er.2001-0033. [DOI] [PubMed] [Google Scholar]
- 8.Mohan S, Baylink DJ. IGF-binding proteins are multifunctional and act via IGF-dependent and –independent mechanisms. J Endocrinology. 2002;175:19–31. doi: 10.1677/joe.0.1750019. [DOI] [PubMed] [Google Scholar]
- 9.Clemmons DR. IGF binding proteins and extracellular matrix. In: Rosenfeld R, Roberts C Jr, editors. Contemporary Endocrinology: The IGF System. Totowa, N.J.: Humana Press; 1999. pp. 273–9. [Google Scholar]
- 10.Youngman O, Rosenfeld RG. IGF-independent actions of the IGF binding proteins. In: Rosenfeld R, Roberts C Jr, editors. Contemporary Endocrinology: The IGF System. Totowa, N.J.: Humana Press; 1999. pp. 257–72. [Google Scholar]
- 11.Lee KW, Cohen P. Beyond carrier proteins. Nuclear effects: Unexpected intracellular actions of insulin-like growth factor binding protein-3. J Endocrinology. 2002;175:33–40. doi: 10.1677/joe.0.1750033. [DOI] [PubMed] [Google Scholar]
- 12.Olney RC, Tsuchiya K, Wilson DM, Mohtai M, Maloney WJ, Schurman DJ, et al. Chondrocytes from osteoarthritic cartilage have increased expression of insulin-like growth factor I (IGF-I) and IGF-binding protein-3 (IGFBP-3) and –5, but not IGF-II or IGFBP-4. J Clinical Endocrinology and Metabolism. 1996;81:1096–103. doi: 10.1210/jcem.81.3.8772582. [DOI] [PubMed] [Google Scholar]
- 13.Tardif G, Roboul P, Pelletier JP, Geng C, Clutier JM, Martel-Pelletier J. Normal expression of type 1 insulin-like growth factor receptor by human osteoarthritic chondrocytes with increased expression and synthesis of insulin-like growth factor binding proteins. Arthritis Rheum. 1996;39:968–78. doi: 10.1002/art.1780390614. [DOI] [PubMed] [Google Scholar]
- 14.Chevalier X, Tyler JA. Production of binding proteins and role of the insulin-like growth factor I binding protein 3 in human articular cartilage explants. Br J Rheum. 1996;35:515–22. doi: 10.1093/rheumatology/35.6.515. [DOI] [PubMed] [Google Scholar]
- 15.Morales TI. The insulin-like growth factor binding proteins in uncultured human cartilage. Increases in insulin-like growth factor binding protein 3 during osteoarthritis. Arthritis Rheum. 2002;46:2358–67. doi: 10.1002/art.10482. [DOI] [PubMed] [Google Scholar]
- 16.Eviatar T, Kauffman H, Maroudas A. Synthesis of insulin-like binding protein 3 in vitro in human articular cartilage cultures. Arthritis Rheum. 2003;48:410–17. doi: 10.1002/art.10761. [DOI] [PubMed] [Google Scholar]
- 17.Verschure PJ, Van Marle J, Joosten LAB, Helsen MMA, Lafeber FPJG, Van Den Berg WB. Localization of insulin-like growth factor-1 receptor in human normal and osteoarthritic cartilage in relation to proteoglycan synthesis and content. Br J Rheum. 1996;35:1044–55. doi: 10.1093/rheumatology/35.11.1044. [DOI] [PubMed] [Google Scholar]
- 18.Dore S, Abribat T, Rousseau N, Brazeau P, Tardif G, DiBattista JA, et al. Increased insulin-like growth factor 1 production by human osteoarthritic chondrocytes is not dependent on growth hormone action. Arthritis Rheum. 1995;38:413–9. doi: 10.1002/art.1780380319. [DOI] [PubMed] [Google Scholar]
- 19.Schneiderman R, Rosenberg N, Hiss J, Lee P, Liu F, Hintz RL, et al. Concentration and size distribution of insulin-like growth factor-I in human normal and osteoarthritic synovial fluid and cartilage. Arch Biochem Biophys. 1995;324:173–88. doi: 10.1006/abbi.1995.9913. [DOI] [PubMed] [Google Scholar]
- 20.Mankin HJ, Dorfman HD, Lippiello L, Zarins A. Biochemical and metabolic abnormalities in articular cartilage from osteoarthritic human hips. II Correlation of morphology with biochemical and metabolic data. J Bone and Joint Surg. 1971;53A:523–537. [PubMed] [Google Scholar]
- 21.Farndale RW, Buttle DJ, Barret AJ. Improved quantitation and discrimination of sulphated glycosaminoglycans by use of dimethylmethylene blue. Biochim Biophys Acta. 1986;883:173–7. doi: 10.1016/0304-4165(86)90306-5. [DOI] [PubMed] [Google Scholar]
- 22.Ballard FJ, Wallace JC, Francis GL, Read LC, Thomas FM. Des (1-3) IGF-I: a Truncated Form of Insulin-like Growth Factor-I. Int J Biochem Cell Biol. 1996;28:1085–1087. doi: 10.1016/1357-2725(96)00056-8. [DOI] [PubMed] [Google Scholar]
- 23.Oh Y, Muller HL, Lee DY, Fielder PJ, Rosenfeld RG. Characterization of the Affinities of Insulin-Like Growth Factor (IGF)-Binding Proteins 1-4 for IGF-I, IGF-II, IGF-I/Insulin Hybrid, and IGF-I Analogs. Endocrinology. 1993;132:1337–1343. doi: 10.1210/endo.132.3.7679979. [DOI] [PubMed] [Google Scholar]
- 24.Francis GL, Aplin SE, Milner SJ, McNeil KA, Ballard J, Wallace JC. Insulin-like growth factor (IGF)-II binding to IGF-binding proteins and IGF receptors is modified by deletion of the N-terminal hexapeptide or substitution of arginine for glutamate-6 in IGF-II. Biochem J. 1993;293:713–719. doi: 10.1042/bj2930713. [DOI] [PMC free article] [PubMed] [Google Scholar]
- 25.Clemmons DR, Dehoff ML, Busby WH, Bayne ML, Cascieri MA. Competition for binding to insulin-like growth factor (IGF) binding protein-2, 3, 4, and 5 by the IGFs and IGF analogs. Endocrinology. 1992;131:890–895. doi: 10.1210/endo.131.2.1379166. [DOI] [PubMed] [Google Scholar]
- 26.Morales TI. The role and content of endogenous insulin-like growth factor-binding proteins in bovine articular cartilage. Arch Biochem Biophys. 1997;343:164–172. doi: 10.1006/abbi.1997.0166. [DOI] [PubMed] [Google Scholar]
- 27.Bhakta NR, Garcia AM, Frank EH, Grodzinsky AJ, Morales TI. The insulin-like growth factors (IGFs) I and II bind to articular cartilage via the IGF-binding proteins. J Biol Chem. 2000;275:5860–6. doi: 10.1074/jbc.275.8.5860. [DOI] [PubMed] [Google Scholar]
- 28.Hunziker EB, Kapfinger E, Martin JA, Buckwalter JA, Morales TI. The Insulin-like growth factor binding protein-3 (IGFBP-3) is closely associated with the chondrocyte nucleus in human articular cartilage. OA and Cartilage. 2007 doi: 10.1016/j.joca.2007.06.008. In print. [DOI] [PMC free article] [PubMed] [Google Scholar]
- 29.DeCeuninck F, Caliez A, Dassencourt L, Anract P, Renard P. Pharmacological disruption of insulin-like growth factor 1 binding to IGF-binding proteins restores anabolic responses in human osteoarthritic chondrocytes. Arth Res Ther. 2004;6:R393–R403. doi: 10.1186/ar1201. [DOI] [PMC free article] [PubMed] [Google Scholar]
- 30.Martin JA, Ellerbroek SM, Buckwalter J. Age-related decline in chondrocyte response to insulin-like growth factor-I: the role of growth factor binding proteins. J Orth Res. 1997;15:491–8. doi: 10.1002/jor.1100150403. [DOI] [PubMed] [Google Scholar]
- 31.Loeser RF, Shanker G, Carlson CS, Gardin JF, Shelton BJ, Sonntag WE. Reduction in the chondrocyte response to insulin-like growth factor 1 in aging and osteoarthritis. Arth & Rheum. 2000;43:2110–20. doi: 10.1002/1529-0131(200009)43:9<2110::AID-ANR23>3.0.CO;2-U. [DOI] [PubMed] [Google Scholar]
- 32.DeGroot J, Verzijl N, Bank RA, Lafeber FPJG, Bijlsma JWJ, TeKoppele JM. Age-related decrease in proteoglycan synthesis of human articular chondrocytes. Arth & Rheum. 1999;42:1003–9. doi: 10.1002/1529-0131(199905)42:5<1003::AID-ANR20>3.0.CO;2-K. [DOI] [PubMed] [Google Scholar]