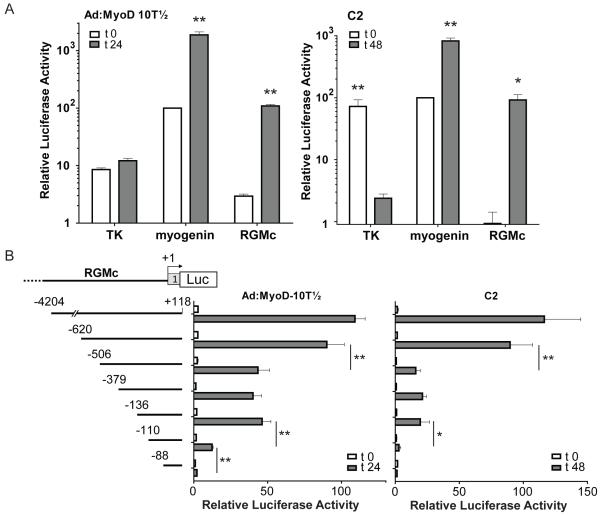
Figure 3. Mapping the regions of the RGMc promoter that are induced during muscle differentiation.
Results of luciferase assays in differentiating Ad:MyoD-10T½ cells (left panels) and C2 myoblasts (right panels) that were transiently transfected with reporter genes containing (A) the minimal thymidine kinase (TK) promoter, the mouse myogenin promoter, or the mouse RGMc promoter (coordinates −4204 to +118), and (B) reporter genes containing a series of 5′ truncations of the mouse RGMc promoter. Cells were incubated in DM for 0 (white bars), or 24 or 48 hr (gray bars). The graphs summarize results of 3 - 5 independent experiments (mean ± S.E.), each performed in duplicate (* - p < 0.05, ** - p < 0.005). Myogenin promoter values at t 0 have been set to 100 in each graph (average measurements at t 0 were 7.8 × 10⁴ (Ad-MyoD-10T½ cells) or 7.3 × 10³ (C2 cells) light units/μg total protein/sec).

