
Figure 4. Analyzing the RGMc gene for potential transcriptional enhancers.
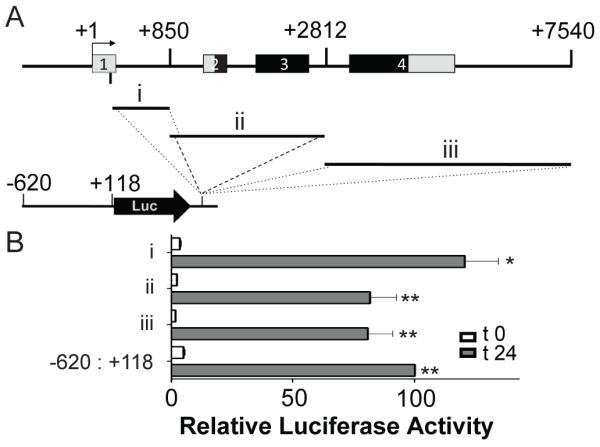
A. Map of mouse RGMc gene showing regions that were fused downstream of firefly luciferase (Luc) and the RGMc promoter (coordinates −620 to +118) to test for enhancer activity in differentiating Ad-MyoD-10T½ cells. B. Graphs depict results of luciferase assays after incubation in DM for 0 (white bars) or 24 hr (gray bars) (mean ± S.E. of 3 experiments, each performed in duplicate; values for the RGMc promoter at 24 hr were set to 100 (* - p < 0.01, ** - p < 0.001, vs. t 0)).