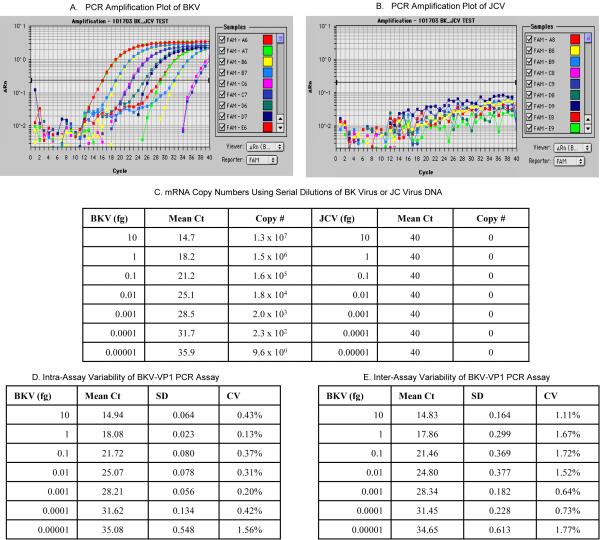
Figure 1. BKV DNA Specific Amplification in the Real Time Quantitative PCR Assay.
PCR amplification plots generated with serial dilutions (10 fg to 0.00001fg) of BKV DNA (BK virus strain MM, ATCC number 45026, pBKV [35-1], Panel A) or JVC DNA (JC virus strain 803A, ATCC number VRMC- 24, Panel B) as the template and using the primers and TaqMan probe designed in our laboratory. The absolute copy numbers calculated using the BKV amplicon are provided in Panel C.
The intra-assay variability is shown in Panel D and the inter-assay variability in Panel E. The mean Ct value, SD and CV of 12 replicates of each concentration within the same PCR run were used to calculate the intra-assay variability. Inter-assay variability was calculated from 2 independent PCR runs of seven different concentrations of BKV DNA.

