

Abstract
Cortical activity was measured with functional magnetic resonance imaging to probe the involvement of the superior precentral sulcus (including putative human frontal eye fields, FEF) and the intraparietal sulcus (IPS) in visual short term memory and visual attention. In two experimental tasks, human subjects viewed two visual stimuli separated by a variable delay period. The tasks placed differential demands on short-term memory and attention, but the stimuli were visually identical until after the delay period. An earlier study (Offen, Schluppeck, & Heeger, 2009) had found a dissociation in early visual cortex that suggested different computational mechanisms underlying the two processes. In contrast, the results reported here show that the patterns of activation in prefrontal and parietal cortex were different from one another but were similar for the two tasks. In particular, the FEF showed evidence for sustained delay-period activity for both the working memory and the attention task, while the IPS did not show evidence for sustained delay-period activity for either task. The results imply differential roles for the FEF and IPS in these tasks; the results also suggest that feedback of sustained activity from frontal cortex to visual cortex might be gated by task demands.
Keywords: fMRI, vision, memory, attention, FEF, IPS, cognitive control, sustained activity
Introduction
The ability to hold information across a delay is necessary to succeed at tasks that require working memory or sustained attention. It is widely thought that a sustained increase in mean neuronal activity across the delay period underlies this ability. Several studies suggest that visual cortex shows such sustained delay period activity for some (Chawla, Rees, & Friston, 1999; Haenny, Maunsell, & Schiller, 1988; Kastner, Pinsk, De Weerd, Desimone, & Ungerleider, 1999; Luck, Chelazzi, Hillyard, & Desimone, 1997; McMains, Fehd, Emmanouil, & Kastner, 2007; Ress, Backus, & Heeger, 2000; Reynolds, Pasternak, & Desimone, 2000; Silver, Ress, & Heeger, 2007), though not all (Offen, et al., 2009), tasks. It is hypothesized that top-down projections from frontal and/or parietal areas provide the control signals that modulate processing in sensory cortex (Corbetta & Shulman, 2002).
The experiments described here aimed to provide insight into the nature of the cognitive control of visual processing implied by this stimulus-independent delay period activity, by comparing the cortical networks that exhibit such activity in two tasks designed to place differential demands on visual attention and visual short term memory. Both experimental tasks consisted of two visual stimuli presented at the same spatial location and separated by a variable delay period, but differed in their dependence on attention and short-term memory. Variable delay periods were used, to encourage subjects to maintain short-term memory, spatial attention, or both. The use of variable delays also allowed us to disambiguate the fMRI responses to the visual stimuli from those recorded during the delay (during which no visual stimulus was present).
We previously demonstrated a dissociation between the activity in visual cortex during maintenance of attention and short-term memory (Offen, et al., 2009). Much of early visual cortex showed evidence for sustained responses throughout the delay when subjects performed an attention-demanding detection task, but not when subjects performed a delayed-comparison task that required short-term memory. This dissociation is consistent with the hypothesis that there are separate cortical mechanisms underlying the two processes of attention and short-term memory, and implied that sustained delay-period activity in early visual cortex might play a role in endogenous spatial selection. These findings do not rule out the possibility that early visual cortex maintains the short-term memory by some process other than a sustained increase in activity during the delay (Harrison & Tong, 2009; Serences, Ester, Vogel, & Awh, 2009; see Discussion). Regardless, early visual cortex is processing memory differently from how it processes attention.
The evidence for sustained delay-period responses in early visual cortex for the detection task raised the question of where the signal to maintain the response originated. The evidence for a dissociation between the two tasks in early visual cortex raised the question of whether a similar dissociation (in the same or the opposite direction) would be evident in other cortical areas. If there were a similar dissociation in sustained activity in other cortical areas, it would further support the hypothesis of separate cortical mechanisms for attention and working memory. On the other hand, evidence for delay-period activity in other cortical areas in the absence of evidence for a dissociation between the two tasks in those areas would imply that there might have been a gating mechanism that determined when sustained activity in higher levels of cortex resulted in sustained activity in early sensory cortex.
The results here show evidence of sustained delay-period activity in the precentral sulcus for both tasks, particularly in dorsolateral superior precentral sulcus (DL-sPCS), overlapping with the putative location of human frontal eye fields (FEF) (Blanke, et al., 2000; Grosbras, Laird, & Paus, 2005). There was no evidence for robust delay-period activity in the intraparietal sulcus (IPS). Overall our results across all of cortex are consistent with partially overlapping but separate cortical mechanisms underlying visual working memory and visual attention, and suggest that feedback of sustained activity from frontal cortex to visual cortex might be gated by task demands.
Methods
Subjects and scanning sessions
The current study is based on the same dataset as was used previously to assess sustained delay-period activity in visual cortex (Offen, et al., 2009). Five experienced subjects participated in this study with written consent; one additional experienced subject participated in a psychophysical control experiment, also with written consent. Procedures were in compliance with the safety guidelines for MRI research and approved by the New York University Committee on Activities Involving Human Subjects. Each of the five subjects who participated in the full study were scanned in 3–5 sessions: one session to obtain a high-resolution anatomical volume; and 2–4 sessions to measure fMRI responses in the delayed-comparison and detection tasks.
Visual stimuli and tasks
Stimuli were presented on an LCD flat panel display. Subjects were supine and viewed the display through an angled mirror in the bore of the magnet. Stimuli were sinusoidal gratings presented in an annulus around fixation (inner radius 1 deg, outer radius 3 deg), and were presented briefly (120–200 ms) to minimize local light adaptation and afterimages. Subjects were instructed to fixate a small target (square, 0.33 deg) at the center of the display that was presented continuously to encourage stable eye position. Subjects performed two different tasks, each in a separate scanning session; some subjects needed an extra session to complete one of the tasks. Subjects completed 8–16 runs, for an average of approximately 100 trials, per task condition.
For both tasks, a high-contrast target (40% contrast; spatial frequency randomized from 1–3 cpd; orientation and phase fully randomized) was presented briefly (200 ms), followed by a variable delay period (1–16 s, uniform distribution). The delay period was randomized so that subjects could not anticipate when each trial would end; the randomization was uniform so that there were enough (25%) long-duration delays to disambiguate the fMRI responses during the delay period from the responses at the beginning and end of the trials. Each trial was followed by a long (16 s) inter-trial interval to allow the hemodynamics to return mostly to baseline. The two tasks differed as follows.
Delayed-comparison task (Figure 1A)
Figure 1. Task design.
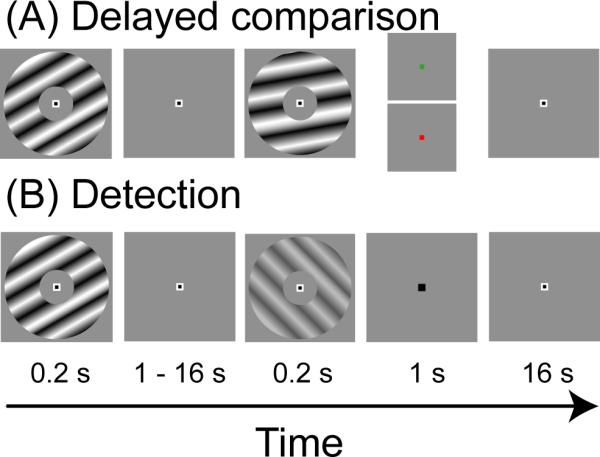
Both tasks were identical until the end of the variable-length delay period. Both tasks were initiated with a high-contrast visual target stimulus (200 ms), followed by fixation for a variable delay period ranging from 1–16 s. (A) Delayed-comparison task. Following the delay, a second high-contrast visual target stimulus was displayed, after which subjects were cued to report the difference of either spatial frequency (green cue), or orientation (red cue). (B) Detection task. Following the delay, a low-contrast visual target stimulus was displayed on half the trials; subjects were then cued to report whether the target was shown.
Following the presentation of the first visual target stimulus and the variable delay period, we presented a second high-contrast target (200 ms duration) that differed slightly in both spatial frequency and orientation from the initial target. Subjects were then cued to compare either the spatial frequency or the orientation of the stimuli, and responded with a button press. Subjects received feedback (correct, incorrect) after each trial. Each subject practiced the task extensively (several hours across several days) prior to the MRI scanning sessions. The spatial frequency and orientation differences between targets were then determined for each subject individually to be at threshold (80% correct). During the scanning sessions, performance was maintained at about 80% correct (on average, across delay-period durations) by a staircase procedure. To discourage the subjects from adopting a verbal strategy and to encourage them to adopt a visual memory strategy, the spatial frequency, orientation, and phase of the first stimulus were substantially jittered (spatial frequency was randomized from 1–3 cpd, and orientation and phase were fully randomized) (Lages & Treisman, 1998). Furthermore, subjects did not know until after having seen both stimuli whether they would be asked to compare spatial frequency or orientation. If performance accuracy in this task had depended systematically on delay duration, then these differences in task difficulty and performance accuracy might have confounded the interpretation of our results. However, Magnussen et al. found that comparisons of spatial frequency and orientation can be performed without detriment at delays beyond 16 s (Magnussen & Greenlee, 1992, 1999; Magnussen, Greenlee, Asplund, & Dyrnes, 1991; Magnussen, Greenlee, & Thomas, 1996). Behavioral testing on our subjects confirmed that performance was ~80% correct for all delay durations (Figure 2).
Figure 2. Behavioral performance.
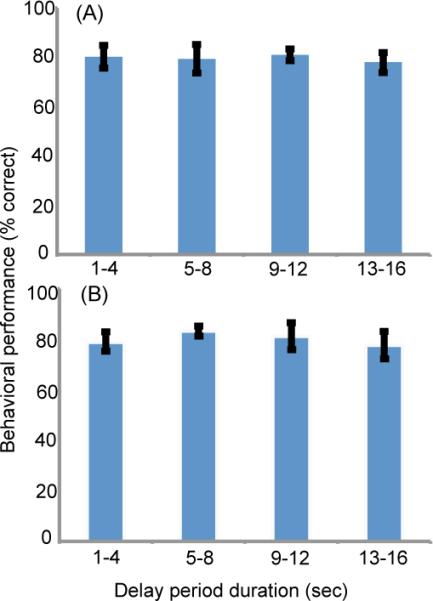
(A) Delayed comparison task. (B) Detection task. Plotted are the means and standard errors across five subjects, for delay durations binned into four groups: 1 – 4 s, 5 – 8 s, 9 – 12 s, and 13 – 16 s.
Detection task (Figure 1B)
Following the presentation of the first visual target stimulus and the variable delay period, a low-contrast target was displayed briefly (120–170 ms) on half of the trials. Display duration and contrast were determined for each subject individually, following extensive practice, to be at threshold (80% correct), and performance accuracy was maintained in the scanner by a staircase procedure. The low-contrast target's orientation and phase were fully randomized. Spatial frequency was randomized between 2.5 to 3.5 cpd; this range of spatial frequencies was narrower than that used in the delayed-comparison task to insure that the spatial frequencies within this range were roughly equally detectable (Campbell & Robson, 1968). A final cue then signaled the subject to respond via a button press as to whether or not the target had been shown. Subjects received feedback (correct, incorrect) after each trial. Note that for this task, the initial stimulus did not need to be remembered, but instead merely signaled that the trial had started, thereby cueing the subject to attend to the spatial location defined by the annulus.
As reported previously (Offen, et al., 2009), we confirmed that attention contributed to the detection task, by using a psychophysical dual-task control experiment that was performed in separate experimental sessions outside the scanner. Four subjects (three from the main study, and one additional) performed the detection task along with a rapid serial visual presentation (RSVP) task in the periphery (5 degrees eccentricity) (Braun, 1998; D K Lee, Itti, Koch, & Braun, 1999; D. K. Lee, Koch, & Braun, 1997; Sperling & Melchner, 1978). For the RSVP task, the letter R was presented repeatedly at random orientations (rate of presentation was about 4 Hz, adjusted individually for each subject to control task difficulty). Occasionally (on average every 2 s), a mirror-reversed R was shown (at a random orientation), and subjects indicated by keypress if they saw the target. Subjects were instructed to focus primarily on the grating-detection task for two blocks of trials (50 trials per block), and on the RSVP task for two blocks. When attention was diverted by the RSVP task, performance on the detection task was significantly worse (Table 1).
Table 1. Behavioral results for dual-task control experiment.
We measured performance (d-prime) for the detection task when paired with a rapid serial visual presentation (RSVP) task (see Methods). Shown are d-prime measurements for four subjects when instructed to focus primarily on the detection task or the RSVP task, respectively. All four subjects showed a highly significant difference in performance accuracy (p<1e−4, bootstrap statistical test, resampling 5,000 times).
| d-prime | p-value | ||
|---|---|---|---|
| primary task: detection | primary task: RSVP | difference in d-prime | |
| Subject 1 | 2.0 | 1.5 | < 1e−4 |
| Subject 3 | 1.8 | 1.0 | < 1e−4 |
| Subject 5 | 1.5 | 0.9 | < 1e−4 |
| Subject 6 | 2.4 | 1.6 | < 1e−4 |
Further evidence that subjects were maintaining spatial attention during the detection task experiment is that there was sustained activity in V1 and other early visual areas (Offen, et al., 2009).
Analysis
fMRI data were acquired and preprocessed as described below (Pre-processing and motion correction), and analyzed individually in each of several predefined regions of interest (ROIs) in the frontal and parietal lobes (see below, Identification of regions of interest). Data for each voxel in each ROI were extracted (without spatial smoothing) and averaged across gray matter voxels within each ROI. Two complementary analyses of the data within the ROIs were done to measure: (i) the fMRI response time course for each trial type, and (ii) the response amplitudes for each of the three intervals of the behavioral task (first target presentation, delay period, second target presentation/behavioral response). Data were analyzed separately for each individual subject; statistical significance of the measured responses was then assessed by combining the results across subjects, treating inter-subject differences in the fMRI responses as a random effect (as detailed below). Data were also analyzed by concatenating the measured fMRI time series across subjects, treating inter-subject differences in the fMRI responses as a fixed effect.
fMRI response time courses
Standard event-related analysis methods (Burock, Buckner, Woldorff, Rosen, & Dale, 1998; Burock & Dale, 2000; Dale, 1999) were used to measure the fMRI response time course for each trial type. For each task, correct and incorrect trials were separated, and the trials were binned into four trial-type bins, depending on the delay-period duration (1–4 s, 4–8 s, 8–12 s, 12–16 s). The fMRI responses from each scan were calculated by trial-triggered averaging, specifically by averaging throughout the region of cortical gray matter corresponding to each predefined cortical area, and averaging across trials within each delay-period bin. The fMRI responses were averaged, separately for each subject, across the 8–16 runs of each task condition. The mean responses were plotted with error bars representing the standard error of the mean (S.E.M.) across trials (i.e., with N = number of trials in each delay-period bin). Data were analyzed individually for each subject, and also concatenated across all subjects. The concatenated data are shown in Figure 3B, for correct trials in the longest time bins, along with the model fits (described below).
Figure 3. Model fits.

(A) Data were modeled with three components (see Methods). s1, transient response to the first stimulus interval. s2, transient response to the second stimulus interval and the behavioral response. d, sustained delay-period activity. HRF, hemodynamic response function. (B) Measured response time courses and model fits (trial-triggered averages for correct trials, combined across subjects). Top row, delayed comparison task. Bottom row, detection task. Error bars represent SEM across trials.
Response amplitudes
Multiple linear regression was used to measure the amplitudes of the responses to each of the three distinct intervals of each task for correct and incorrect trials separately. Each trial was modeled with three components (Figure 3A): (1) a transient at the beginning of each trial that reflected the response to the first visual target stimulus (labeled s1), modeled as being one time-point (2 s) in duration; (2) a sustained component that had a constant amplitude and lasted throughout the delay period (labeled d; duration = 1–16 s); and (3) a component at the end of each trial that captured the response to the second visual target stimulus as well the subject's behavioral response (labeled s2), and that was modeled as being sustained for two time-points (4 s) in duration. A total of six response amplitude components (s1, d, s2 for correct and incorrect trials) served as the model of the underlying neural activity, which was then convolved with a measured hemodynamic impulse response function (HRF; see below, Hemodynamic impulse response functions), and band-pass filtered in the same way as the measured fMRI data (see below, Pre-processing and motion correction) to yield a design matrix with six predictors of the fMRI measurements. The model was fit simultaneously to all the scans, to obtain measurements for the six amplitudes. The delay-period response amplitudes for the correct trials are summarized in Table 3.
Table 3. Delay-period response amplitudes.
Each cell lists delay-period response amplitude (d) . Columns are grouped by ROI, broken down into left and right hemispheres. Rows are grouped by subject, broken down into the two tasks: delayedcomparison and detection. Top row is for all subjects combined by concatenating the measured fMRI time series across subjects. Asterisks indicate response amplitudes significantly above zero (***, p < 0.005; **, p < 0.01; *, p < 0.05).
| Region of Interest (ROI) |
||||||||
|---|---|---|---|---|---|---|---|---|
| DMsPCS | DLsPCS | IPS | ||||||
| Subject | Experiment | left | right | left | right | left | right | |
| Delay-period response amplitude (au) | All | Del. Comp. | 0.10 | 0.06 | 0.16*** | 0.18*** | 0.06 | −0.11 |
| Detection | 0.05 | 0.11 | 0.19*** | 0.26*** | 0.04 | −0.06 | ||
|
| ||||||||
| S1 | Del. Comp. | 0.08 | −0.12 | −0.10 | 0.19* | 0.09 | 0.06 | |
| Detection | 0.09 | 0.28* | 0.14 | 0.29* | 0.01 | 0.04 | ||
|
| ||||||||
| S2 | Del. Comp. | 0.11 | 0.15 | −0.01 | −0.04 | −0.03 | −0.45 | |
| Detection | 0.12 | 0.18** | 0.13* | 0.27*** | 0.11 | −0.18 | ||
|
| ||||||||
| S3 | Del. Comp. | −0.12 | 0.05 | 0.30* | 0.24 | 0.06 | −0.09 | |
| Detection | −0.24 | −0.10 | −0.05 | 0.07 | −0.14 | −0.17 | ||
|
| ||||||||
| S4 | Del. Comp. | 0.36*** | 0.24* | 0 40*** | 0.48*** | 0.18 | 0.02 | |
| Detection | 0.37*** | 0.24* | 0.48*** | 0.57*** | 0.18 | 0.03 | ||
|
| ||||||||
| S5 | Del. Comp. | 0.13 | 0.12 | 0.19** | 0.05 | 0.00 | −0.13 | |
| Detection | 0.02 | 0.03 | 0.22** | 0.21*** | 0.06 | −0.06 | ||
p < 0.005
p < 0.01
p < 0.05
Because the order of the delay period durations was randomized, this randomization (in addition to measurement noise) contributed to the variability across scans in the response amplitudes. To assess the variability in the model fits and to compare the model with the measured fMRI responses, the mean and SEM of trial-triggered average were calculated for the model, as described above for the data. The mean and SEM of the model fit were then superimposed with the mean and SEM of the fMRI responses; these are shown in Figure 3B for the data combined across all subjects. Goodness-of fit comparing the trial-triggered averages of the data and the model was quantified by computing r2 values (1 − (variance of the residuals/variance of the data)), where residuals = (model − data), across all delay periods; these values are summarized in Table 4. This analysis was similar to that done by (Schluppeck, Curtis, Glimcher, & Heeger, 2006).
Table 4. Model fits to the data (r2).
Each cell lists the r2 for the model fit to the data. Columns are grouped by ROI, broken down into left and right hemispheres. Rows are grouped by subject, broken down into the two tasks: delayed-comparison and detection. Top row is for all subjects combined by concatenating the measured fMRI time series across subjects.
| Region of Interest (ROI) |
||||||||
|---|---|---|---|---|---|---|---|---|
| DMsPCS | DLsPCS | IPS | ||||||
| Subject | Experiment | left | right | left | right | left | right | |
| Model fit to the data (r2) | All | Del. Comp. | 0.91 | 0.91 | 0.89 | 0.92 | 0.88 | 0.87 |
| Detection | 0.82 | 0.75 | 0.74 | 0.86 | 0.84 | 0.78 | ||
|
| ||||||||
| S1 | Del. Comp. | 0.75 | 0.76 | 0.62 | 0.84 | 0.71 | 0.73 | |
| Detection | 0.55 | 0.36 | 0.21 | 0.68 | 0.52 | 0.48 | ||
|
| ||||||||
| S2 | Del. Comp. | 0.81 | 0.79 | 0.48 | 0.89 | 0.75 | 0.69 | |
| Detection | 0.57 | 0.28 | 0.25 | 0.74 | 0.46 | 0.34 | ||
|
| ||||||||
| S3 | Del. Comp. | 0.78 | 0.76 | 0.87 | 0.79 | 0.88 | 0.87 | |
| Detection | 0.67 | 0.50 | 0.48 | 0.48 | 0.73 | 0.59 | ||
|
| ||||||||
| S4 | Del. Comp. | 0.65 | 0.68 | 0.83 | 0.77 | 0.68 | 0.56 | |
| Detection | 0.66 | 0.54 | 0.81 | 0.80 | 0.73 | 0.73 | ||
|
| ||||||||
| S5 | Del. Comp. | 0.62 | 0.45 | 0.63 | 0.51 | 0.70 | 0.61 | |
| Detection | 0.69 | 0.65 | 0.72 | 0.76 | 0.64 | 0.60 | ||
p < 0.005
p < 0.01
p < 0.05
Statistics
Several complementary analyses were performed to confirm that the results were robust. (1) For each experiment and each predefined cortical area, a one-tailed t-test (across subjects) for magnitude greater than zero was performed on the delay-period response amplitudes (d) across subjects; statistically significant results are indicated by white asterisks in Figure 5. (2) Paired t-tests on delay-period response amplitudes across experimental conditions (i.e., pairing the detection and delayed-comparison tasks for each subject, across all subjects) were performed, to determine if the different tasks produced different levels of delay-period activity; no significant differences were found in the frontal and parietal ROIs. (3) Delay-period response amplitudes were tested to see if they were significantly different from zero for each individual subject, using a permutation test (Efron & Tibshirani, 1993; Nichols & Hayasaka, 2003; Raz, Zheng, Ombao, & Turetsky, 2003) that compared the measured delay-period response amplitudes with the distribution of response amplitudes expected by chance according to the null hypothesis that there was no delay-period activity. Statistically significant results are indicated by asterisks in Table 3.
Figure 5. Delay-period activity.
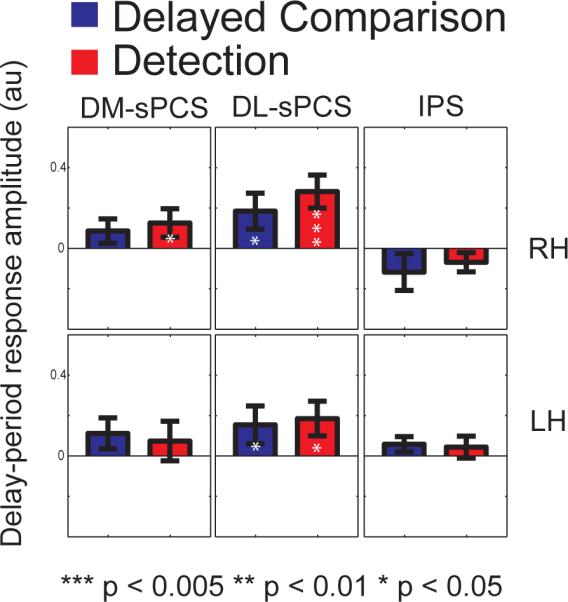
Delay-period response amplitudes were averaged across subjects for the two tasks (blue: delayed- comparison, red: detection), for each predefined cortical area. Error bars are standard error of the mean across subjects. White asterisks within the bars indicate response amplitudes significantly above zero, as determined by a one-tailed t-test across subjects (***, p < 0.005; **, p < 0.01; *, p < 0.05).
The permutation test determined whether the neural activity was indeed a response to the experimental task, by comparing the response amplitudes calculated using the actual trial sequence to a distribution of response amplitudes calculated using random trial sequences. This statistical distribution for the null hypothesis was generated by refitting the data 5,000 times. For each iteration, a random trial sequence was generated (following the same algorithm that was used to generate the actual trial sequence) and the data were preprocessed and analyzed as described above. Each iteration yielded a delay-period response amplitude (d), but this no longer represented an actual measurement. Rather, it was derived from a random permutation of the trials, giving us a distribution for the null hypothesis to which we compared the measured responses for the actual trial sequence.
Functional Imaging
Magnetic resonance imaging at 3T (Allegra, Siemens, Erlangen, Germany) was used to measure blood-oxygen level-dependent (BOLD) changes in cortical activity. During each fMRI scan, a time series of volumes was acquired using a T2*-sensitive echo planar imaging (EPI) pulse sequence (repetition time 2000 ms, echo time 30 ms, flip angle 82 deg, 3×3×3 mm voxels, field of view 192×192×108 mm, 36 slices oriented to cover the entire cerebral cortex). Images were acquired using custom radio-frequency coils (NM-011 transmit head coil and NMSC011 flexible four element array, NOVA Medical, Wakefield, MA).
Pre-processing and motion correction
To minimize head motion, subjects were stabilized by use of a bite bar, foam padding, or both. Post-hoc image registration was used to correct for residual motion in the functional data (Jenkinson, Bannister, Brady, & Smith, 2002). Data from the first 10 s of each fMRI scan, during which subjects maintained fixation, were discarded to minimize transient effects of magnetic saturation and to allow the hemodynamics to achieve steady state. Further preprocessing of the fMRI data was as follows. First, the time series at each voxel was band-pass filtered to compensate for the slow drift typical in fMRI measurements (B. Biswal, Hudetz, Yetkin, Haughton, & Hyde, 1997; B. Biswal, Yetkin, Haughton, & Hyde, 1995; B. B. Biswal, Van Kylen, & Hyde, 1997; Purdon & Weisskoff, 1998; Smith, et al., 1999; Zarahn, Aguirre, & D'Esposito, 1997). The cutoff frequencies were 0.0125 and 0.125 Hz, making the low frequency cutoff much lower than the inverse of the longest delay period to ensure that the filter did not attenuate the sustained delay-period activity. Next, each voxel's time series was divided by its mean intensity to convert the data from arbitrary image intensity units to percent signal modulation and to compensate for the decrease in mean image intensity with distance from the receive coil. The resulting time series were averaged over a region of cortical gray matter corresponding to each of several predefined cortical areas. Methods for defining the cortical areas are outlined below.
Anatomical imaging, registration, and gray matter segmentation
A high-resolution anatomical volume was acquired of each subject's brain using a T1-weighted, 3D-MPRAGE pulse sequence (1·1·1 mm voxels). These anatomical volumes were used to: (1) register the functional data across scanning sessions, (2) restrict the functional data analysis to gray-matter voxels, and (3) computationally flatten the gray matter to create cortical-surface visualizations of the cortical activity. Gray and white matter were segmented, and cortical-surface visualizations were computed using custom software (Larsson, 2001).
Each functional fMRI session began by acquiring a set of anatomical images in the same slices as the functional images (T1-weighted, MPRAGE pulse sequence). An image registration algorithm (Nestares & Heeger, 2000) was used to align these in-plane anatomical images to the high-resolution anatomical volume of the observer's brain (see above), so that the data from a given subject were co-registered across scanning sessions.
Identification of regions of interest (ROIs)
ROIs were defined individually for each subject in the precentral sulcus and intraparietal sulcus. In frontal cortex, two regions of interest were identified based on previous research (Blanke, et al., 2000; Grosbras, et al., 2005), and defined anatomically following the method used by Srimal et al. (Srimal & Curtis, 2008): the dorso-medial and dorso-lateral sections of the superior precentral sulcus (DM- and DL-sPCS). We also identified a parietal region, along the intraparietal sulcus (IPS). This region was defined anatomically, but also in reference to retinotopic areas that we defined for each subject, as adjacent and dorsal to area V7. ROI locations were similar for all subjects; however, because of differences in brain anatomy across subjects, ROIs did not precisely overlap, even after co-registration into Talairach coordinates.
These anatomically-defined ROIs overlapped with functionally-defined cortical areas in the frontal and parietal lobes. Two subjects (S1 and S2) had participated in an earlier study in our lab (Schluppeck, et al., 2006) that used saccades to functionally define several ROIs, including the FEF, IPS1, and IPS2. The functionally-defined FEF overlapped with the sPCS regions that were defined anatomically (illustrated for Subject 2 in Figure 4). IPS1 and IPS2 are topographically-organized cortical areas in the intraparietal sulcus adjacent, and anterior, to visual cortical area V7 (Schluppeck, Glimcher, & Heeger, 2005; Silver, Ress, & Heeger, 2005). Our anatomically-defined IPS region contained IPS1 and IPS2 for both subjects, and we confirmed that if the data analysis was restricted to these regions, the results were similar. ROI locations for Subject 2 are shown in Figure 4.
Figure 4. ROI locations.
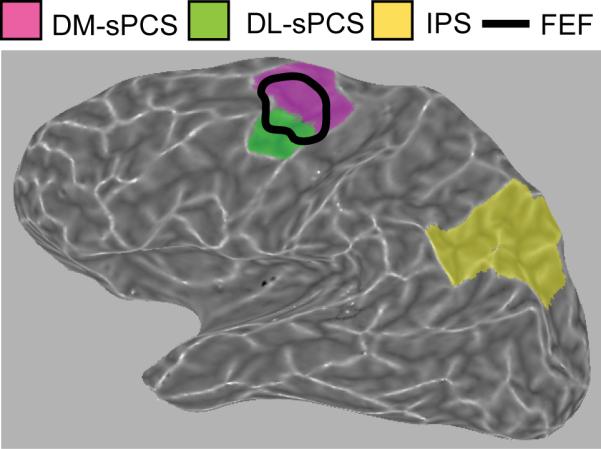
Anatomically defined cortical regions of interest (ROIs) are shown for Subject 2. Black outline indicates the location of FEF as functionally defined for this subject by a saccade task (Schluppeck et al., 2006). ROI locations were similar for the other subjects.
For each task, the ROIs were restricted to voxels that were well-fit by the general linear model described above, regardless of amplitude values for the model components. Specifically, the model fit was calculated by amount of variance accounted for, r2, as defined above. P-values calculated by a statistical test on the correlation between the data and the model were used to restrict the ROIs. We used the false discovery rate (FDR) (Genovese, Lazar & Nichols, 2002) (http://www.sph.umich.edu/~nichols/FDR/) to control for multiple comparisons and calculate the p-value threshold that would yield a very low (corrected p-value of .001) proportion of false positives out of the total number of voxels for which the null hypothesis (of zero correlation between model and timecourse) was rejected. Restricting the ROIs in this way did not bias the conclusions drawn about delay-period activity; a voxel could have a perfect r2 value but a delay-period response amplitude (d) of zero, if that voxel showed no response during the delay period. The ROIs were restricted by the fit to the data for each task separately, and then combined for both tasks by taking the union of the resultant restricted regions, so that the same ROIs were used to compare the two tasks.
Hemodynamic impulse response functions (HRFs)
Because HRFs vary across individuals (Aguirre, Zarahn, & D'Esposito, 1998; Offen, et al., 2009), we measured an impulse response for each subject by modeling the HRF with a parametric function and estimating the parameters that resulted in the best fit. The parametric function we chose was spm_hrf, (a Matlab function that is part of the SPM toolbox). Three parameters (amplitude, delay of the response, and the delay of the undershoot) were allowed to vary; the remaining parameters (the width of the response, the width of the undershoot, and the ratio of the response to the undershoot) were held constant. We adopted a model similar to the one described above (Figure 3; s1, d, s2), and measured the three free parameters of the HRF by using a nonlinear least-squares (lsqnonlin) fit to the data from both experiments and all ROI voxels, individually for each subject. Using all the data ensured that the HRF was not biased because of being derived from the data of one experiment, or one particular ROI, rather than another.
Results
Detection task
Subjects performed a visual detection task in which the target stimulus was a low-contrast sinusoidal grating displayed in an annulus around fixation (Figure 1B; see Methods). An initial high-contrast grating stimulus indicated the beginning of each trial, and was followed by a variable delay period (1–16 s) during which the subject had to maintain spatial attention to detect a low-contrast grating that was presented following the delay period on half of the trials. If any of the predefined cortical areas were involved in maintaining spatial attention by boosting neuronal activity, then those cortical areas would be expected to exhibit sustained responses during the delay period.
Delayed-comparison task
Task design was similar to the detection task, with the following differences (Figure 1A; see Methods). The first visual target stimulus was informative and needed to be remembered. After the variable delay period, a second high-contrast visual target stimulus was displayed, with a slightly different orientation and spatial frequency from the first. Subjects were then cued to compare either the spatial frequency or the orientation of the two visual target stimuli. The spatial frequency, orientation and phase of the first visual stimulus were randomized so as to make it very difficult to solve the task using a verbal strategy rather than a visual one. If any of the predefined cortical areas were involved in actively maintaining a short-term memory representation of the first visual target, then those cortical areas would be expected to exhibit sustained response during the delay period.
Behavioral performance
Psychophysical thresholds and percent correct for all five subjects and both tasks are summarized in Table 2. By design, mean percent correct was 81% (controlled by a staircase procedure; range: 76% – 91%). Performance did not depend on delay-period duration (Figure 2). The staircase procedure was used to maintain performance at ~80% correct on average across delay-period durations. If performance had depended on delay-period duration then it would have been greater than 80% correct for short delays and lower for longer delays, but there was no evidence for this.
Table 2. Behavioral performance for all five subjects and both psychophysical tasks.
Shown are the threshold measurements and percent correct performance. For the delayedcomparison task, two dimensions were varied: spatial frequency (SF, thresholds given in percent difference between the spatial frequencies of the first and second visual stimuli) and orientation (OR; thresholds given in degrees difference between the orientations of the first and of the second visual stimuli). For the detection task, contrast was varied and thresholds are given in percent contrast. By design, mean percent correct was 81% (range 76% – 91%).
| Subject 1 | Subject 2 | Subject 3 | Subject 4 | Subject 5 | ||
|---|---|---|---|---|---|---|
| Delayed Comparison | SF (%) | 10 | 16 | 20 | 18 | 18 |
| OR (deg) | 10 | 16 | 22 | 12 | 21 | |
| % Correct | 85 | 80 | 91 | 86 | 78 | |
|
| ||||||
| Detection | Contrast (%) | 7.9 | 0.8 | 1.9 | 0.9 | 1.2 |
| % Correct | 76 | 83 | 81 | 80 | 85 | |
Model fits and delay-period response amplitude
To quantify the sustained delay-period activity, we measured the response amplitudes in each of the predefined cortical areas to the task components (first visual target stimulus, s1; delay period, d; second visual target stimulus, s2) using linear regression (see Methods and Figure 3A), separately for correct and incorrect trials. There was no evidence for a difference between the delay-period responses on correct versus incorrect trials in any of the predefined cortical regions.
The model fit the data well (Figure 3). In Figure 3B, model fits are plotted overlaid on the trial-triggered averages of the data for the longest delay periods of correct trials, concatenated across all subjects. Delay-period response amplitudes and r2 values calculated for all subjects individually are summarized in Tables 3 and 4 respectively. The pattern of results was qualitatively the same if the data from both hemispheres were combined.
Figure 5 compares the delay-period response amplitudes averaged across subjects for the two tasks, for each predefined cortical area. Note that the fixed-effects analysis shown in Figure 3, in which all the data for all the subjects were combined (by concatenating the fMRI time series across subjects), and a single delay-period response amplitude was measured, is different from and complementary to the random-effects analysis presented in Figure 5, in which the response amplitudes were measured for each subject separately and averaged.
Sustained delay-period activity was evident in the precentral sulcus (PCS) for both tasks. Dorsolateral superior PCS (DL-sPCS) showed evidence for significant delay-period activity in both hemispheres for both tasks, with no evidence for any difference between the tasks (Figure 5). Table 3 confirms that this result was robust across subjects. Dorsomedial superior PCS (DM-sPCS) showed delay-period activity as well, but this activity was statistically significant only for the detection task, in the right hemisphere (Figure 5).
The results in the intraparietal sulcus (IPS) showed no evidence of a significant sustained delay-period response for either task (Figure 5). We also analyzed the data using the functionally defined IPS1 and IPS2 that we had for subjects 1 and 2, with the same results. The lack of evidence for sustained delay-period activity in IPS was surprising in light of previous imaging work (e.g., Pessoa, Gutierrez, Bandettini, & Ungerleider, 2002) that found sustained responses in IPS during a working memory task, and previous imaging work (Lauritzen, D'Esposito, Heeger, & Silver, 2009) that reported sustained IPS responses during a very similar detection task. This will be discussed further below. Because this result disagrees with some previously published reports (see Discussion), we wanted to make sure that we had correctly identified the ROI. We reanalyzed the data using many different ways of defining the IPS ROI and choosing thresholds, all with similar results.
Discussion
Sustained delay-period activity in frontal cortex
Our results provided evidence for significant sustained delay-period activity in dorsolateral superior precentral sulcus (DL-sPCS) for both tasks (Figures 3, 5; Table 3).
In contrast with early visual cortex (Offen, et al., 2009), the precentral sulcus did show significant evidence of sustained delay-period activity for the delayed-comparison (working memory) task, most strongly in DL-sPCS (Figures 3, 5; Table 3). This was consistent with what had been reported by earlier studies, that the FEF is involved in maintaining visual working memory (Curtis, Rao, & D'Esposito, 2004; Funahashi, Bruce, & Goldman-Rakic, 1989; Leung, Gore, & Goldman-Rakic, 2002; McCarthy, et al., 1994; Pessoa, et al., 2002; Sakai, Rowe, & Passingham, 2002; Sommer & Wurtz, 2001; Umeno & Goldberg, 2001; Zarahn, Aguirre, & D'Esposito, 1999). One interpretation of the role of such sustained activity in working memory tasks in the FEF is that it is related to the control of eye movements (Curtis, 2006; Curtis, et al., 2004; Srimal & Curtis, 2008). However, in our working memory task, it was not clear what role eye movements could play, given that the information being retained was related to orientation and spatial frequency rather than spatial location. It is less plausible to suggest that frontal cortex was encoding orientation and spatial frequency per se, since there is no limit to the number and combination of features that subjects may be called upon to remember, and every particular case cannot be equally represented in full detail in frontal cortex. Rather, frontal cortex must allow for a flexible representation of the information being actively maintained in working memory, a flexibility both in time (over variable delays) and in content (over many possible memoranda).
DL-sPCS also showed evidence for sustained delay-period activity during the detection task, consistent with other studies implying a role for the FEF in attention. For example, Moore and colleagues found that microstimulation of FEF caused improved behavioral performance in an attention task (Moore & Fallah, 2001). In a separate experiment, they found that microstimulation of FEF caused enhanced visual responses in V4 (Moore & Armstrong, 2003). Ekstrom and colleagues (Ekstrom, Roelfsema, Arsenault, Bonmassar, & Vanduffel, 2008) reported enhancement in the fMRI responses of early visual areas following microstimulation of the FEF, but only in the presence of a visual stimulus. In contrast, we found evidence of increased fMRI responses in FEF and early visual cortex (Offen, et al., 2009) during the delay period, in the absence of a visual stimulus. This is consistent with the report of top-down modulation of visual cortex by the FEF and IPS in anticipation of a visual stimulus, as characterized by Granger causality analysis of fMRI data (Bressler, Tang, Sylvester, Shulman, & Corbetta, 2008).
The sustained increase in activity that we recorded in early visual cortex in the absence of a visual stimulus during the delay of the detection task (Offen, et al., 2009) suggested feedback from higher areas. The sustained delay-period activity in the DL-sPCS for the detection task might have been responsible for maintaining the sustained responses in early visual cortex. If so, this would suggest the existence of a gating mechanism that determined the conditions under which sustained activity in the DL-sPCS evoked sustained activity in early visual cortex, because DL-sPCS exhibited sustained delay-period responses for the delayed-comparison task as well, while early visual cortex did not show evidence for similarly sustained responses for that task. Alternatively, the sustained activity in DL-sPCS for the two tasks might have reflected activity in different subpopulations of neurons, one of which was responsive during the delay in the attention task and fed back to early visual cortex, and the other of which was responsive during the delay in the working memory task and did not feed back to early visual cortex.
Another possibility is that there was a sustained representation in the pattern of activity in visual cortex but not an overall increase in mean response amplitude, which could occur if increased responses in one subpopulation were offset by decreased responses in a different subpopulation (Harrison & Tong, 2009; Serences, et al., 2009). The result would be a selective pattern of activity with no net change in the average response amplitude, and therefore no overall delay-period activity. In that case, DL-sPCS might modulate the responses in visual cortex for both tasks, but differently for each task. For the attention task, the DL-sPCS may increase the responses of all neurons in visual cortex with receptive fields that overlap the stimulus annulus, resulting in a net increase in delay-period activity in our ROIs. For the working memory task, on the other hand, DL-sPCS may increase the responses of only the subpopulation of neurons in visual cortex with orientation and spatial-frequency preferences that match the remembered stimulus, while decreasing the responses of other neurons with different preferences, resulting in no net change in delay-period activity.
It is possible that the area we localized as FEF (Schluppeck, et al., 2006), although it responded strongly during saccades, may not be the same area of the brain as that characterized using microstimulation in the macaque monkey (Bruce, Goldberg, Bushnell, & Stanton, 1985). Though human FEF is commonly localized to an area near the junction of the precentral sulcus with the superior frontal sulcus (Corbetta, et al., 1998; Grosbras, et al., 2005; Luna, et al., 1998; Petit, Clark, Ingeholm, & Haxby, 1997), some studies suggest it might be more ventrally located (Blanke, et al., 2000). This is why we refer to the ROI by its anatomical location (DL-sPCS) rather than its functional name (FEF).
Lack of evidence for sustained activity in parietal cortex
Surprisingly, we did not find evidence for sustained delay-period activity during the working memory task in parietal cortex, unlike other reports in the literature (Curtis, 2006; Gnadt & Andersen, 1988; Pessoa, et al., 2002; Schluppeck, et al., 2006; Srimal & Curtis, 2008). One possible explanation is related to the idea of memory load. Xu and colleagues (Xu & Chun, 2006) studied the effect of object complexity and object number on the responses recorded during a working memory task in lateral occipital cortex (LOC) and superior and inferior IPS. The relevant finding for the discussion here is that the IPS responses during the delay period increased with the number of objects being represented, and evidence for sustained delay-period activity only became clear for multiple objects. This could explain why we failed to find sustained activity in IPS, as our stimuli were simple single gratings displayed in an annulus around fixation (Figure 1). This could also clarify why our results were different from those found by Pessoa et al. (Pessoa, et al., 2002) in anterior IPS, as their stimulus was composed of multiple line segments.
It was also surprising we did not see evidence for a sustained response in IPS during the delay of the detection task, unlike other fMRI studies that suggest IPS plays a role in maintaining visual attention (Bressler, et al., 2008; Corbetta & Shulman, 2002), even in a detection task very similar to ours (Lauritzen, et al., 2009). We analyzed the data for a range of possible IPS sizes and borders. We did find delay-period activation in some of these analyses, but it was not robust or consistent across subjects, in contrast with our findings in the FEF. Two out of our five subjects showed some evidence of delay-period activity in some analyses in one or the other hemisphere.
The surprising discrepancy between our results and previously published reports is a challenge to explain, and at this point we can only guess at the reasons. The difference might be that our subjects were also trained on a memory task, and perhaps this may have influenced their strategy in the detection task in a way that bypassed IPS. Consistent with this idea, two of the three subjects who failed to show sustained delay-period activity in IPS had trained on the memory task and completed that scanning session before training on the detection task. It is not clear to us, however, why this training sequence would lead to a difference in strategy that would bypass IPS.
Correct vs. Incorrect Trials
Unlike some previous reports (Bressler, et al., 2008; Pessoa, et al., 2002) we did not find evidence for a difference in delay-period response amplitudes for the correct vs. incorrect trials in any of the defined ROIs. We did look at other brain areas, but found no robust or consistent evidence for a fronto-parietal signal that predicted performance. Bressler et al. showed that Granger causality from right IPS to visual cortex was predictive of behavioral performance. Granger causality is not a measure of magnitude, and increased Granger causality for correct trials does not necessarily mean there were larger fMRI response amplitudes. Pessoa et al. presented clear evidence for larger response amplitudes on correct vs. incorrect trials during the delay period of a working memory task. They offer an explanation for why Zarahn et al. (Zarahn, Aguirre, & D'Esposito, 2000) failed to find evidence for a difference in the delay-period activity of correct vs. incorrect trials for a working memory task. Their explanation can equally be applied to our results: Possibly, subjects do maintain information during the delay period for both correct and incorrect trials, but maybe the information being maintained is faulty for the incorrect trials. Pessoa avoided this pitfall by confining the analysis only to trials for which the fMRI signal was strong during encoding.
Conclusions
Differential roles for FEF and IPS
Our results show a clear difference for both tasks between the responses in the FEF, which showed sustained delay-period activity, and the responses in the IPS, which did not exhibit robust sustained activity. This is an interesting finding in light of many studies that reported similar activation for the two areas with other tasks (for a review, see Curtis, 2006). One might have expected to see the reverse pattern, with sustained delay-period activity only in the IPS for the delayed-comparison task, which depends on a retrospective sensory trace rather than a prospective motor plan. Our results, therefore, support a general working-memory role for the FEF.
Acknowledgments
Support contributed by: NEI (R01-EY011794, T32-EY07136), NIMH (R01-MH069880, F31-MH076611), NSF GRF, the Seaver Foundation, and the Swartz Foundation.
References
- Aguirre GK, Zarahn E, D'Esposito M. The variability of human, BOLD hemodynamic responses. Neuroimage. 1998;8(4):360–369. doi: 10.1006/nimg.1998.0369. [DOI] [PubMed] [Google Scholar]
- Biswal B, Hudetz AG, Yetkin FZ, Haughton VM, Hyde JS. Hypercapnia reversibly suppresses low-frequency fluctuations in the human motor cortex during rest using echo-planar MRI. J Cereb Blood Flow Metab. 1997;17(3):301–308. doi: 10.1097/00004647-199703000-00007. [DOI] [PubMed] [Google Scholar]
- Biswal B, Yetkin FZ, Haughton VM, Hyde JS. Functional connectivity in the motor cortex of resting human brain using echo-planar MRI. Magn Reson Med. 1995;34(4):537–541. doi: 10.1002/mrm.1910340409. [DOI] [PubMed] [Google Scholar]
- Biswal BB, Van Kylen J, Hyde JS. Simultaneous assessment of flow and BOLD signals in resting-state functional connectivity maps. NMR Biomed. 1997;10(4–5):165–170. doi: 10.1002/(sici)1099-1492(199706/08)10:4/5<165::aid-nbm454>3.0.co;2-7. [DOI] [PubMed] [Google Scholar]
- Blanke O, Spinelli L, Thut G, Michel CM, Perrig S, Landis T, et al. Location of the human frontal eye field as defined by electrical cortical stimulation: anatomical, functional and electrophysiological characteristics. Neuroreport. 2000;11(9):1907–1913. doi: 10.1097/00001756-200006260-00021. [DOI] [PubMed] [Google Scholar]
- Braun J. Vision and attention: the role of training. Nature. 1998;393(6684):424–425. doi: 10.1038/30875. [DOI] [PubMed] [Google Scholar]
- Bressler SL, Tang W, Sylvester CM, Shulman GL, Corbetta M. Top-down control of human visual cortex by frontal and parietal cortex in anticipatory visual spatial attention. J Neurosci. 2008;28(40):10056–10061. doi: 10.1523/JNEUROSCI.1776-08.2008. [DOI] [PMC free article] [PubMed] [Google Scholar]
- Bruce CJ, Goldberg ME, Bushnell MC, Stanton GB. Primate frontal eye fields. II. Physiological and anatomical correlates of electrically evoked eye movements. J Neurophysiol. 1985;54(3):714–734. doi: 10.1152/jn.1985.54.3.714. [DOI] [PubMed] [Google Scholar]
- Burock MA, Buckner RL, Woldorff MG, Rosen BR, Dale AM. Randomized event-related experimental designs allow for extremely rapid presentation rates using functional MRI. Neuroreport. 1998;9(16):3735–3739. doi: 10.1097/00001756-199811160-00030. [DOI] [PubMed] [Google Scholar]
- Burock MA, Dale AM. Estimation and detection of event-related fMRI signals with temporally correlated noise: a statistically efficient and unbiased approach. Hum Brain Mapp. 2000;11(4):249–260. doi: 10.1002/1097-0193(200012)11:4<249::AID-HBM20>3.0.CO;2-5. [DOI] [PMC free article] [PubMed] [Google Scholar]
- Campbell FW, Robson JG. Application of Fourier Analysis to Visibility of Gratings. Journal of Physiology-London. 1968;197(3):551. doi: 10.1113/jphysiol.1968.sp008574. [DOI] [PMC free article] [PubMed] [Google Scholar]
- Chawla D, Rees G, Friston KJ. The physiological basis of attentional modulation in extrastriate visual areas. Nat Neurosci. 1999;2(7):671–676. doi: 10.1038/10230. [DOI] [PubMed] [Google Scholar]
- Corbetta M, Akbudak E, Conturo TE, Snyder AZ, Ollinger JM, Drury HA, et al. A common network of functional areas for attention and eye movements. Neuron. 1998;21(4):761–773. doi: 10.1016/s0896-6273(00)80593-0. [DOI] [PubMed] [Google Scholar]
- Corbetta M, Shulman GL. Control of goal-directed and stimulus-driven attention in the brain. Nat Rev Neurosci. 2002;3(3):201–215. doi: 10.1038/nrn755. [DOI] [PubMed] [Google Scholar]
- Curtis CE. Prefrontal and parietal contributions to spatial working memory. Neuroscience. 2006;139(1):173–180. doi: 10.1016/j.neuroscience.2005.04.070. [DOI] [PubMed] [Google Scholar]
- Curtis CE, Rao VY, D'Esposito M. Maintenance of spatial and motor codes during oculomotor delayed response tasks. J Neurosci. 2004;24(16):3944–3952. doi: 10.1523/JNEUROSCI.5640-03.2004. [DOI] [PMC free article] [PubMed] [Google Scholar]
- Dale AM. Optimal experimental design for event-related fMRI. Hum Brain Mapp. 1999;8(2–3):109–114. doi: 10.1002/(SICI)1097-0193(1999)8:2/3<109::AID-HBM7>3.0.CO;2-W. [DOI] [PMC free article] [PubMed] [Google Scholar]
- Efron B, Tibshirani RJ. An Introduction to the Bootstrap. 1993 [Google Scholar]
- Ekstrom LB, Roelfsema PR, Arsenault JT, Bonmassar G, Vanduffel W. Bottom-up dependent gating of frontal signals in early visual cortex. Science. 2008;321(5887):414–417. doi: 10.1126/science.1153276. [DOI] [PMC free article] [PubMed] [Google Scholar]
- Funahashi S, Bruce CJ, Goldman-Rakic PS. Mnemonic coding of visual space in the monkey's dorsolateral prefrontal cortex. J Neurophysiol. 1989;61(2):331–349. doi: 10.1152/jn.1989.61.2.331. [DOI] [PubMed] [Google Scholar]
- Gnadt JW, Andersen RA. Memory related motor planning activity in posterior parietal cortex of macaque. Exp Brain Res. 1988;70(1):216–220. doi: 10.1007/BF00271862. [DOI] [PubMed] [Google Scholar]
- Grosbras MH, Laird AR, Paus T. Cortical regions involved in eye movements, shifts of attention, and gaze perception. Hum Brain Mapp. 2005;25(1):140–154. doi: 10.1002/hbm.20145. [DOI] [PMC free article] [PubMed] [Google Scholar]
- Haenny PE, Maunsell JH, Schiller PH. State dependent activity in monkey visual cortex. II. Retinal and extraretinal factors in V4. Experimental Brain Research. 1988;69:245–259. doi: 10.1007/BF00247570. [DOI] [PubMed] [Google Scholar]
- Harrison SA, Tong F. Decoding reveals the contents of visual working memory in early visual areas. Nature. 2009;458(7238):632–635. doi: 10.1038/nature07832. [DOI] [PMC free article] [PubMed] [Google Scholar]
- Jenkinson M, Bannister P, Brady M, Smith S. Improved optimization for the robust and accurate linear registration and motion correction of brain images. Neuroimage. 2002;17(2):825–841. doi: 10.1016/s1053-8119(02)91132-8. [DOI] [PubMed] [Google Scholar]
- Kastner S, Pinsk MA, De Weerd P, Desimone R, Ungerleider LG. Increased activity in human visual cortex during directed attention in the absence of visual stimulation. Neuron. 1999;22(4):751–761. doi: 10.1016/s0896-6273(00)80734-5. [DOI] [PubMed] [Google Scholar]
- Lages M, Treisman M. Spatial frequency discrimination: Visual long-term memory or criterion setting? Vision Research. 1998;38(4):557–572. doi: 10.1016/s0042-6989(97)88333-2. [DOI] [PubMed] [Google Scholar]
- Larsson J. Unpublished PhD Thesis. Karolinska Institute; 2001. Imaging vision: Functional mapping of intermediate visual processes in man. [Google Scholar]
- Lauritzen TZ, D'Esposito M, Heeger DJ, Silver MA. Top-down flow of visual spatial attention signals from parietal to occipital cortex. Journal of Vision. 2009 doi: 10.1167/9.13.18. In Press. [DOI] [PMC free article] [PubMed] [Google Scholar]
- Lee DK, Itti L, Koch C, Braun J. Attention activates winner-take-all competition among visual filters. Nature Neuroscience. 1999;2:375–381. doi: 10.1038/7286. [DOI] [PubMed] [Google Scholar]
- Lee DK, Koch C, Braun J. Spatial vision thresholds in the near absence of attention. Vision Research. 1997;37(17):2409–2418. doi: 10.1016/s0042-6989(97)00055-2. [DOI] [PubMed] [Google Scholar]
- Leung HC, Gore JC, Goldman-Rakic PS. Sustained mnemonic response in the human middle frontal gyrus during on-line storage of spatial memoranda. J Cogn Neurosci. 2002;14(4):659–671. doi: 10.1162/08989290260045882. [DOI] [PubMed] [Google Scholar]
- Luck SJ, Chelazzi L, Hillyard SA, Desimone R. Neural mechanisms of spatial selective attention in areas V1, V2, and V4 of macaque visual cortex. J Neurophysiol. 1997;77(1):24–42. doi: 10.1152/jn.1997.77.1.24. [DOI] [PubMed] [Google Scholar]
- Luna B, Thulborn KR, Strojwas MH, McCurtain BJ, Berman RA, Genovese CR, et al. Dorsal cortical regions subserving visually guided saccades in humans: an fMRI study. Cereb Cortex. 1998;8(1):40–47. doi: 10.1093/cercor/8.1.40. [DOI] [PubMed] [Google Scholar]
- Magnussen S, Greenlee MW. Retention and disruption of motion information in visual short-term memory. J Exp Psychol Learn Mem Cogn. 1992;18(1):151–156. doi: 10.1037//0278-7393.18.1.151. [DOI] [PubMed] [Google Scholar]
- Magnussen S, Greenlee MW. The psychophysics of perceptual memory. Psychol Res. 1999;62(2–3):81–92. doi: 10.1007/s004260050043. [DOI] [PubMed] [Google Scholar]
- Magnussen S, Greenlee MW, Asplund R, Dyrnes S. Stimulus-specific mechanisms of visual short-term memory. Vision Res. 1991;31(7–8):1213–1219. doi: 10.1016/0042-6989(91)90046-8. [DOI] [PubMed] [Google Scholar]
- Magnussen S, Greenlee MW, Thomas JP. Parallel processing in visual short-term memory. J Exp Psychol Hum Percept Perform. 1996;22(1):202–212. doi: 10.1037//0096-1523.22.1.202. [DOI] [PubMed] [Google Scholar]
- McCarthy G, Blamire AM, Puce A, Nobre AC, Bloch G, Hyder F, et al. Functional magnetic resonance imaging of human prefrontal cortex activation during a spatial working memory task. Proc Natl Acad Sci U S A. 1994;91(18):8690–8694. doi: 10.1073/pnas.91.18.8690. [DOI] [PMC free article] [PubMed] [Google Scholar]
- McMains SA, Fehd HM, Emmanouil TA, Kastner S. Mechanisms of feature- and space-based attention: response modulation and baseline increases. J Neurophysiol. 2007;98(4):2110–2121. doi: 10.1152/jn.00538.2007. [DOI] [PubMed] [Google Scholar]
- Moore T, Armstrong KM. Selective gating of visual signals by microstimulation of frontal cortex. Nature. 2003;421(6921):370–373. doi: 10.1038/nature01341. [DOI] [PubMed] [Google Scholar]
- Moore T, Fallah M. Control of eye movements and spatial attention. Proc Natl Acad Sci U S A. 2001;98(3):1273–1276. doi: 10.1073/pnas.021549498. [DOI] [PMC free article] [PubMed] [Google Scholar]
- Nestares O, Heeger DJ. Robust multiresolution alignment of MRI brain volumes. Magn Reson Med. 2000;43(5):705–715. doi: 10.1002/(sici)1522-2594(200005)43:5<705::aid-mrm13>3.0.co;2-r. [DOI] [PubMed] [Google Scholar]
- Nichols T, Hayasaka S. Controlling the familywise error rate in functional neuroimaging: a comparative review. Stat Methods Med Res. 2003;12(5):419–446. doi: 10.1191/0962280203sm341ra. [DOI] [PubMed] [Google Scholar]
- Offen S, Schluppeck D, Heeger DJ. The role of early visual cortex in visual short-term memory and visual attention. Vision Res. 2009;49(10):1352–1362. doi: 10.1016/j.visres.2007.12.022. [DOI] [PMC free article] [PubMed] [Google Scholar]
- Pessoa L, Gutierrez E, Bandettini P, Ungerleider L. Neural correlates of visual working memory: fMRI amplitude predicts task performance. Neuron. 2002;35(5):975–987. doi: 10.1016/s0896-6273(02)00817-6. [DOI] [PubMed] [Google Scholar]
- Petit L, Clark VP, Ingeholm J, Haxby JV. Dissociation of saccade-related and pursuit-related activation in human frontal eye fields as revealed by fMRI. J Neurophysiol. 1997;77(6):3386–3390. doi: 10.1152/jn.1997.77.6.3386. [DOI] [PubMed] [Google Scholar]
- Purdon P, Weisskoff R. Effect of temporal autocorrelation due to physiological noise and stimulus paradigm on voxel-level false-positive rates in fMRI. Human Brain Mapping. 1998;6:239–249. doi: 10.1002/(SICI)1097-0193(1998)6:4<239::AID-HBM4>3.0.CO;2-4. [DOI] [PMC free article] [PubMed] [Google Scholar]
- Raz J, Zheng H, Ombao H, Turetsky B. Statistical tests for fMRI based on experimental randomization. Neuroimage. 2003;19(2 Pt 1):226–232. doi: 10.1016/s1053-8119(03)00115-0. [DOI] [PubMed] [Google Scholar]
- Ress D, Backus BT, Heeger DJ. Activity in primary visual cortex predicts performance in a visual detection task. Nat Neurosci. 2000;3(9):940–945. doi: 10.1038/78856. [DOI] [PubMed] [Google Scholar]
- Reynolds JH, Pasternak T, Desimone R. Attention increases sensitivity of V4 neurons. Neuron. 2000;26(3):703–714. doi: 10.1016/s0896-6273(00)81206-4. [DOI] [PubMed] [Google Scholar]
- Sakai K, Rowe JB, Passingham RE. Active maintenance in prefrontal area 46 creates distractor-resistant memory. Nat Neurosci. 2002;5(5):479–484. doi: 10.1038/nn846. [DOI] [PubMed] [Google Scholar]
- Schluppeck D, Curtis CE, Glimcher PW, Heeger DJ. Sustained activity in topographic areas of human posterior parietal cortex during memory-guided saccades. Journal of Neuroscience. 2006;26(19):5098–5108. doi: 10.1523/JNEUROSCI.5330-05.2006. [DOI] [PMC free article] [PubMed] [Google Scholar]
- Schluppeck D, Glimcher P, Heeger DJ. Topographic organization for delayed saccades in human posterior parietal cortex. J Neurophysiol. 2005;94(2):1372–1384. doi: 10.1152/jn.01290.2004. [DOI] [PMC free article] [PubMed] [Google Scholar]
- Serences JT, Ester EF, Vogel EK, Awh E. Stimulus-specific delay activity in human primary visual cortex. Psychol Sci. 2009;20(2):207–214. doi: 10.1111/j.1467-9280.2009.02276.x. [DOI] [PMC free article] [PubMed] [Google Scholar]
- Silver MA, Ress D, Heeger DJ. Topographic maps of visual spatial attention in human parietal cortex. J Neurophysiol. 2005;94(2):1358–1371. doi: 10.1152/jn.01316.2004. [DOI] [PMC free article] [PubMed] [Google Scholar]
- Silver MA, Ress D, Heeger DJ. Neural correlates of sustained spatial attention in human early visual cortex. J Neurophysiol. 2007;97(1):229–237. doi: 10.1152/jn.00677.2006. [DOI] [PMC free article] [PubMed] [Google Scholar]
- Smith A, Lewis B, Ruttimann U, Ye F, Sinnwell T, Yang Y, et al. Investigation of low frequency drift in fMRI signal. Neuroimage. 1999;9:526–533. doi: 10.1006/nimg.1999.0435. [DOI] [PubMed] [Google Scholar]
- Sommer MA, Wurtz RH. Frontal eye field sends delay activity related to movement, memory, and vision to the superior colliculus. J Neurophysiol. 2001;85(4):1673–1685. doi: 10.1152/jn.2001.85.4.1673. [DOI] [PubMed] [Google Scholar]
- Sperling G, Melchner MJ. The attention operating characteristic: examples from visual search. Science. 1978;202(4365):315–318. doi: 10.1126/science.694536. [DOI] [PubMed] [Google Scholar]
- Srimal R, Curtis CE. Persistent neural activity during the maintenance of spatial position in working memory. Neuroimage. 2008;39(1):455–468. doi: 10.1016/j.neuroimage.2007.08.040. [DOI] [PMC free article] [PubMed] [Google Scholar]
- Umeno MM, Goldberg ME. Spatial processing in the monkey frontal eye field. II. Memory responses. J Neurophysiol. 2001;86(5):2344–2352. doi: 10.1152/jn.2001.86.5.2344. [DOI] [PubMed] [Google Scholar]
- Xu Y, Chun MM. Dissociable neural mechanisms supporting visual short-term memory for objects. Nature. 2006;440(7080):91–95. doi: 10.1038/nature04262. [DOI] [PubMed] [Google Scholar]
- Zarahn E, Aguirre G, D'Esposito M. A trial-based experimental design for fMRI. Neuroimage. 1997;6(2):122–138. doi: 10.1006/nimg.1997.0279. [DOI] [PubMed] [Google Scholar]
- Zarahn E, Aguirre G, D'Esposito M. Replication and further studies of neural mechanisms of spatial mnemonic processing in humans. Brain Res Cogn Brain Res. 2000;9(1):1–17. doi: 10.1016/s0926-6410(99)00033-6. [DOI] [PubMed] [Google Scholar]
- Zarahn E, Aguirre GK, D'Esposito M. Temporal isolation of the neural correlates of spatial mnemonic processing with fMRI. Brain Res Cogn Brain Res. 1999;7(3):255–268. doi: 10.1016/s0926-6410(98)00029-9. [DOI] [PubMed] [Google Scholar]