

Abstract
Offspring of women with diabetes during pregnancy are at increased risk of accelerated weight gain and diabetes, effects partly mediated by the in utero environment. Whether differences in energy intake can explain this increased risk is unknown. We compared diet composition, eating patterns, and physiological responses to a mixed meal in 63 nondiabetic children whose mothers developed diabetes either before (offspring of diabetic mothers, ODMs, n = 31, age 9.2 ± 1.7 years, mean ± s.d.) or after (offspring of prediabetic mothers, OPDMs, n = 32, 9.6 ± 1.3 years) the pregnancy. After consuming a standardized diet for 3 days, participants ate ad libitum from a computer-operated vending machine stocked with foods they had rated favorably on a food preferences questionnaire. Mothers and children always ate together. A subset of 35 children underwent a meal test with blood draws to measure insulin and glucose. Children’s energy intake was associated with age, sex, and percent body fat, and strongly with mother’s energy intake (r = 0.57, P < 0.0001). After adjustment for these variables, there were no differences between ODM and OPDM in energy intake or diet composition. The insulin area under the curve (AUC) following the meal test was significantly correlated with total energy intake but not after adjustment for the above covariates. Differences in energy intake were not observed between ODM and OPDM. Mother’s energy intake was a significant predictor of children’s energy intake. These findings indicate that in this subset of children in a controlled in-patient setting, maternal influence may outweigh intrauterine effects on energy intake.
INTRODUCTION
Type 2 diabetes and obesity are caused by a combination of genetic and environmental factors. Recent work in a number of populations suggests that the environment experienced in early life may be of particular importance in increasing the risk of these disorders, with early influences leading to lifelong increases in the risk of disease. The most powerful early environmental factor yet described is exposure to maternal diabetes in utero. Children whose mothers had diabetes during the pregnancy have an unusually high rate of obesity (1) and type 2 diabetes (2) in later life. Exposure to maternal diabetes in utero was found to confer a 10-fold increase in the risk of diabetes in children between the ages of 5 and 19 years, acting as the single strongest predictor of type 2 diabetes in Pima Indian children (3).
While the offspring of diabetic mothers (ODMs) might be expected to inherit genes predisposing them to both diabetes and obesity, evidence suggests that a genetic predisposition does not explain all the increased risk. Offspring of fathers who developed diabetes early in life do not have the same increase in the risk of diabetes (2) or obesity (4) as the offspring of mothers with diabetes. Moreover, studies of siblings born before and after their mother developed diabetes confirm the importance of the diabetic intrauterine environment, beyond genetic factors, in increasing the risk of diabetes and obesity later in life (5). Such effects on obesity and diabetes are not observed in the offspring of fathers born before or after diagnosis of diabetes (5).
The development of obesity depends upon an imbalance between energy intake and energy expenditure. However, Salbe and colleagues (6) observed no differences in total energy expenditure, resting energy expenditure, or physical activity levels between 5-year old children born to women with and without type 2 diabetes during the pregnancy, despite a higher birth weight in the former group. These results suggest that maternal diabetes does not influence energy expenditure in the children at least through age 5 and lead to the hypothesis that excess adiposity observed in the ODMs may arise secondary to increased energy intake.
The concept that maternal diabetes during pregnancy might alter appetite and energy intake in the offspring has not been examined in humans. There is support for this notion from a limited number of animal studies where high glucose levels in dams during pregnancy have been associated with alterations in morphology and neurotransmitters in the hypothalamic centers involved in appetite regulation (7).
Thus, the primary aim of this study was to examine whether energy intake and diet composition are altered by exposure to maternal diabetes in utero. We compared anthropometric characteristics, energy intake, and macronutrient composition in nondiabetic children (fasting plasma glucose range, 76–106 mg/dl) whose mothers developed diabetes either before or after the pregnancy of interest.
METHODS AND PROCEDURES
Subjects
During the summer months of 2001–2004, 63 Pima Indian children (29 boys/34 girls) aged 7–11 years whose mothers developed diabetes either before ODMs or after (offspring of prediabetic mothers, OPDMs) the pregnancy of interest were studied. Their mothers (n = 63), aged 24–49 years, also participated. No siblings were included in this study in order to avoid sibship as a confounding factor. History of diagnosis of diabetes and diabetes status during the pregnancy of interest were verified from medical records of the mother before, during, and after the pregnancy and the birth medical record of the child. Maternal diabetes was determined by World Health Organization criteria, either before or during the third trimester of pregnancy. Mothers determined to have type 2 diabetes during the pregnancy were diagnosed by 75 g oral glucose-tolerance test results and had a 2-h glucose concentration of ≥200 mg/dl prior to or during the index pregnancy, or had a clinical diagnosis of type 2 diabetes documented in the medical record prior to the index pregnancy. Mothers determined to be free of type 2 diabetes during the pregnancy underwent either a 75 or 100 g oral glucose-tolerance test during the pregnancy to rule out diabetes and a nondiabetic oral glucose-tolerance test following the pregnancy.
Children and their mothers were admitted to the Clinical Research Unit of the National Institute of Diabetes and Digestive and Kidney Diseases in Phoenix, Arizona for a 1-week stay. Prior to participation, all subjects were screened by medical history, physical examination, and laboratory tests and were found to be healthy. Only nondiabetic children (according to fasting plasma glucose in the range of 76–106 mg/dl) were studied. Body weight was measured daily. All meals were prepared in a metabolic kitchen on the unit. Before participation, volunteers and their parents were fully informed of the nature and purpose of the study, and written informed consent/assent was obtained. The protocol was approved by the institutional review boards of the National Institute of Diabetes and Digestive and Kidney Diseases, the Intertribal Council of Arizona, the Phoenix Area Indian Health Service, and the Gila River Indian Community Council.
Experimental procedures
Upon admission to the metabolic ward, volunteers were fed a standard weight maintaining diet (20, 30, and 50% of daily calories provided as protein, fat, and carbohydrate, respectively) for 3 days prior to the metabolic testing. Weight maintenance energy needs (WMEN) on the metabolic ward were calculated for each subject based on weight and sex (boys: WMEN = 9.5 × weight (kg) + 1,973; girls: WMEN = 9.5 × weight (kg) + 1,745 (ref. 8). Body composition was measured by dual-energy X-ray absorptiometry (DPX-L; Lunar, Madison, WI).
Mixed-meal test
All participants were invited to participate in a mixed-meal challenge. Of those who agreed to participate, 35 (19 ODM, 16 OPDM) had adequate venous access and were, therefore, able to complete the test. After consuming a standardized diet for 2 days, followed by an overnight fast, an intravenous catheter was placed in an antecubital vein for blood sampling and kept patent with a 0.9% saline infusion. At ~7:30 am, subjects were fed a mixed-meal breakfast (consisting of a bacon-and-egg sandwich on toast accompanied by orange juice) containing 10% of calories from protein, 45% from fat, and 45% from carbohydrates and providing ~20% of the daily energy requirements for each child. The meal was consumed within 15 min and subjects rested quietly in bed throughout the study. Blood samples for insulin, glucose, and cortisol were drawn prior to and 15, 30, and 60 min after initiation of the meal test.
Analytical procedures
Samples were kept on ice and centrifuged at 4 °C within several minutes of collection. Plasma glucose concentrations were measured by the glucose oxidase method (Beckman Instruments, Fullerton, CA). All other samples were frozen and stored at −20 °C until assayed. Plasma insulin concentrations were measured by automated radioimmunoassay (Concept 4 ICN Biochemicals, Costa Mesa, CA; (intra-assay coefficient of variation = 2.0 (%), interassay = 3.5)) and plasma cortisol concentrations were measured by radioimmunoassay (Linco Research, St Louis, MO; (intra-assay coefficient of variation = 6.0, interassay = 13.4)).
Anthropometrics
Height was measured without shoes. Body weight was measured while the participants were wearing a preweighed robe. Measures and estimations of adiposity included assessment of percent body fat using dual-energy X-ray absorptiometry, calculation of BMI (kg/m2) and BMI z scores.
Assessment of food preferences
After admission to the metabolic ward, subjects completed an 80-item food preferences questionnaire containing typical breakfast, lunch, dinner, and snack items as previously described (9). Briefly, foods were categorized as being high (>45% kcal) or low (<20% kcal) in fat and within each of these categories, high in simple sugar (>30% kcal), complex carbohydrate (>30% kcal), or protein (>13% kcal) (10). Individuals were asked to assign each food a hedonic rating using a 9-point Likert scale with the following anchors: 1 = dislike extremely, 5 = neutral, 9 = like extremely; an option to indicate that the food item had never been tasted was also included. Both the mothers and children completed the questionnaire; mothers were allowed to assist the children as needed.
Ad libitum energy intake using a computerized vending machine system
During the final day, day 3, of study on the metabolic ward, subjects were asked to self-select all their food using a computer-operated vending machine system as previously described (9,11). Forty food items that subjects had rated favorably on the food preferences questionnaire were made available on each of the 3 days. In addition, a core group of condiments, beverages, breads, and spreads were provided to each subject each day. Mothers were advised that while the vending machines were available ad libitum for 23½ h/day, access for the children was at their discretion. Mothers and children always ate together. However, mother and child were provided with different food codes to access the vending machines and were asked not to eat each other’s food. Participants were asked to eat as they wanted, and no attempt was made to have the child take a greater part in food choices than usual. The refrigerated machines were housed in a separate eating area, and subjects were instructed to eat only in the vending room, to eat whatever they wished whenever they desired. Television viewing during food consumption was prohibited.
Daily energy, protein, fat, and carbohydrate intakes were calculated from the actual weights of food and condiments consumed using the CBORD Professional Diet Analyzer Program (CBORD, Ithaca, NY) with the data base modified to reflect the nutrient content of specific food items as indicated by the manufacturer. Daily energy intake is expressed as mean kcal/day and mean percentage of WMEN (calculated as (mean daily energy Intake/WMEN) × 100). Results are presented as the mean ± s.d. of the 3 days.
Statistical methods
Statistical analyses were performed using SAS software (SAS version 8.2, 1999–2001; SAS Institute, Cary, NC). Data are expressed as the mean ± s.d. The t tests were used to compare differences in energy intake data between the groups of mothers: those who had onset of diabetes prior to (diabetic mothers, DMs) vs. after their pregnancies (prediabetic mothers, PDMs). For the children, general linear regression models were used to assess differences in anthropometric and metabolic characteristics as a result of maternal diabetes status as well as to evaluate other possible determinants of energy intake during the vending machine session. Body weight, sex, and age were correlated with energy intake and were, therefore, entered into the model as covariates in linear regression analyses (general linear regression model) in which the intake (energy intake, caloric intake from soda consumption, percent macronutrient intake, and % WMEN) and hormone (baseline and area under the curve (AUC) values) measurements were the dependent variables. The interaction effect between sex and maternal diabetes status in utero (ODM or OPDM) was also examined. Pearson’s correlation coefficients were used to describe relationships between continuous variables and χ2 was used for categorical data. Levels of statistical significance were set at P < 0.05.
RESULTS
Participant characteristics
Of the original 66 mother–child pairs, 3 pairs did not complete the 3-day vending machine study and were excluded from the final analysis. There were no significant differences in demographic and metabolic characteristics (age, BMI, percent body fat) between those who completed the study and those who did not. Subject characteristics for the remaining 126 subjects (63 mother–child pairs) are shown in Tables 1 and 2. The mothers ranged in age from 24 to 49 years (37.9 ± 6.8 years, mean ± s.d.) and had a mean BMI of 38.1 kg/m2 (s.d. = 8.5, range 23–55). Those with diabetes during the pregnancy were older than those who developed diabetes after their pregnancy, but there were no differences between the maternal groups in percent body fat, BMI, or other anthropometric characteristics (Table 1).
Table 1.
Anthropometric, metabolic and energy intake characteristics of mothers
| Diabetic mothers | Prediabetic mothers | P value | |
|---|---|---|---|
| Age (years)a | 40.9 ± 5.4 | 35.1 ± 6.9 | 0.0005 |
| Body weight (kg) | 99 ± 29 | 98 ± 16 | 0.86 |
| Height (cm) | 160 ± 6 | 159 ± 5 | 0.54 |
| BMI (kg/m2) | 38.3 ± 9.4 | 38.7 ± 6.7 | 0.82 |
| Body fat (%)a | 48.2 ± 5.7 | 50.0 ± 4.7 | 0.19 |
| Mean energy intake (kcal) | 3,081 ± 1,032 | 3,567 ± 680 | 0.03 |
| CHO intake (% kcal) | 48 ± 5 | 50 ± 5 | 0.17 |
| PRO intake (% kcal) | 13 ± 2 | 13 ± 1 | 0.13 |
| Fat intake (% kcal) | 39 ± 4 | 38 ± 5 | 0.59 |
| Energy intake from soda (kcal)a | 62 ± 140 | 189 ± 235 | 0.01 |
CHO, carbohydrate; PRO, protein.
Assessed using dual-energy X-ray absorptiometry.
Table 2.
Demographic, metabolic and energy intake calculations by ODMs (offspring of diabetic mothers) and OPDMs (offspring of prediabetic mothers) status and by Sexa
| ODM (n = 31)b |
OPDM (n = 32)b |
|||||
|---|---|---|---|---|---|---|
| Boys | Girls | Overall | Girls | Boys | Overall | |
| Age (years) | 8.9 ± 1.4 | 9.4 ± 1.2 | 9.2 ± 1.2 | 9.8 ± 1.4 | 9.5 ± 1.2 | 9.6 ± 1.3 |
| Body weight (kg) | 54 ± 19 | 49 ± 19 | 58 ± 19 | 51 ± 18 | 51 ± 19 | 57 ± 17 |
| Height (cm) | 141 ± 13 | 138 ± 8 | 139 ± 10 | 142 ± 13 | 140 ± 7 | 141 ± 10 |
| BMI (kg/m2) | 26 ± 7 | 25 ± 8 | 26 ± 7 | 24 ± 5 | 25 ± 7 | 25 ± 6 |
| BMI z scorec | 1.9 ± 1.1 | 1.7 ± 1.1 | 1.7 ± 1 | 1.6 ± 0.8 | 1.7 ± 1.1 | 1.7 ± 1 |
| BMI for age % | 97 | 96 | 96 | 95 | 96 | 96 |
| Weight classification: overweight (N (%)) | 9 (82) | 13 (68) | 22 (73) | 9 (60) | 11 (65) | 20 (62) |
| At risk | 0 | 1 (5) | 1 (3) | 4 (27) | 2 (12) | 6 (19) |
| Normal weight | 2 (18) | 5 (26) | 7 (23) | 2 (13) | 4 (24) | 6 (19) |
| Body fatd (%) | 40 ± 11 | 42 ± 11 | 41 ± 11 | 41 ± 8 | 40 ± 11 | 40 ± 9 |
| Mean energy intake (kcal) | 3,542 ± 1,093 | 3,294 ± 923 | 3,382 ± 976 | 3,478 ± 939 | 3,753 ± 776 | 3,667 ± 858 |
| Mean energy intake (%WMEN) | 142 ± 35 | 143 ± 36 | 142 ± 35 | 151 ± 33 | 154 ± 29 | 153 ± 30 |
| CHO intake (% kcal) | 50 ± 4 | 52 ± 6 | 52 ± 6 | 54 ± 5 | 52 ± 6 | 53 ± 5 |
| PRO intake (% kcal) | 12 ± 1 | 11 ± 2 | 12 ± 2 | 12 ± 2 | 12 ± 2 | 12 ± 2 |
| Fat intake (% kcal) | 39 ± 5 | 37 ± 5 | 40 ± 5 | 36 ± 5 | 38 ± 5 | 39 ± 5 |
| Energy intake from soda (kcal) | 201 ± 201 | 191 ± 185 | 194 ± 188* | 274 ± 196 | 380 ± 180 | 334 ± 189* |
| Fasting insulin (μIU/ml)e | 37 ± 13 | 37 ± 13 | 37 ± 13 | 34 ± 8 | 34 ± 15 | 34 ± 13 |
| AUC insulin (μIU/ml)e | 119 ± 16 | 114 ± 12 | 116 ± 10 | 122 ± 7 | 119 ± 10 | 120 ± 7 |
| Fasting glucose (mmol/l)e | 5.1 ± 0.33 | 4.8 ± 0.44 | 89 ± 6 | 4.8 ± 0.28 | 5.0 ± 0.33 | 89 ± 5 |
| AUC glucose (mmol/l)e | 364.3 ± 35.3 | 358.1 ± 42 | 6,474 ± 711 | 358.7 ± 17.2 | 368.2 ± 31.6 | 6,573 ± 498 |
| Fasting cortisole (μg/dl) | 13 ± 3 | 17 ± 9 | 16 ± 8 | 13 ± 3 | 15 ± 5 | 14 ± 5 |
| AUC cortisole (μg/dl) | 642 ± 97 | 892 ± 264 | 827 ± 255 | 867 ± 279 | 771 ± 260 | 801 ± 261 |
AUC, area under the curve; CHO, carbohydrate; PRO, protein; WMEN, weight maintenance energy needs.
Data are expressed as unadjusted means ± s.d.
There were no significant differences between the ODM and OPDM groups on any variable except for soda intake or between boys and girls.
Calculated using the 2000 Centers for Disease Control and Prevention growth charts.
Assessed using dual-energy X-ray absorptiometry.
n = 35 (19 ODM, 16 OPDM).
P = 0.004.
Thirty-one of the children were ODM and 32 were OPDM. The t tests and χ2 analyses revealed no significant differences in sex distribution (ODM: 11 boys/20 girls vs. OPDM: 18 boys/14 girls; P = 0.10), age (ODM: 9.2 ± 1.2 years vs. OPDM: 9.6 ± 1.3 years, P = 0.27), or anthropometry between the groups. After adjustment for age and sex, BMI was not significantly different in ODM vs. OPDM (26.3 vs. 24.1 kg/m2, P = 0.18). The majority of the children were classified as overweight; the proportion classified as overweight, at risk for overweight, and normal weight did not differ between ODM and OPDM groups (P = 0.16) (Table 2).
Energy intake
Table 2 lists the intake data by ODM and OPDM groups and by sex. Adjusted for the significant confounders described previously (sex, age, and body weight), the mean difference in energy intake between ODM and OPDM was −147 kcal (−522, 229 (95% confidence interval), P = 0.44). Both before and after adjustment for age and body weight, there were no significant differences in energy intake between boys and girls. Although paired t tests indicated energy intake was lower on day 3 than on day 1 (mean difference 363 kcal, P = 0.003), total energy intake per day over the 3 days of study did not differ between the groups, nor did the percentage of daily calories from fat, carbohydrate, and protein. On average, the children consumed 47.5% above their estimated WMEN, and this did not differ between OPDM and ODM. There were no significant differences in any of the intake variables between ODM and OPDM, or between boys and girls nor was the interaction term for sex × ODM/OPDM groups significant. The metabolic and intake data were similar both before and after adjusting for the aforementioned covariates; therefore, only the unadjusted means are presented in Table 2.
Mother/child energy intake relationship
Compared with the mothers with diabetes during the pregnancy, the mothers who developed diabetes after the pregnancy had greater mean intakes of total energy (P = 0.03), calories from carbohydrate (P = 0.03), and calories from soda (P = 0.01), but neither mean fat nor mean protein intake differed between the groups (Table 1). Moreover, the mean percentage of daily calories from fat, carbohydrate, and protein did not differ between the groups. Because those with diabetes during the pregnancy were older than those who developed diabetes after their pregnancy, we conducted general linear regression model analyses with age as a covariate, and there were no differences in the results, indicating that age was not a contributing factor to the observed differences in energy and macronutrient intake.
We observed a significant, positive correlation between the child’s mean energy intake across the 3 days and that of the respective mother (r = 0.57, P < 0.0001) (Figure 1). In addition, the macronutrient content of the child’s diet (mean fat (r = 0.58), mean carbohydrate (r = 0.42), and mean protein (r = 0.59, all P < 0.0001)) was highly correlated with that of the mother. Mean intake from five of the six categories of food (low fat/high carbohydrate, low fat/high simple sugar, high fat/high carbohydrate, high fat/high protein, high fat/high simple sugar) were significantly correlated (r = 0.36 – 0.47, all P < 0.03) between mother and child with the exception of high-protein/low-fat items. Surprisingly, mean energy from soda was not correlated between mothers and children. When added to the models comparing energy intake between ODM and OPDM, mother’s energy intake was a significant predictor (F = 23.66, P < 0.0001) of childhood energy intake, but there was still no difference in energy intake between the groups (−193 kcal (−641, 257; 95% confidence interval)).
Figure 1.
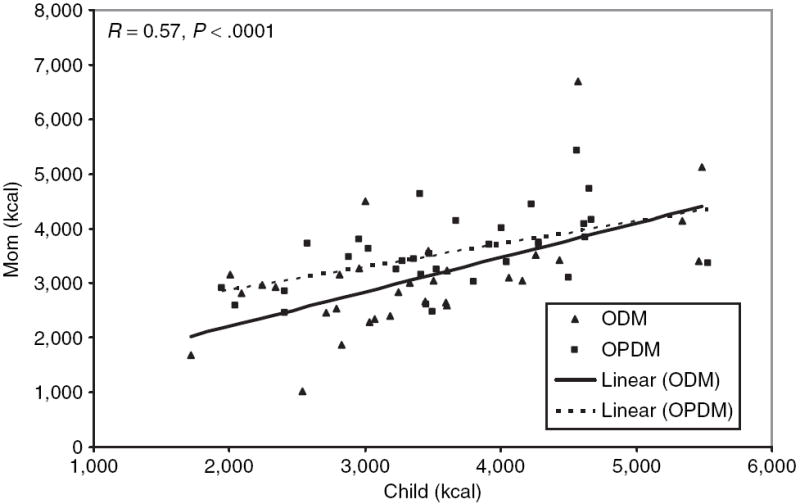
Relationship between mother and child energy intake. kcal/day = mean kilocalories over 3-day period while consuming food chosen ad libitum from the vending machines. ODM (black triangles) = children of mothers who developed diabetes before the pregnancy of interest. OPDM (black squares) = children of mothers who developed diabetes after the pregnancy of interest. R = Spearman correlation. ODMs, offspring of diabetic mothers; OPDMs, offspring of prediabetic mothers.
Hormones
The meal test was conducted on a subset of 35 children. Using regression models adjusted for age, sex, and body weight, neither fasting values, nor AUC for insulin, glucose, or cortisol differed between ODM and OPDM. Mean energy, carbohydrate, fat, and protein intakes, but not energy intake from soda, were significantly correlated with fasting insulin (all P < 0.003), but not with fasting glucose or cortisol. Mean energy intake was significantly correlated with AUC insulin (r = 0.47, P = 0.01), but not with AUC glucose (r = 0.29, P = 0.09) or with AUC cortisol (r = −0.30, P = 0.07). Percentage of calories consumed above the estimated WMEN was significantly correlated with both fasting insulin (r = 0.45, P = 0.003) and AUC insulin (r = 0.44, P = 0.02). Intake of all macronutrients was significantly correlated with AUC insulin but not with glucose or cortisol. Mean calories consumed as soda were not correlated with any hormone measurement. When entered as covariates into the model (adjusted for age, sex, and body weight), AUC insulin, AUC glucose, and AUC cortisol were no longer significant predictors of any intake variable.
Weight change during the 3-day vending machine sessions
Over the 3 days of the vending machine study, the mean change in weight of the children was 0. 83 kg (±1.5). In all, 79% gained weight, 17% lost weight, and 3% maintained their weight. In a regression model adjusted for age, sex, and body weight, ODM were not more likely than OPDM to gain weight, and the amount of weight change did not differ between the groups. Surprisingly, weight gain was only modestly correlated with percent of calories consumed above the estimated WMEN (r = 0.26, P = 0.06). There was a trend toward a positive correlation between weight gain and fasting insulin (r = 0.28, P = 0.09) and AUC glucose (r = 0.34, P = 0.07). In contrast, AUC insulin, AUC glucose, and AUC cortisol were not significant determinants of weight change.
DISCUSSION
Contrary to our hypothesis, we did not observe that energy intake was higher in the offspring of mothers with diabetes than in those born to mothers who developed diabetes after the pregnancy. Energy intake was associated with age, body composition, and maternal energy intake, but not with any other metabolic variables independent of body size. Mothers with diabetes during the pregnancy ate less than those who developed diabetes following the pregnancy. Energy intake between ODM and OPDM was not different even after adjustment for maternal energy intake, although maternal energy intake remained a significant determinant of childhood energy intake even after adjustment for other confounders.
Our hypothesis of increased energy intake was supported by a limited number of studies in rats. High glucose concentrations in dams during pregnancy have been associated with alterations in offspring’s morphology and neurotransmitters in hypothalamic centers involved in the regulation of appetite (7). In addition, hyperinsulinism, as a result of either the intrauterine environment or early postnatal overfeeding, may lead to a “malprogramming” of the neuroendocrine system. This reorganization of the very system that modulates body weight and energy intake has been hypothesized to increase the risk of developing hyperphagia, with obesity and increased diabetic risk, in later life (12). Treatment of gestational diabetes and normalization of gestational hyperglycemia, however, could prevent these future hypothalamic neuropeptidergic alterations (13).
Previous studies have observed excessive obesity in children with intrauterine exposure to diabetes (1,14,15); however, in this study, there were no significant differences in body weight, BMI, or percent body fat between exposed and nonexposed groups. This was surprising in light of earlier findings of differences in adiposity in children aged 5–9 years even with normal birth weight. This lack of comparability between subjects of the present study and those in the larger population study is a limitation of the study. There are several possible explanations for this lack of difference. First, the attention to type 2 diabetes management in pregnancy might have diminished the differences in adiposity, coupled with secular changes in weight in the OPDM children. Because a larger proportion of Pima Indian children are obese (16), the gap between expected observances of differences in adiposity may be closing. However, a more likely explanation is that the risk to ODM for development of type 2 diabetes is known in the community, and some mothers may, therefore, be more proactive in controlling energy intake and weight. In turn, those mothers may have been more interested in participating in our study. Indeed in support of this the BMI difference between ODM and OPDM observed in our study is less pronounced (26.3 vs. 24.1 kg/m2, P = 0.18) than in the same-aged children seen during the same time period in the longitudinal study of health in this population (28.2 vs. 23.2 kg/m2, P = 0.0009). This may also explain the lower calorie intake among mothers with diabetes during the pregnancy and hence the lack of difference between the two groups of children.
The strongest finding in our study was that energy intake in the children was highly correlated with the mothers’ energy intake, regardless of mother’s diabetes status during pregnancy. This was true not only for total caloric intake, but also for macronutrient content. Further adjustment for maternal energy intake still did not result in the detection of a difference in calorie intake between ODM and OPDM. This indicates that for energy intake, the intrauterine environment does not have as much of an impact as does the postnatal maternal influence. This was true at least in the enclosed setting of our unit, although mothers were instructed to allow the children to select their own foods.
While adjustment for maternal calorie intake did not reveal any differences in energy intake between the groups, it is interesting that mothers with diabetes during the pregnancy ate significantly less (despite no differences in body size or influence of age) than those who developed diabetes after the pregnancy. Because of the strong correlation between mothers and children’s intake and because they always ate together, the lower energy intake in the ODM mothers (possibly reflecting greater dietary restraint on their part) likely led to lower energy intake in their children, thereby attenuating any possible differences between the groups. Measurement of eating restraint scores may have allowed us to investigate this; unfortunately, this parameter was not assessed as part of this study. Despite this limitation, it is worth noting that parents also influence their children’s meals in the home environment because mothers typically select their children’s food because they do the grocery shopping and meal preparation. Thus, while the mother’s influence on food selection of the child is a limitation of this study, it is also likely that we, to some extent, were able to accurately replicate what occurs in the home environment. Hence, it is very possible that intrauterine influence on eating behavior can be superseded by increased parental nutritional education and modest parental control.
There are several additional limitations to our study. Given the similar BMIs of the two groups of mothers, it is likely that there was substantial insulin resistance in both groups. This, combined with greater attention to diabetes management in pregnancy might have resulted in a similar intrauterine environment for the children. Because the foods made available were tailored to the participant’s food preferences and thus differed between families, this variability may have affected their energy intakes. However, as described, all subjects received typical breakfast, lunch, dinner, and snack food items that were categorized according to a macronutrient self-selection paradigm that varied the fat content (high or low) of foods as a percentage of calories systematically with other macronutrients (high in simple sugar, complex carbohydrate, or protein). So while the specific food items differed, they all fell into the same broader macronutrient categories.
A final limitation in regard to the maternal influence on the child’s food selection should be mentioned. A recent review (17) on the effects of parenting on children’s eating and weight status found considerable evidence for the influence of parenting practices (e.g., pressure, restriction, and modeling) on child eating behaviors. Therefore, it is certain that the presence of mothers during all meals affected both the types and the amounts of foods children ate. This effect may have been strong enough to overcome any in utero effect. To better differentiate children’s eating behavior from maternal influences, children and their mothers should be studied separately in future studies.
In conclusion, in this in-patient setting, we did not observe differences in energy intake in 7-to 11-year-old offspring of mothers with diabetes compared with offspring whose mothers developed diabetes after the pregnancy of interest. Thus, using the current study design we could not assess differences in energy intake by intrauterine environment.
Acknowledgments
We thank Antonio Tataranni for his help and guidance in designing and implementing the study. We also thank John Graves and the dietary staff and Carol Massengill and the nursing staff of the National Institutes of Health (NIH) Clinical Unit and the staff of the Diabetes Epidemiology and Clinical Research Section, National Institute of Diabetes and Digestive and Kidney Diseases (NIDDK), for ascertaining the children and collecting the maternal data. This study was supported by the Intramural Research Program of the NIH, NIDDK. Most of all, we thank the volunteers for their participation in the study.
Footnotes
DISCLOSURE The authors declared no conflict of interest.
References
- 1.Pettitt DJ, Baird HR, Aleck KA, Bennett PH, Knowler WC. Excessive obesity in offspring of Pima Indian women with diabetes during pregnancy. N Engl J Med. 1983;308:242–245. doi: 10.1056/NEJM198302033080502. [DOI] [PubMed] [Google Scholar]
- 2.Pettitt DJ, Aleck KA, Baird HR, et al. Congenital susceptibility to NIDDM. Role of intrauterine environment. Diabetes. 1988;37:622–628. doi: 10.2337/diab.37.5.622. [DOI] [PubMed] [Google Scholar]
- 3.Dabelea D, Hanson RL, Bennett PH, et al. Increasing prevalence of Type II diabetes in American Indian children. Diabetologia. 1998;41:904–910. doi: 10.1007/s001250051006. [DOI] [PubMed] [Google Scholar]
- 4.Lindsay RS, Dabelea D, Roumain J, et al. Type 2 diabetes and low birth weight: the role of paternal inheritance in the association of low birth weight and diabetes. Diabetes. 2000;49:445–449. doi: 10.2337/diabetes.49.3.445. [DOI] [PubMed] [Google Scholar]
- 5.Dabelea D, Hanson RL, Lindsay RS, et al. Intrauterine exposure to diabetes conveys risks for type 2 diabetes and obesity: a study of discordant sibships. Diabetes. 2000;49:2208–2211. doi: 10.2337/diabetes.49.12.2208. [DOI] [PubMed] [Google Scholar]
- 6.Salbe AD, Fontvieille AM, Pettitt DJ, Ravussin E. Maternal diabetes status does not influence energy expenditure or physical activity in 5-year-old Pima Indian children. Diabetologia. 1998;41:1157–1162. doi: 10.1007/s001250051045. [DOI] [PubMed] [Google Scholar]
- 7.Plagemann A, Harder T, Janert U, et al. Malformations of hypothalamic nuclei in hyperinsulinemic offspring of rats with gestational diabetes. Dev Neurosci. 1999;21:58–67. doi: 10.1159/000017367. [DOI] [PubMed] [Google Scholar]
- 8.Ferraro R, Boyce VL, Swinburn B, De GM, Ravussin E. Energy cost of physical activity on a metabolic ward in relationship to obesity. Am J Clin Nutr. 1991;53:1368–1371. doi: 10.1093/ajcn/53.6.1368. [DOI] [PubMed] [Google Scholar]
- 9.Salbe AD, Tschop MH, DelParigi A, Venti CA, Tataranni PA. Negative relationship between fasting plasma ghrelin concentrations and ad libitum food intake. J Clin Endocrinol Metab. 2004;89:2951–2956. doi: 10.1210/jc.2003-032145. [DOI] [PubMed] [Google Scholar]
- 10.Geiselman PJ, Anderson AM, Dowdy ML, et al. Reliability and validity of a macronutrient self-selection paradigm and a food preference questionnaire. Physiol Behav. 1998;63:919–928. doi: 10.1016/s0031-9384(97)00542-8. [DOI] [PubMed] [Google Scholar]
- 11.Rising R, Alger S, Boyce V, et al. Food intake measured by an automated food-selection system: relationship to energy expenditure. Am J Clin Nutr. 1992;55:343–349. doi: 10.1093/ajcn/55.2.343. [DOI] [PubMed] [Google Scholar]
- 12.Plagemann A. Perinatal nutrition and hormone-dependent programming of food intake. Horm Res. 2006;65(Suppl 3):83–89. doi: 10.1159/000091511. [DOI] [PubMed] [Google Scholar]
- 13.Franke K, Harder T, Aerts L, et al. ‘Programming’ of orexigenic and anorexigenic hypothalamic neurons in offspring of treated and untreated diabetic mother rats. Brain Res. 2005;1031:276–283. doi: 10.1016/j.brainres.2004.11.006. [DOI] [PubMed] [Google Scholar]
- 14.Pettitt DJ, Knowler WC, Bennett PH, Aleck KA, Baird HR. Obesity in offspring of diabetic Pima Indian women despite normal birth weight. Diabetes Care. 1987;10:76–80. doi: 10.2337/diacare.10.1.76. [DOI] [PubMed] [Google Scholar]
- 15.Silverman BL, Rizzo T, Green OC, et al. Long-term prospective evaluation of offspring of diabetic mothers. Diabetes. 1991;40(Suppl 2):121–125. doi: 10.2337/diab.40.2.s121. [DOI] [PubMed] [Google Scholar]
- 16.Pavkov ME, Hanson RL, Knowler WC, et al. Changing patterns of type 2 diabetes incidence among Pima Indians. Diabetes Care. 2007;30:1758–1763. doi: 10.2337/dc06-2010. [DOI] [PubMed] [Google Scholar]
- 17.Ventura AK, Birch LL. Does parenting affect children’s eating and weight status? Int J Behav Nutr Phys Act. 2008;5:15. doi: 10.1186/1479-5868-5-15. [DOI] [PMC free article] [PubMed] [Google Scholar]