Abstract
PURPOSE
To determine the feasibility of performing MRI of the wrist at 7 Tesla with parallel imaging and to evaluate how acceleration factors(AF) affect signal-to-noise ratio(SNR), contrast-to-noise ratio(CNR), and image quality.
MATERIALS AND METHODS
This study had institutional review board approval. A 4-transmit 8-receive channel array coil was constructed in–house. Nine healthy subjects were scanned on a 7T whole-body MR scanner. Coronal and axial images of cartilage and trabecular bone micro-architecture(3D-Fast Low Angle Shot(FLASH) with and without fat suppression, TR/TE=20ms/4.5ms, flip angle=10°, 0.169–0.195×0.169–0.195 mm, 0.5–1 mm slice thickness) were obtained with AF 1, 2, 3, 4. T1-weighted fast spin-echo(FSE), proton density-weighted FSE, and multiple-echo data image combination(MEDIC) sequences were also performed. SNR and CNR were measured. Three musculoskeletal radiologists rated image quality. Linear correlation analysis and paired t-tests were performed.
RESULTS
At higher AF, SNR and CNR decreased linearly for cartilage, muscle, and trabecular bone(r<−0.98). At AF 4, reductions in SNR/CNR were:52%/60%(cartilage), 72%/63%(muscle), 45%/50%(trabecular bone). Radiologists scored images with AF 1 and 2 as near-excellent, AF 3 as good-to-excellent(p=0.075), and AF 4 as average-to-good(p=0.11).
CONCLUSION
It is feasible to perform high resolution 7 Tesla MRI of the wrist with parallel imaging. SNR and CNR decrease with higher AF, but image quality remains above-average.
Keywords: Wrist, 7 Tesla, parallel imaging, musculoskeletal MRI
INTRODUCTION
Magnetic resonance imaging has been shown to be a useful technique to detect wrist derangements, including tears of the triangular fibrocartilage complex (TFCC) (1, 2), tears of the scaphlounate and lunotriquetral ligaments (3), cartilage erosions (4), abnormalities in tendons (5) and peripheral nerves (6), and alterations in trabecular bone micro-architecture (7).
There is increasing evidence that high field (HF, 3.0T) and ultra high field (UHF, 7–9.4T) MRI can provide improved diagnostic capabilities compared to MRI performed at standard clinical field strength (8, 9). The main advantage of HF/UHF MRI is the increased signal-to-noise ratio (SNR), which can be translated into increases in spatial resolution or imaging speed, improved spectral resolution, and the ability to perform multi-nuclear imaging. Challenges of performing UHF MRI include:changes in T1 and T2 relaxation rates (increase in T1 and decrease in T2), maintenance of B0 and B1 field homogeneity, increased chemical shift artifact, increased acoustic noise, and greater RF energy deposition. Nevertheless, the potential for increased SNR and higher spatial resolution could prove useful in imaging of the wrist, where small structures composing this anatomically complex joint can pose diagnostic imaging challenges.
Parallel acceleration techniques and HF/UHF scanners can act in synergy to boost the performance of MRI (10). The additional SNR provided by HF/UHF MRI can compensate for the SNR penalty incurred by implementing parallel imaging, and the increase in imaging speed afforded by parallel imaging can also lead to decreased motion artifact, greater flexibility in MRI sequence protocol design, and greater patient comfort due to decreased examination time,.
The goals of this study were: 1) to determine the feasibility of performing high resolution MRI of the wrist at 7 Tesla using a 4-transmit 8-receive channel array coil and parallel imaging, 2) to evaluate how the implementation of higher acceleration factors (AF) affects image quality, as measured by SNR, CNR, and qualitative image scoring by radiologists.
MATERIALS AND METHODS
Radiofrequency Coil
An RF coil originally designed for imaging the carotid arteries was constructed in-house. The RF coil consists of two curved “clamshell” sections with an inner layer containing 4 overlapped 48 mm circular receive coils, and an outer layer 15 mm above that containing two 70 mm square overlapped transmit loop coils, making a total of 8 receive and 4 transmit elements. Transmit power is split into four equal parts by a cascade of Wilkinson dividers, and applied to the transmit loops with a birdcage-like phase relationship. The wrist is placed in between the two clamshell sections.
Phantom Study
A cylindrical agarose phantom (10 cm diameter, 20 cm in length) was scanned on a Siemens 7T whole body MRI scanner (Erlangen, Germany). To determine B1+ transmit and SNR profiles generated by the phantom, 2D-Fast Low Angle Shot (FLASH) images in sagittal, coronal, and axial planes were obtained at 7 different radio-frequency (RF) excitation voltages (25 to 175 volts, TR/TE=2000ms/5.0ms, FOV=100mm × 100 mm, matrix=128 × 128, slice thickness=3 mm, BW=180 Hz/Pixel). The spatial variation of the flip angle and hence the B1+ transmit field, was determined using Matlab (Natick, Massachusetts) by fitting the RF excitation voltages to the sinusoidal variation in image intensities on a pixel-by-pixel basis (11). To determine SNR, a noise reference measurement was obtained by recording data without any RF excitation, and the noise covariance was calculated (12). SNR maps were calculated from the uncombined individual coil images and noise covariance for root-sum-of-squares combination (13), then corrected on a pixel-by-pixel basis for SNR bias introduced by the magnitude detection (13, 14).
Human Subjects
After approval by the institutional review board and in accordance with the standards of the Health Insurance Portability and Accountability Act (HIPAA), we recruited nine healthy volunteers (6 males, 3 females, average age 24 years +/− 3.2). Written informed consent was obtained. The subjects were scanned in the prone position with the wrist extended in front of them (“superman” position).
MRI Scanning
The human subjects were scanned on the same 7T whole body MR scanner. Coronal images of cartilage were obtained via a fat-suppressed 3D-FLASH sequence (TR/TE=20ms/4.5ms, flip angle=10°, bandwidth=130 Hz/pixel, 45 coronal images, FOV=100 mm × 100 mm, matrix=512 × 512 (resolution=0.195 × 0.195 mm), 1 mm slice thickness). Axial images of trabecular bone micro-architecture were obtained via the same 3D-FLASH sequence without fat suppression (FOV=86 mm × 86 mm (resolution=0.169 × 0.169 mm), slice thickness=0.5 mm). Parallel imaging (GRAPPA, 24 reference lines) with AF 1, 2, 3, and 4 was implemented for both sequences with right-left phase encoding. For coronal/axial images, scan times were: 6 minutes 5 seconds/4 minutes 6 seconds (AF 1), 3 minutes 11 seconds/2 minutes 9 seconds (AF 2), 2 minutes 13 seconds/1 minute 30 seconds (AF 3), and 1 minute 44 seconds/1 minute 10 seconds (AF 4).
We performed a few clinical sequences without parallel imaging to further test the coil:coronal T1-weighted fast spin-echo (FSE, TR/TE=500 ms/15 ms, bandwidth=130 Hz/pixel, 0.080 mm × 0.080 mm in-plane resolution, slice thickness=2 mm, 8 images, acquisition time=5 minutes 33 seconds); axial and coronal proton density-weighted FSE without and with fat suppression (TR/TE=3000 ms/15 ms, bandwidth=130 Hz, 0.22 mm × 0.22 mm in-plane resolution, slice thickness=2 mm, 20 images, acquisition time=3 minutes 9 seconds); and a 3D multiple-echo data image combination (MEDIC) sequence with near-isotropic spatial resolution (TR/TE=58 ms/24 ms, 0.35 mm × 0.35 mm in-plane resolution, slice thickness=0.4 mm, 80 images, acquisition time=7 minutes 50 seconds).
G-Factor Maps
G-factor maps were generated by acquiring 2D gradient-echo images (TR/TE=200 msec/3.6 msec, BW=620 Hz, flip angle = 40°, FOV=86 mm × 86 mm, matrix = 128×128 (resolution=0.67 mm × 0.67 mm), slice thickness=3 mm) in axial and coronal orientations. An additional scan was obtained with no RF excitation for determination of the noise statistics. Raw k-space data were saved. Individual coil images were reconstructed and smoothed to create coil sensitivity profiles, and noise covariance was calculated from the noise acquisition (12). G-factor values were then calculated as previously described (15).
Measurement of SNR and CNR
Axial images were used to determine trabecular bone/marrow space SNR, and coronal images were used to determine cartilage and muscle SNR. SNR was calculated using the “difference” method (16). Two images were acquired in succession with identical parameters. A 3 mm diameter ROI was drawn in the identical location on each image. SNR was computed as the ratio of the average signal intensity within the ROI for the two images and the standard deviation within the ROI on the difference image:
To calculate CNR for cartilage (C)-bone (B), muscle (M)–bone (B), and cartilage (C)–TFCC (T) interfaces, a 3 mm diameter ROI was placed in the identical location on two images obtained in immediate succession. Contrast was defined as the difference in mean signal intensity between 1) cartilage and adjacent bone, 2) muscle and adjacent bone, and 3) cartilage and TFCC. Noise was defined as the standard deviation within an ROI encompassing both these structures on the difference image. CNR was calculated as the ratio of these two values:
Qualitative Image Analysis
All information pertaining to the MRI sequence parameters was removed from the images. Three musculoskeletal radiologists with various amounts of experience (1, 2, and 18 years) scored the images for the ability to visualize each of the following structures: cartilage, tendons, nerves, ligaments, and trabecular bone. A scale of 0 to 4 was utilized: 0=non-visualization, 1=poor, 2=average, 3=good, 4=excellent. The final score was determined by summing the individual scores with the following scale: 5=poor, 10=average, 15=good, 20 (maximum)=excellent. These radiologists were blinded to the purpose of the study and did not know that the same volunteers were imaged more than once.
Statistical Analysis
Mean values for SNR, CNR, and image scores were calculated. Normalized values were obtained by dividing the mean SNR or CNR value by the value obtained at AF 1. To evaluate the relationship between SNR and CNR vs. AF, linear correlation analysis (SPSS, Chicago, Illinois) and calculation of Pearson product-moment correlation coefficient (r) were performed. Paired t-tests (Microsoft Excel, Redmond, Washington) were performed to determine whether statistically significant differences (p < 0.05) existed between the mean scores assigned for AF 3 and AF 1, and mean scores assigned for AF 4 and AF 1.
RESULTS
The B1+ excitation field map demonstrates that there is greater homogeneity of the B1+ field within the center of the FOV of the coil in coronal, sagittal, and axial planes (Figure 1a). The coil profile sensitivity map demonstrates that coil sensitivity is higher in locations close to the coils, and relatively homogeneous within the center of the FOV (Figure 1b). SNR was calculated at the anterior, central, and posterior locations for different AFs on axial images for the cylindrical phantom (Figure 1c). The SNR in anterior, posterior, and central locations decreased linearly (r = −0.98, r = −0.99, r = −0.99, respectively) with higher AFs. At AF 4, the decrease in SNR compared to AF 1 was 80% anteriorly, 68% posteriorly, and 76% in the central location.
Figure 1.
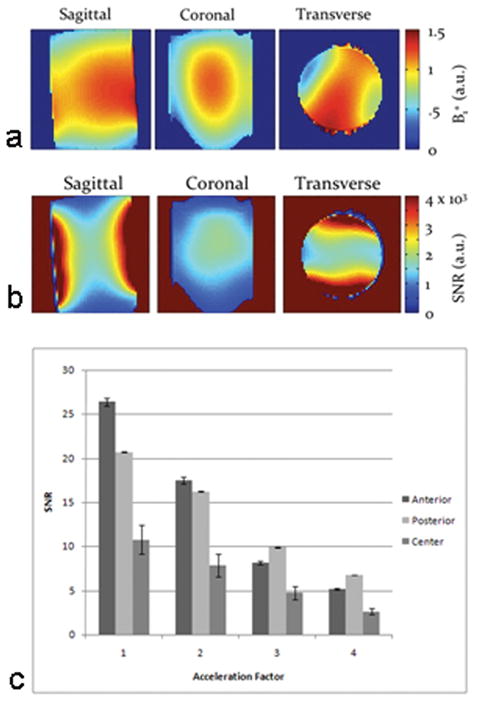
(a) Maps of the B1+ excitation field (a) in the sagittal, coronal, and transverse planes measured in arbitrary units (a.u.). Within the center of the field of view, the excitation field is relatively homogeneous. (b) Maps of the receive coil sensitivity in the sagittal, coronal, and transverse planes after correcting for the effect of the B1+ field measured in SNR a.u. There is greater SNR in locations close to the coils. (c) Bar graph demonstrates the relationship between SNR (in anterior, central and posterior locations) and acceleration factor. SNR was approximately 2 to 2.5 fold greater in the anterior and posterior locations compared to the central location and decreased linearly with higher acceleration factors (r ≤ −0.98 for all).
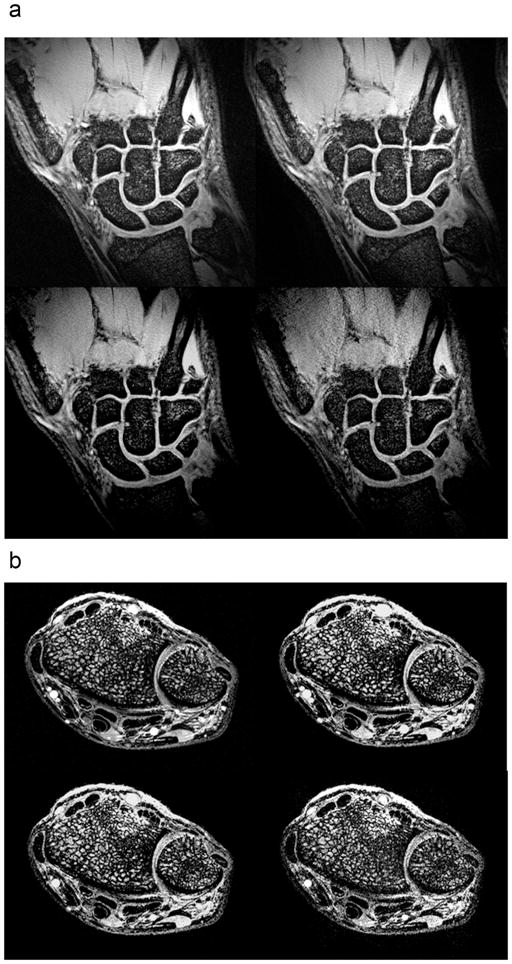
Figure 2a demonstrates coronal images of wrist cartilage obtained with the fat-suppressed 3D-FLASH sequence with AF 1 through 4. Although the images become noisier with increasing AF; it is still possible to distinguish articular cartilage as well as the interface between articular cartilage surfaces at AF 4. In addition, the scapholunate ligament and triangular fibrocartilage are also detectable at AF 4.
Figure 2.
(a) Coronal fat-suppressed 3D-FLASH (TR/TE = 20ms/4.5ms, 0.195 mm × 0.195 mm, 1 mm slice thickness) image of the wrist with acceleration factor 1 (top left), 2 (top right), 3 (bottom left), and 4 (bottom right). Acquisition times ranged from 6 minutes 5 seconds (AF 1) to 1 minute 44 seconds (AF 4). (b) Axial 3D-FLASH (TR/TE = 20ms/4.5ms, 0.169 mm × 0.169 mm, 0.5 mm slice thickness) image of the wrist with acceleration factor 1 (top left), 2 (top right), 3 (bottom left), and 4 (bottom right). Acquisition times ranged form 4 minutes 6 seconds to 1 minute 10 seconds.
Figure 2b demonstrates axial images of trabecular bone micro-architecture of the wrist obtained with the 3D-FLASH sequence without fat suppression with AF 1 through 4. Again, on a qualitative level, although the images become noisier with increasing AF, it is still possible to distinguish trabecular bone micro-architecture at AF 4, as well as flexor and extensor tendons and the median nerve.
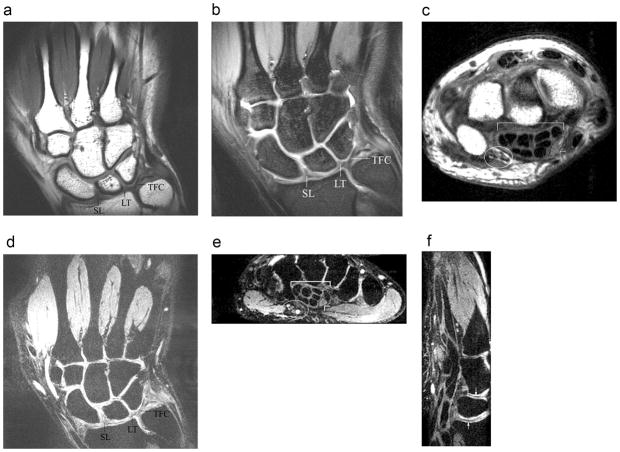
To further test the coil, we performed a few additional clinical sequences of the wrist at 7T without parallel imaging (Figure 3). MEDIC images were obtained with near isotropic spatial resolution (0.35 mm × 0.35 mm, 0.4 mm slice thickness). Coronal T1-weighted (Figure 3a), coronal proton density-weighted fat suppressed (Figure 3b), and coronal MEDIC (Figure 3d) images of the wrist demonstrate the triangular fibrocartilage and portions of the scapholunate and lunotriquetral ligaments. Axial proton density-weighted (Figure 3c) and axial-reconstructed MEDIC (Figure 3d) images demonstrate the flexor tendons, median nerve, and ulnar nerve and vessels. The sagittal-reconstructed MEDIC (Figure 3e) image demonstrates the interfaces between articular cartilage at the radiolunate and lunocapitate joints, as well as flexor tendons within the carpal tunnel.
Figure 3.
Coronal T1-weighted (a) fast spin-echo (TR/TE = 500 ms/15 ms, 0.08 mm × 0.08 mm, 2 mm slice thickness) and coronal proton density-weighted (b) fast spin-echo fat-suppressed (TR/TE = 3000 ms/15 ms, 0.22 mm × 0.22 mm, 2 mm slice thickness) images of the wrist provide excellent visualization of the scapholunate (SL) and lunotriquetral (LT) ligaments, as well as the triangular fibrocartilage (TFC). Axial proton density-weighted (c) fast spin-echo (TR/TE = 3000 ms/15 ms, 0.22 mm × 0.22 mm, 2 mm slice thickness) image of the wrist provides excellent visualization of the ulnar nerve and vessels (ellipse), the flexor tendons within the carpal tunnel (bracket), and the median nerve (arrowhead). Coronal 3D-MEDIC (d) (TR/TE = 58 ms/24 ms, 0.35 × 0.35 mm, 0.40 mm slice thickness) image of the wrist with near-isotropic voxels also provides excellent visualization of the scapholunate (SL) and lunotriquetral (LT) ligaments, and the triangular fibrocartilage (TFC). Axial-reconstructed (e) 3D-MEDIC (same parameters) image of the wrist provides excellent visualization of the ulnar nerve and vessels (ellipse), the flexor tendons within the carpal tunnel (bracket), as well as the median nerve (arrowhead). Finally, the sagittal-reconstructed (f) 3D-MEDIC (same parameters) image of the wrist demonstrates the interfaces between cartilage surfaces of the radiolunate (arrow w/arrowhead up) and lunocapitate (arrow w/arrowhead down) joints. The flexor tendons of the carpal tunnel are seen at the volar aspect of the wrist (left side of image).
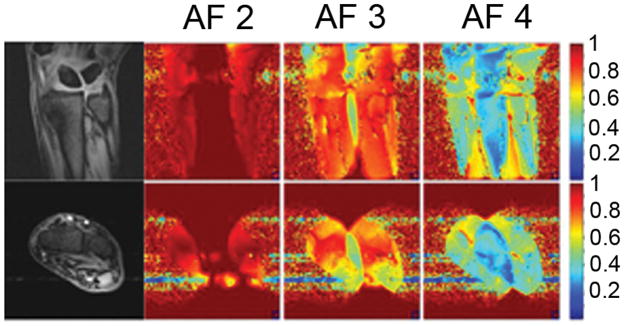
G-factor maps obtained for different acceleration factors are shown in Figure 4. The maps are plotted as 1/g-factor. At AF 2, the g-factor in the center of the field of view varies between approximately 1 to 1.2. At AF 3, the g-factor in the center of field of view ranges from approximately 1.2 to 2.5. Finally, at AF 4, the g-factor ranges from approximately 2 to 5.
Figure 4.
Maps of the inverse g-factor (1/g) for acceleration factors (AF) 2, 3, and 4. These were determined from the coronal (top row) and axial (bottom row) images of the wrist of a healthy human volunteer. All maps are rendered with the same color scale for comparison; low values (blue) show areas with high g-factor.
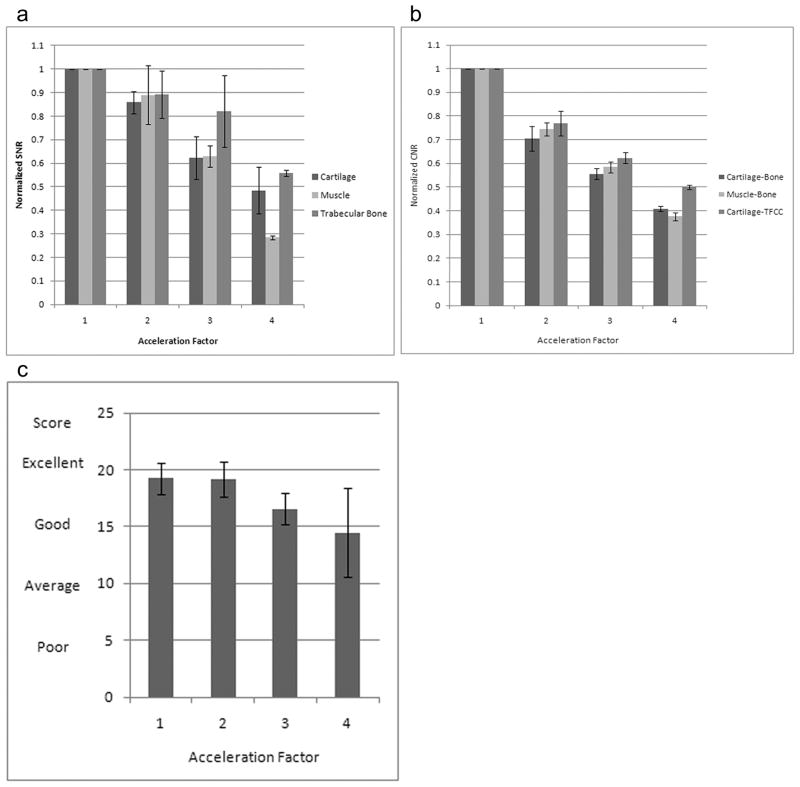
Normalized SNR for cartilage, muscle, and trabecular bone decreased linearly (r=−0.99, r=−0.97, r=−0.96, respectively) with higher AF (Figure 5a). At AF 4, the reduction in normalized SNR compared to AF 1 was 52% for cartilage, 72% for muscle, and 45% for trabecular bone. The CNR for cartilage-bone, muscle-bone, and cartilage-TFCC decreased linearly (r=−0.98, r=−0.99, r=−0.98, respectively) with higher AFs. At AF 4, the reduction in CNR was 60% for cartilage-bone, 63% for muscle-bone, and 50% for cartilage-TFCC (Figure 5b).
Figure 5.
Bar graphs demonstrate the relationship between SNR, CNR, and image quality versus acceleration factor. (a) SNR for cartilage, muscle, and trabecular bone decreased linearly (r ≤ −0.96) with higher acceleration factors. (b) CNR for cartilage-bone, muscle-bone, and cartilage-TFCC interfaces decreased linearly (r ≤ −0.98) with higher acceleration factors. (c) Image quality at acceleration factors 1 and 2 was scored as near-excellent. At acceleration factor 3, image quality was scored as better than good (p=0.075), and at acceleration factor 4, image quality was scored as above-average and almost good (p=0.11). (Scoring: 20 = Excellent, 15 = Good, 10 = Average, 5 = Poor).
Three readers scored images with AF 1 and 2 as near-excellent (19.2+/−1.35, 19.1+/−1.54), and assigned good-to-excellent (16.5 +/− 1.38) and average-to-good (14.4 +/− 3.9) scores for images obtained with AF 3 and AF 4, respectively (Figure 5c). The difference in scores for images obtained with AF 1 and AF 3 (p = 0.075), and AF 1 and AF 4 (p=0.11) were approaching statistical significance.
DISCUSSION
In conclusion, we have performed a pilot study in healthy subjects demonstrating the feasibility of performing high spatial resolution (0.169–0.195 mm in-plane resolution, 0.5–1.0 mm slice thickness) MRI of the wrist at 7 Tesla using a 4-transmit 8-receive channel array coil, including parallel imaging. Previously, the feasibility of performing MRI of the wrist at 8 Tesla using a single element 12 cm wrist coil in a healthy volunteer was described (17, 18), and recently 7 Tesla MRI of the hand and wrist was performed in a healthy volunteer using a 16 cm diameter monkey head coil (19). To our best knowledge, this is the first time UHF MRI of the wrist using a multi-element coil with parallel imaging has been described.
The advantage of scanning at UHF is the increased SNR, which can be converted into increased spatial resolution or decreased scan time (20). SNR in the phantom, and SNR and CNR for different musculoskeletal tissues (cartilage, muscle, trabecular bone) decreased with increasing parallel AFs, consistent with the expected noise penalty incurred by implementing parallel acceleration techniques. The SNR for muscle decreased approximately 72% at AF 4, while SNR for cartilage and trabecular bone only decreased 52% and 45%, respectively. This differential reduction in SNR for different tissues at AF 4 most likely stems from the spatial variation in g-factors that exist within the center of the field of view of the coil (Figure 4).
Despite the decreasing SNR and CNR at higher AFs, adequate visualization of numerous wrist structures, including ligaments, tendons, cartilage, nerves, and trabecular bone was possible. Overall, images obtained with AFs 1 and 2 were scored as near-excellent by dedicated musculoskeletal radiologists, and images obtained with AFs 3 and 4 were scored as above-average.
We also performed a few additional sequences at 7T to test the coil, including a MEDIC sequence with near-isotropic voxels. Though performed without parallel imaging (scanning with all sequences and all acceleration factors 1–4 would have resulted in excessive scan time), the images obtained hold promise for future studies in subjects with wrist pathology. The ability to obtain isotropic voxels and perform multiplanar reconstructions, such as in the MEDIC sequence, may be useful in the anatomically complex wrist joint, where cartilage, ligaments, tendons, nerves, and blood vessels do not remain in one plane.
There are limitations to this study. Firstly, the number of subjects was small. Secondly, we did not perform a full range of clinical sequences on the patients, as the scan time would have been excessive. Finally, we did not scan the subjects at 1.5T or 3T and cannot comment on the difference in image quality between standard clinical field strength and UHF MRI.
In conclusion, we have demonstrated the feasibility of performing high resolution MRI of the wrist at 7 Tesla, including the performance of parallel acceleration techniques, and we have shown that although SNR and CNR decrease with increasing AFs, images remain above-average in quality when scored by musculoskeletal radiologists. Further work, especially the scanning of subjects with wrist pathology is needed to determine if there is any benefit to scanning subjects at 7T compared to 3T and 1.5T. Given the proliferation of HF and UHF scanners in the radiology community and the development of phased array coils for specific joints, the utilization of parallel imaging and HF/UHF MRI for musculoskeletal applications should only increase.
Acknowledgments
RSNA R&E Foundation Research Resident Grant RR0806, Max Kade Foundation, NIAMS/NIH R01 R01-AR053133-01A2
References
- 1.Golimbu CN, Firooznia H, Melone CP, Jr, Rafii M, Weinreb J, Leber C. Tears of the triangular fibrocartilage of the wrist: MR imaging. Radiology. 1989;173:731–733. doi: 10.1148/radiology.173.3.2813778. [DOI] [PubMed] [Google Scholar]
- 2.Schweitzer ME, Brahme SK, Hodler J, et al. Chronic wrist pain: spin-echo and short tau inversion recovery MR imaging and conventional and MR arthrography. Radiology. 1992;182:205–211. doi: 10.1148/radiology.182.1.1727283. [DOI] [PubMed] [Google Scholar]
- 3.Anderson ML, Skinner JL, Felmlee JP, Berger RA, Amrami KK. Diagnostic comparison of 1.5 Tesla and 3.0 Tesla Preoperative MRI of the wrist in patients with ulnar-sided wrist pain. J Hand Surg. 2008;33:1153–1159. doi: 10.1016/j.jhsa.2008.02.028. [DOI] [PubMed] [Google Scholar]
- 4.Haims AH, Moore AE, Schweitzer ME, et al. MRI in the diagnosis of cartilage injury in the wrist. AJR Am J Roentgenol. 2004;182:1267–1270. doi: 10.2214/ajr.182.5.1821267. [DOI] [PubMed] [Google Scholar]
- 5.Bencardino JT. MR imaging of tendon lesions of the hand and wrist. Magn Reson Imaging Clin N Am. 2004;12(2):333–47. vii. doi: 10.1016/j.mric.2004.02.010. [DOI] [PubMed] [Google Scholar]
- 6.Bordalo-Rodrigues M, Amin P, Rosenberg ZS. MR imaging of common entrapment neuropathies at the wrist. Magn Reson Imaging Clin N Am. 2004;12(2):265–79. vi. doi: 10.1016/j.mric.2004.02.008. [DOI] [PubMed] [Google Scholar]
- 7.Majumdar S, Genant HK, Grampp S, Newitt DC, Truong VH, Lin JC, Mathur A. Correlation of trabecular bone structure with age, bone mineral density, and osteoporotic status: in vivo studies in the distal radius using high resolution magnetic resonance imaging. J Bone Miner Res. 1997;12(1):111–118. doi: 10.1359/jbmr.1997.12.1.111. [DOI] [PubMed] [Google Scholar]
- 8.Masi JN, Sell CA, Phan C, Han E, Newitt D, Steinbach L, Majumdar S, Link TM. Cartilage MR imaging at 3.0 versus that at 1.5T: preliminary results in a porcine model. Radiology. 2005;236(1):140–50. doi: 10.1148/radiol.2361040747. [DOI] [PubMed] [Google Scholar]
- 9.Regatte R, Schweitzer ME. Ultra-high-field MRI of the musculoskeletal system at 7.0 T. J Magn Reson Imaging. 2007;25(2):262–9. doi: 10.1002/jmri.20814. [DOI] [PubMed] [Google Scholar]
- 10.Pruessmann KP. Parallel imaging at high field strength: synergies and joint potential. Top Magn Reson Imaging. 2004;15:237–244. doi: 10.1097/01.rmr.0000139297.66742.4e. [DOI] [PubMed] [Google Scholar]
- 11.Setsompop K, Alagappan V, Gagoski B, et al. Slice-Selective RF pulses for In-vivo B1+ Inhomogeneity Mitigation at 7 Tesla using Parallel RF Excitation with a 16-Element coil. Magn Reson Med. 2008;60(6):1422–32. doi: 10.1002/mrm.21739. [DOI] [PMC free article] [PubMed] [Google Scholar]
- 12.Kellman P, McVeigh ER. Image reconstruction in SNR units: a general method for SNR measurement. Magn Reson Med. 2005;54(6):1439–1447. doi: 10.1002/mrm.20713. [DOI] [PMC free article] [PubMed] [Google Scholar]
- 13.Roemer PB, Edelstein WA, Hayes CE, Souza SP, Mueller OM. The NMR phased array. Magn Reson Med. 1990;16(2):192–225. doi: 10.1002/mrm.1910160203. [DOI] [PubMed] [Google Scholar]
- 14.Constantinides CD, Atalar E, McVeigh ER. Signal-to-noise measurements in magnitude images from NMR phased arrays. Magn Reson Med. 1997;38(5):852–857. doi: 10.1002/mrm.1910380524. [DOI] [PMC free article] [PubMed] [Google Scholar]
- 15.Pruessmann KP, Weiger M, Scheidegger MB, Boesiger P. SENSE: sensitivity encoding for fast MRI. Magn Reson Med. 1999;42:952–962. [PubMed] [Google Scholar]
- 16.Dietrich O, Raya JG, Reeder SB, Reiser MF, Schoenberg SO. Measurement of signal-to-noise ratio in MR images: influence of multichannel coils, parallel imaging, and reconstruction filters. J Magn Reson Imaging. 2007;26:375–385. doi: 10.1002/jmri.20969. [DOI] [PubMed] [Google Scholar]
- 17.Ashman CJ, Farooki S, Abduljalil AM, Chakeres DW. In vivo high resolution coronal MRI of the wrist at 8.0 Tesla. Journal of Computer-Assisted Tomography. 2002;26(3):387–391. doi: 10.1097/00004728-200205000-00013. [DOI] [PubMed] [Google Scholar]
- 18.Farooki S, Ashman CJ, Yu JS, Abduljalil A, Chakeres D. In vivo high resolution imaging of the carpal tunnel at 8.0 tesla. Skeletal Radiol. 2002;31:445–450. doi: 10.1007/s00256-002-0506-z. [DOI] [PubMed] [Google Scholar]
- 19.Behr B, Stadler J, Michaely HJ, Damert HG, Schneider W. MR imaging of the hand and wrist at 7T. Skeletal Radiol. 2009;38:911–7. doi: 10.1007/s00256-009-0673-2. [DOI] [PubMed] [Google Scholar]
- 20.Banerjee S, Krug R, Carballido-Gamio J, et al. Rapid in vivo musculoskeletal MR with parallel imaging at 7T. Magn Reson Med. 2008;59:655–660. doi: 10.1002/mrm.21455. [DOI] [PubMed] [Google Scholar]


