Genome Research 20: 1052–1063 (2010)
A global role for KLF1 in erythropoiesis revealed by ChIP-seq in primary erythroid cells
Michael R. Tallack, Tom Whitington, Wai Shan Yuen, Elanor N. Wainwright, Janelle R. Keys, Brooke B. Gardiner, Ehsan Nourbakhsh, Nicole Cloonan, Sean M. Grimmond, Timothy L. Bailey, and Andrew C. Perkins
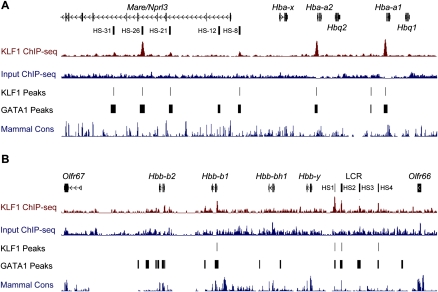
The authors recently have been made aware by colleagues Jim Hughes and Doug Higgs of an error in Figure 2, which reports occupancy of KLF1 at the mouse alpha-globin locus (Fig. 2A). The authors’ strategy for mapping KLF1 ChIP-seq sequencing tags to the mm9 genome only when they are found to be unique has aberrantly eliminated the potential to observe occupancy at the Hba-a1 and Hba-a2 genes, which are identical and have arisen from gene duplication. Below is an alternate version of Figure 2 in which mapping has been corrected to allow occupancy to be observed at these genes. It becomes obvious that KLF1 occupies not only the DNase I hypersensitive sites, but also the promoters of Hba-a1 and Hba-a2. The authors thank Jim Hughes in particular for providing them with the data to correct this figure. The legend for this figure remains unchanged.
Figure 2.
KLF1 binds the mouse alpha- and beta-globin loci at proximal promoters and locus control regions. (A) An image of the murine alpha-globin gene cluster and the upstream locus control region regulatory element (HS-31 to HS-8) from the UCSC Genome Browser. Genes and DNase I hypersensitivity (HS) sites are represented in the top track. KLF1 ChIP-seq signal (maroon) and Input ChIP-seq signal (blue) tracks are also shown together with KLF1 peak calls (KLF1 Peaks). An additional track describing GATA1 ChIP-seq peak calls from Cheng et al. (2009) is shown (GATA1 Peaks) together with a mammalian conservation track (Mammal Cons). (B) An image of the murine beta-globin gene cluster and locus control region flanked by olfactory receptor genes from the UCSC Genome Browser. Genes and DNase I HS sites are represented in the top track. Other tracks are presented as for A.


