

Abstract
Abdominal computed tomography (CT) findings of malaria are not well-known even though malaria is a serious infectious disease. To identify abdominal CT findings, we selected 34 of 405 patients who had a positive peripheral blood smear for Plasmodium vivax and had underwent abdominal CT as the malaria group. We also selected 80 patients who had fever and a negative peripheral blood smear as the control group and 120 healthy people as the normal group. We reviewed and analyzed their medical records and CT findings retrospectively. The mean spleen and liver length were significantly larger in the malaria group and the incidence of splenomegaly, splenic focal low attenuation, and spontaneous splenic rupture were much higher in the malaria group (P < 0.05). Although abdominal CT is not an indispensable tool for diagnosis, these CT findings will help in the diagnosis of malaria in patients with fever.
Malaria is a serious, mosquito-borne, infectious disease that is caused by Plasmodium species. Plasmodium species are transmitted by infected female mosquitoes of genera that bite humans. These parasites grow within erythrocytes and are released by cyclic hemolysis. Malaria is distributed worldwide in endemic areas such as South America, Africa, and South Asia. South Korea was known to be an area endemic for P. vivax, and the reemergence of this disease has been reported along the western edge of the Demilitarized Zone since 1993.1
The main symptom of malaria is episodic fever. Abdominal symptoms of P. vivax malaria are usually mild and nonspecific and include abdominal pain or hepatosplenomegaly.2,3 However, abdominal computed tomography (CT) findings of patients with P. vivax malaria are not well known. To the best of our knowledge, only a few sporadic case reports are found in the English literature.2–5 Malaria is still a worldwide life-threatening infection and should be included in the differential diagnosis of a fever wherever malaria is present. Therefore, the purpose of this study was to investigate the abdominal CT findings of P. vivax malaria.
This retrospective study was reviewed and approved by our institutional review board and patient consent was waived. During January 2004–February 2009, the medical records of 405 patients in our hospital who were confirmed as having P. vivax malaria by peripheral blood smear were obtained. Among them, 47 patients underwent an abdominal CT examination and 51 patients underwent abdominal ultrasonography because of gastrointestinal symptoms.
Exclusion criteria were more than a three-day interval between the peripheral blood smear and CT scan (n = 8), non-digitalized images (n = 2), unavailable peripheral blood smear slides (n = 2), and monophasic CT (n = 1). Thus, our final study population was composed of 34 patients (24 men and 10 women, mean age = 48.1 years). All patients were completely cured by treatment with chloroquine and most patients were lost to further follow-up. Two patients underwent follow-up CTs for other reasons. One patient underwent a splenectomy for a spontaneous rupture. Two patients with a subcapsular hematoma were hemodynamically stable and were successfully managed with supportive care.
We retrospectively searched and evaluated the medical records of 80 consecutive patients (40 men and 40 women, mean age = 48.7 years) among those who visited the emergency department with high fever (> 38.3°C), had negative results for a peripheral blood smear, and underwent bi-phasic abdominal CT. The causes of their fever were acute hepatitis (n = 17), acute pyelonephritis (n = 11), acute gastroenteritis (n = 9), cholecystitis (n = 9), liver abscesses (n = 8), and cholangitis (n = 5), and so on. All diagnoses were confirmed by available date in the form of image characteristics, pathologic results, and clinical courses. For the normal group, we also tested 120 consecutive persons (86 men and 34 women, mean age = 45.9 years) who visited a health promotion center more than twice for health checkups.
The CT examinations were performed by using a 64-channel Multi-Detector Computed Tomography (Aquilion64; Toshiba, Tokyo, Japan) or a 4-channel Multi-Detector Computed Tomography (Volume Zoom; Siemens Medical Solutions, Malvern, PA). Images were obtained at a 5 mm slice thickness in the craniocaudal direction for the axial scan. Coronal and sagittal images were reconstructed automatically on the console or by using Rapidia 2.8 software (Infinity, Seoul, South Korea). Images were routinely obtained at 40 seconds and 120 seconds after initiation of the injection of 130 mL of contrast material at a rate of 2–3 mL/second, which represented the arterial and delayed phases, respectively.
A radiologist who was unaware of the clinical diagnosis and results analyzed all CT findings and measured the lengths of the spleen and liver. We set the measurement criteria of splenomegaly as a splenic length of 10 cm, considering measurement errors and intraobserver bias,6 and of hepatomegaly as a liver length of 18 cm.7 Gallbladder wall edema was defined as a wall thickness > 3 mm.7 Focal low attenuation was defined as poor enhancement on arterial and delayed phases compared with the background spleen parenchyma.8 Ascites were defined as fluid collection in the perihepatic or perisplenic space. Clinical data were obtained by reviewing electronic medical records. A clinical pathologist reviewed the peripheral blood smear slides and divided them into two different categories: sexual (gametocyte) and asexual forms of the malaria parasite.
Statistical analyses were performed by using the Student t-test and Fisher's exact test. A P value < 0.05 was considered statistically significant.
Splenomegaly is one of the characteristic clinical signs of malaria. It can be found in up to 50–90% of malaria patients.3,5,8 Our results also showed a statistically higher incidence of splenomegaly in the malaria group (79.4%) (P < 0.01). The mean ± SD value of spleen length (12.4 ± 0.9 cm) in the malaria group was larger than those of the non-malaria groups (P < 0.05) (Table 1). Hepatomegaly was also frequently observed in the malaria group, but the incidence was not statistically different from that of the non-malaria groups. However, the mean ± SD value of liver length (18.9 ± 0.7 cm) in the malaria group was larger than those in the non-malaria groups (P < 0.05). Gallbladder wall edema and periportal edema were more prevalent in the malaria and control groups than in the normal group. Results of CT findings are summarized in Table 2.
Table 1.
Comparison of splenic and liver size in malaria, control, and normal groups, South Korea
| Characteristic | Malaria group | Non-malaria group | |
|---|---|---|---|
| Control | Normal | ||
| Mean ± SD spleen length, cm | 12.4 ± 0.9 | 10.2 ± 0.7 | 8.6 ± 0.3 |
| Mean ± SD liver length, cm | 18.9 ± 0.7 | 17.4 ± 0.6 | 8.6 ± 0.3 |
Table 2.
Computed tomography findings of malaria, control, and normal groups, South Korea*
| Findings | Malaria group (n = 34) | Non-malaria group (n = 200) | Total (n = 234) | P | ||||
|---|---|---|---|---|---|---|---|---|
| Control group (n = 80) | Normal group (n = 120) | Malaria vs. control | Malaria vs. normal | Control vs. normal | ||||
| Splenomegaly, spleen length, cm | ≥ 10 cm | 27 (79.4) | 43 (53.8) | 13 (10.8) | 83 | 0.01 | < 0.01 | < 0.01 |
| < 10 cm | 7 (20.6) | 37 (46.2) | 107 (89.2) | 151 | ||||
| Hepatomegaly | ≥ 18 cm | 22 (64.7) | 35 (44.3) | 18 (18.3) | 75 | 0.07 | < 0.01 | < 0.01 |
| < 18 cm | 12 (35.3) | 44 (55.7) | 102 (81.7) | 158 | ||||
| Focal low attenuation | Positive | 13 (38.2) | 3 (3.8) | 5 (4.2) | 21 | < 0.01 | < 0.01 | 1 |
| Negative | 21 (61.8) | 77 (96.2) | 115 (95.8) | 213 | ||||
| Gallbladder wall edema | ≥ 3 mm | 11 (32.4) | 24 (32.9) | 0 (0) | 35 | 1 | < 0.01 | < 0.01 |
| < 3 mm | 23 (67.6) | 49 (67.1) | 120 (100) | 192 | ||||
| Periportal edema | Positive | 12 (35.3) | 19 (23.8) | 4 (3.3) | 35 | 0.25 | < 0.01 | < 0.01 |
| Negative | 22 (64.7) | 61 (76.2) | 116 (96.7) | 199 | ||||
| Ascites | Positive | 12 (35.3) | 17 (21.3) | 3 (2.5) | 32 | 0.16 | < 0.01 | < 0.01 |
| Negative | 22 (64.7) | 63 (78.7) | 117 (97.5) | 202 | ||||
| Spontaneous rupture or hemorrhage | Positive | 3 (8.8) | 0 (0) | 0 (0) | 3 | 0.03 | 0.01 | 1 |
| Negative | 31 (91.2) | 80 (100) | 120 (100) | 231 | ||||
Findings were evaluated in 234 patients, except liver length and gallbladder wall edema, which were evaluated in 233 patients and 227 patients, respectively, because of right lobectomy or cholecystectomy. Ascites indicates fluid collection in perihepatic or perisplenic space in upper abdomen.
A higher rate of focal low attenuation was observed in the spleen for the malaria group than in the non-malaria groups (P < 0.01), but the rate for the control group was not statistically different from that of the normal group. Multifocal wedge-shaped, low-attenuated regions were frequently observed in the periphery of the spleen, and this finding represented the typical finding of the splenic infarct. The postulated mechanism of the splenic infarct is hyperplasia of the reticuloendothelial system, which is caused by an increased clearance function.5,8,9 Elongated low attenuations that were usually located in the periphery of the spleen were also observed. An animal model demonstrated that this elongated low attenuation was organized thrombus causede by infected erythrocytes in the dilated splenic veins.9 The follow-up CTs in two patients showed that the elongated low attenuation had disappeared without sequelae, and the splenic size also had become normal (Figure 1).
Figure 1.
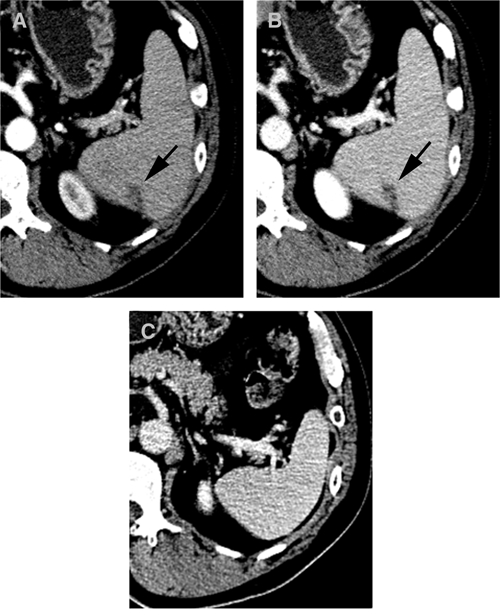
Computed tomography (CT) scan of a 52-year-old man with fever and chills, South Korea. A and B, CT showing splenomegaly with relatively well-defined beaded or elongated shaped low attenuation (arrows) on arterial and delayed phases. It was well-demarcated on the delayed phase. C, On follow-up CT three months later, the low attenuated lesion and splenomegaly had been resolved without sequelae after chloroquine treatment.
Spontaneous splenic rupture or subcapsular hematoma was only observed in the malaria group (P < 0.05) (Figure 2). Plasmodium vivax malaria was previously known as the most frequent tropical infectious cause of spontaneous splenic rupture. Although our study showed a high rate of splenic rupture or subcapsular hematoma (3 cases, 8.8%), spontaneous rupture was seen in only one case (2.9%), which is consistent with the incidence reported in a previous study.3 A careful survey of CT will be useful for assessing the prognosis of a splenic rupture. Although the exact mechanism of a splenic rupture is not known, several mechanisms of vascular congestion and thrombosis have been recently suggested.5 The pathologic review of our case also showed multifocal dilated vessels, focal hematoma, and necrosis.
Figure 2.
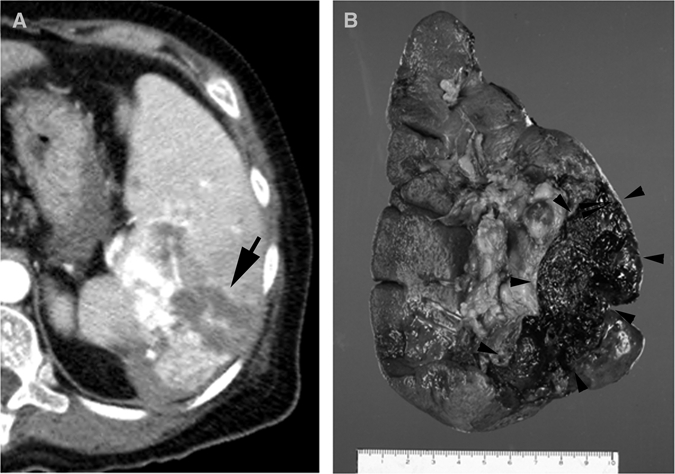
Computed tomography of a 52-year-old women who came to the emergency department with fever and left flank pain without history of trauma, South Korea. A, Computed tomography showing splenomegaly, splenic rupture, and hemoperitoneum with active bleeding (arrow). Splenectomy was performed and Plasmodium vivax malaria was confirmed by peripheral blood smear. B, Note splenic rupture and hematoma formations (arrowheads) on gross specimen.
The laboratory findings for the three groups are summarized in Table 3. Low leukocyte counts are often seen in patients with acute malaria infection. Low levels of lymphocytes and eosinophils are common in acute malaria infection, but the eosinophil levels increase over a few weeks.10 Although the mechanism is not yet clearly known, mild thrombocytopenia is common in patients with P. vivax malaria, but severe thrombocytopenia is rare.4,11
Table 3.
Laboratory findings for malaria, control, and normal groups, South Korea
| Characteristic | Malaria | Control | Normal | P | ||
|---|---|---|---|---|---|---|
| Malaria vs. control | Malaria vs. normal | Control vs. normal | ||||
| Hemoglobin, g/dL | 12.5 ± 0.7 | 12.5 ± 0.6 | 14.5 ± 0.3 | 0.9 | < 0.01 | < 0.01 |
| Leukocytes × 106/L | 5,375.6 ± 1,149.4 | 13,802.1 ± 6,976.7 | 7,325.8 ± 628.9 | < 0.01 | < 0.01 | < 0.01 |
| Neutrophils × 106/L | 3,483.9 ± 1,192.6 | 7,974.9 ± 1,994.9 | 4,516.0 ± 563.3 | < 0.01 | 0.2 | < 0.01 |
| Lymphocytes × 106/L | 1,307.6 ± 328.4 | 1,326.1 ± 219.3 | 2,247.9 ± 174.5 | 0.93 | < 0.01 | < 0.01 |
| Eosinophils × 106/L | 193.5 ± 231.2 | 283.2 ± 355.0 | 158.6 ± 31.2 | 0.16 | 0.04 | < 0.01 |
| Platelets × 106/L | 73.9 ± 23.7 | 176.9 ± 21.2 | 239.4 ± 10.4 | < 0.01 | < 0.01 | < 0.01 |
| AST, U/L | 62.0 ± 17.0 | 226.5 ± 153.8 | 27.7 ± 5.2 | 0.28 | < 0.01 | < 0.01 |
| ALT, U/L | 67.4 ± 20.5 | 220.2 ± 141.9 | 26.2 ± 4.2 | 0.89 | < 0.01 | < 0.01 |
| PT (INR), sec | 1.1 ± 0.1 | 2.1 ± 1.9 | 0.94 | |||
| PTT, sec | 48.8 ± 9.2 | 43.3 ± 2.4 | 0.29 | |||
Values are mean ± SD. AST = aspartate aminotransferase; ALT = alanine aminotransferase; PT (INR) = prothrobin time (international normalized ratio); PTT = partial thromboplastin time.
There was no statistically significant correlation of the mean ± SD total parasite count (9,421.6 ± 5,369.7 parasites/mm3) or asexual (7,131 ± 4,289.9 parasites/mm3) or sexual (2,289.7 ± 1,426.0 parasites/mm3) parasite counts with any radiologic findings.
A major limitation of this retrospective study was a possible selection bias, and losses to follow-up were common after complete clinico-laboratory recovery. Moreover, patients who had more severe gastrointestinal symptoms or abnormal laboratory findings would have a higher chance of undergoing CT rather than ultrasonography or clinical observations. We did not perform the analysis on ultrasonographic findings because ultrasonography is an operator-dependent procedure, and a complete examination of the spleen is not always acceptable because of lung shadowing.12 Therefore, this small subgroup of malaria patients may not be representative of all P. vivax malaria patients. A larger-scaled prospective study should be conducted. Another limitation is that pathologic–radiologic correlations were not available. A splenic biopsy was not routinely performed because of the high risk of bleeding because a malaria-infected spleen is congested and bleeds easily.
This study showed that patients with P. vivax malaria more frequently represented splenomegaly and focal low attenuation in the spleen on CT examination than the control and normal groups. Although CT is not mandatory for the diagnostic assessment of malaria, these CT findings will help be useful in the diagnosis of malaria in patients with fever. In malaria-infected patients, abdominal CT may have value in evaluating other abdominal conditions and detecting complications earlier.
Footnotes
Authors' addresses: Eun Mi Kim, Chong Rae Cho, and Yee Gyung Kwak, Ilsan Paik Hospital, Daehwa-dong, IlsanSeo-gu, Goyang-si, Gyeonggi-do, Seoul 411-706 South Korea. Hyeon Je Cho, Mi Young Kim, and Yun Ku Cho, Seoul Veterans Hospital, 6-2, Doonchon-Dong, Gangdong-Gu, Seoul 134-060, South Korea.
References
- 1.Park JW, Klein TA, Lee HC, Pacha LA, Ryu SH, Yeom JS, Moon SH, Kim TS, Chai JY, Oh MD, Choe KW. Vivax malaria: a continuing health threat to the Republic of Korea. Am J Trop Med Hyg. 2003;69:159–167. [PubMed] [Google Scholar]
- 2.Ozsoy MF, Oncul O, Pekkafali Z, Pahsa A, Yenen OS. Splenic complications in malaria: report of two cases from Turkey. J Med Microbiol. 2004;53:1255–1258. doi: 10.1099/jmm.0.05428-0. [DOI] [PubMed] [Google Scholar]
- 3.Jimenez BC, Navarro M, Huerga H, Lopez-Velez R. Spontaneous splenic rupture due to Plasmodium vivax in a traveler: case report and review. J Travel Med. 2007;14:188–191. doi: 10.1111/j.1708-8305.2007.00112.x. [DOI] [PubMed] [Google Scholar]
- 4.Kaur D, Wasir V, Gulati S, Bagga A. Unusual presentation of Plasmodium vivax malaria with severe thrombocytopenia and acute renal failure. J Trop Pediatr. 2007;53:210–212. doi: 10.1093/tropej/fml092. [DOI] [PubMed] [Google Scholar]
- 5.Yagmur Y, Hamdi Kara I, Aldemir M, Buyukbayram H, Tacyildiz IH, Keles C. Spontaneous rupture of malarial spleen: two case reports and review of literature. Crit Care. 2000;4:309–313. doi: 10.1186/cc713. [DOI] [PMC free article] [PubMed] [Google Scholar]
- 6.Bezerra AS, D'Ippolito G, Faintuch S, Szejnfeld J, Ahmed M. Determination of splenomegaly by CT: is there a place for a single measurement? AJR Am J Roentgenol. 2005;184:1510–1513. doi: 10.2214/ajr.184.5.01841510. [DOI] [PubMed] [Google Scholar]
- 7.Erturk SM, Mortele KJ, Binkert CA, Glickman JN, Oliva M-R, Ros PR, Silverman SG. CT features of hepatic venoocclusive disease and hepatic graft-versus-host disease in patients after hematopoietic stem cell transplantation. AJR Am J Roentgenol. 2006;186:1497–1501. doi: 10.2214/AJR.05.0539. [DOI] [PubMed] [Google Scholar]
- 8.Bae K, Jeon K-N. CT findings of malarial spleen. Br J Radiol. 2006;79:e145–e147. doi: 10.1259/bjr/46185784. [DOI] [PubMed] [Google Scholar]
- 9.Kawai S, Ikeda E, Sugiyama M, Matsumoto J, Higuchi T, Zhang H, Khan N, Tomiyoshi K, Inoue T, Yamaguchi H, Katakura K, Endo K, Matsuda H, Suzuki M. Enhancement of splenic glucose metabolism during acute malarial infection: correlation of findings of FDG-PET imaging with pathological changes in a primate model of severe human malaria. Am J Trop Med Hyg. 2006;74:353–360. [PubMed] [Google Scholar]
- 10.Tangpukdee N, Yew HS, Krudsood S, Punyapradit N, Somwong W, Looareesuwan S, Kano S, Wilairatana P. Dynamic changes in white blood cell counts in uncomplicated Plasmodium falciparum and P. vivax malaria. Parasitol Int. 2008;57:490–494. doi: 10.1016/j.parint.2008.06.005. [DOI] [PubMed] [Google Scholar]
- 11.Makkar RP, Mukhopadhyay S, Monga zA, Gupta AK. Plasmodium vivax malaria presenting with severe thrombocytopenia. Braz J Infect Dis. 2002;6:263–265. doi: 10.1590/s1413-86702002000500008. [DOI] [PubMed] [Google Scholar]
- 12.Gorg C, Colle J, Gorg K, Prinz H, Zugmaier G. Spontaneous rupture of the spleen: ultrasound patterns, diagnosis and follow-up. Br J Radiol. 2003;76:704–711. doi: 10.1259/bjr/69247894. [DOI] [PubMed] [Google Scholar]