Abstract
There is controversy as to whether low levels of radiation (i.e., < 5 rem) pose a health risk. This brief inquiry compares archived cancer mortality data in counties having relatively low (0–250 feet above sea level), medium (500–1000 feet above sea level), and high (3000+ feet above sea level) elevations also having corresponding greater natural background levels of radiation respectively. Cancer mortality was found to be lowest in the high elevation counties (mean = 58.2) followed by low elevation counties (67.5) and then medium elevation counties (70.4). Statistically significant differences were found between low –high elevations (p = 0.003), and medium – high elevations (p = 0.010), but not between low and medium elevations (p = 0.5). More rigorous research, with an accounting of confounding variables, is indicated.
Keywords: Radiation effects, background radiation, cancer, mortality, Texas
INTRODUCTION
There are different viewpoints on whether low level ionizing radiation (i.e., < 5 rem) poses a health risk. One view is that exposure to low level radiation is thought to be a cause of cancer (Abrams, 2006). Other views regarding effects of low level radiation exposure, such as that received from the natural background radiation (NBR), range from innocuous (Allright et al, 1983) to beneficial (Jagger, 1998; Luckey, 2006; Scott, 2008). In addition, Hendry et al (2009) found that many studies on NBR revealed no increased risk of cancer mortality in high natural background areas when all cancer deaths were assessed. This ecological study of archived data from the National Cancer Institute compares cancer mortality rates in counties having low, medium and high elevations in Texas. Lower elevation areas contain NBR levels that are lower than higher elevation areas (US NRC, 2009). Since this is an ecological study, no inferences of causation can be made. The state of Texas was selected due to its plentiful number of counties in varying levels of elevation.
METHODS
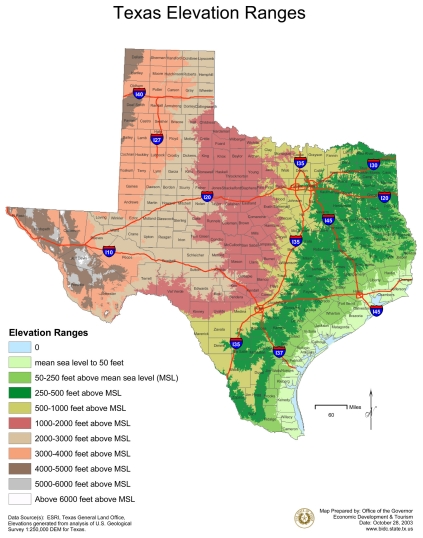
Three categories of elevations were used; low, medium, and high. Elevations were assessed by viewing a map provided by Office of the Governor Rick Perry (Texas, 2003; Figure 1). Counties having elevations between 0–250 feet above sea level for approximately three-fourths or more of its area were categorized as low elevation counties and these were observed in the Gulf coast area. The second group of counties, referred to as medium elevation counties, had elevations ranging from 1000 to 2000 feet above sea level for approximately three-fourths or more of its area. The third group of counties, referred to as high elevation counties, had a minimum elevation of 3000 feet above sea level (most of which did not exceed 5000 feet) for approximately three-fourths or more of its area.. The mrem of NBR (cosmic and terrestrial) were estimated as follows: low = 51, medium = 54, and high = 58 (US NRC, 2009.). These levels do not include other sources of radiation such as type of home and diet (US NRC, 2009.). Other locations in the U.S. having an elevation of 1000–2000 feet would have an estimated annual dose of NBR of 77 mrem NBR (not including other radiation factors such as type of home and diet) (US NRC, 2009). Only counties in the lowest elevation category (0–250 feet above sea level) and highest elevation category (3000+ feet above sea level) were included in this study. Counties with elevations in between these categories, which consisted of the majority of Texas counties, were excluded since this study sought to assess possible effects due to elevation by comparing their extremes.
FIGURE 1.
Texas elevation map (Texas, 2003). Low elevation counties located in the Gulf coast area (approximately the first two rows of counties closest to the coast). Proceeding northwest, the medium elevation counties can be found followed by high elevation counties in the northwest part of the state. (Please see Table 1 for specific county names).
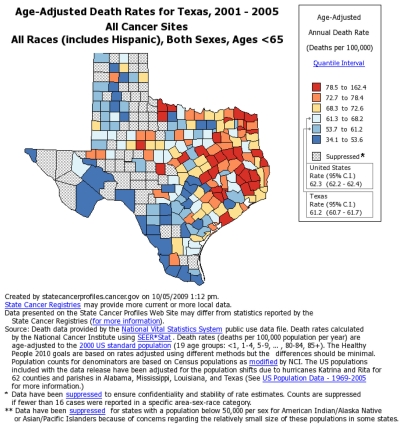
Age-adjusted cancer mortality, per 100,000 population, all-sites cancer, all races, both genders, and under the age of 65 years, for 2001–2005, was obtained from the National Cancer Institute (NCI) archived data for the Texas counties (NCI, 2009a, Figure 2). The author used this age category (of < 65 years old) because he was interested in the mortality rate below the age of: a) life expectancy, which in 2004 was 77.8 (75.2 for males and 80.4 for females) (U.S., 2007) and b) the median age at the time of death for all-sites cancer, which was 73 years of age from 2002–2006 (NCI, 2009b). Some counties did not report mortality rates due to low death counts so those counties obviously were not included in the study. Twenty-one counties that also had a reportable death rate value were identified in the low elevation category while 22 counties were identified in the medium and high elevation categories (Table 1). More counties could have been added in the medium elevation category (the selection began in the southern part of the state, bordering low elevation counties, and proceeded north) but the author wanted to keep the number of counties in each group the same. Summary data values are provided in Table 1.
FIGURE 2.
Cancer map, by county, from National Cancer Institute (NCI, 2009a). Low elevation counties located in the Gulf coast area (approximately the first two rows of counties closest to the coast). Proceeding northwest, the medium elevation counties can be found followed by high elevation counties in the northwest part of the state. (Please see Table 1 for specific county names).
TABLE 1.
Cancer mortality by category and county.
| Low elevation |
Medium elevation |
High elevation |
|||
|---|---|---|---|---|---|
| County | Cancer | County | Cancer | County | Cancer |
| 1. Aransas | 72.5 | 1. Bandera | 62.8 | 1. Andrews | 55 |
| 2. Brazoria | 68.9 | 2. Blanco | 64.5 | 2. Bailey | 58.2 |
| 3. Calhoun | 73.1 | 3. Bosque | 59.8 | 3. Brewster | 52.4 |
| 4. Cameron | 48 | 4. Burnet | 68.9 | 4. Carson | 53.2 |
| 5. Chambers | 69.7 | 5. Cooke | 75 | 5. Dallam | 59.5 |
| 6. Ft. Bend | 45.6 | 6. Coryell | 59.4 | 6. Deaf Smith | 54.6 |
| 7. Galveston | 75.1 | 7. Denton | 46 | 7. El Paso | 51.6 |
| 8. Hardin | 82.7 | 8. Grayson | 71.8 | 8. Floyd | 60 |
| 9. Harris | 60 | 9. Hays | 48.6 | 9. Gaines | 65.8 |
| 10. Jackson | 65.7 | 10. Hood | 76 | 10. Hale | 42.7 |
| 11. Jefferson | 70.3 | 11. Johnson | 68 | 11. Hansford | 65 |
| 12. Kleberg | 65.9 | 12. Kendall | 64.1 | 12. Hockley | 60.8 |
| 13. Liberty | 91.1 | 13. Kerr | 73.2 | 13. Lamb | 60.1 |
| 14. Matagorda | 83 | 14. Lampasas | 70.9 | 14. Lubbock | 66.9 |
| 15. Nueces | 61.9 | 15. Llano | 68.2 | 15. Lynn | 54.1 |
| 16. Orange | 72 | 16. Maverick | 51.1 | 16. Moore | 50.4 |
| 17. Refugio | 57.6 | 17. Medina | 49.3 | 17. Parmer | 61 |
| 18. San Patricio | 68.3 | 18. Montague | 78.2 | 18. Potter | 77.7 |
| 19. Victoria | 56.8 | 19. Parker | 61.3 | 19. Randall | 49 |
| 20. Wharton | 72.2 | 20. Uvalde | 60.7 | 20. Swisher | 50.7 |
| 21. Willacy | 56.9 | 21. Wise | 71.9 | 21. Terry | 59.4 |
| 22. Zavala | 60.7 | 22. Yoakum | 72.6 | ||
| Mean | 67.5 | 70.4 | 58.2 | ||
| Median | 68.9 | 66.8 | 58.8 | ||
Low elevation counties = 0–250 feet above sea level. Medium elevation = 500–1000 feet above sea level. High elevation counties = 3000+ feet above sea level. Cancer = annual cancer deaths per 100,000 persons (below age 65) during the rate period 2001–2005 (NCI, 2009a).
Data analysis
A test for statistically significant differences was performed in SAS 9.2 (Cary, NC). The data were assessed for normal distribution according to the skew value. Accordingly, data that showed values between −2 and +2 skew values were considered to be not significantly different from normal distribution (Garson, 2009). The data fell within this range with the exception of medium elevation cancer data, and this was only slightly out- side the range (skew value of 2.02). Consequently, a two sample, two-tailed t-test was performed. Since multiple tests for statistical significance were performed (n = 3 in this study; low versus medium, low versus high, and medium versus high), a Bonferroni correction was applied to the alpha level, where the traditional alpha of 0.05 is divided by the number of tests performed (General FAQ, 2009). The adjusted alpha = 0.016 (0.05/3).
RESULTS
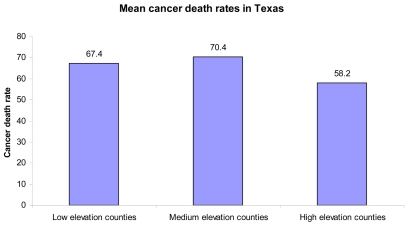
Mean cancer death rates per 100,000 persons were as follows: low elevation = 67.5, medium elevation = 70.4, and high elevation = 58.2. Statistically significant differences were found between low and high elevations (p = 0.003); and medium and high elevations (p = 0.010); but not between low and medium elevations (p = 0.5) (Tables 1 and 2; Figure 3.
TABLE 2.
Cancer mortality per 100,000 persons and p-values by elevation
| p-value | |
|---|---|
| Low elevation death rate (67.5) versus medium elevation death rate (70.4) | 0.5 |
| Low elevation death rate (67.5 versus high elevation death rate (58.2) | 0.003 |
| Medium elevation death rate (70.4) versus high elevation death rate (58.2) | 0.010 |
Bonferroni-adjusted alpha = 0.016. High elevation counties showed statistically fewer death rates compared to medium and low elevation counties.
FIGURE 3.
Cancer mortality rates in low, medium, and high elevation counties in Texas. Statistically significant differences were found between low and high elevations (p = 0.003); and medium and high elevations (p = 0.010); but not between low and medium elevations (p = 0.5).
DISCUSSION
This study found that among the three county elevation categories, high elevation counties (with theoretically the highest amount of NBR) revealed significantly fewer cancer death rates (58.2) compared to the low (67.5) and medium (70.4) elevation categories. Although the highest cancer death rate was found in the medium rather than low elevation counties, which is seemingly contrary to hormesis theory, this may be due to random variation of the numbers in view of the lack of statistical significance between low and medium elevation county categories. For comparison purposes, the national rate, using the same criteria (same time period, same demographics, etc), was 62.3 deaths per 100,000 population (NCI, 2009a). The difference in death rates may due to radiation hormesis (Jagger, 1998; Luckey, 2006; Scott, 2008) though ecological studies such as this cannot provide causal links.
A similar study on Radon by Cohen (1995), which found less lung cancer mortality rates in higher radon areas, has been challenged, in part, because it was an ecological study. Ecological studies such as this are often the first step in regard to relatively new areas of inquiry (Grimes and Schulz, 2002). There are however, important limitations to ecological studies, such as the inability to draw causal links between exposure and outcomes (Grimes and Schulz, 2002). Other limitations to the study include the following: a) Confounding variables not considered for both regions (high versus low elevation) such as the level of access to health care, type of home (for which radiation levels can vary), levels of income and educational attainment, percent of population living in metropolitan versus rural areas (may be more pollution in the metropolitan areas), and smoking habits; b) the method of assessing whether the specified elevation is present in at least ¾ of the county is not arbitrary and not exact.
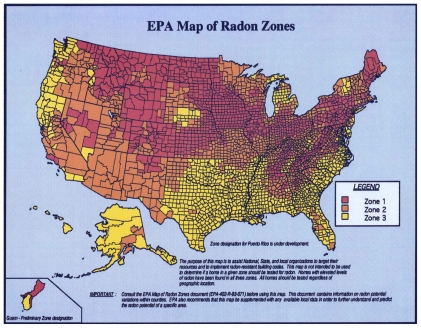
The question may also arise as to what role radon levels might have in cancer mortality. A non-statistical visual assessment of a radon map reveals a tendency for higher levels of radon to exist in counties having high elevation (northwest part of the state) rather than low elevation counties (southeast part of the state) (EPA, 2009; Figure 4). Consequently, it does not appear that radon would be a factor in the greater mortality rates in low elevation counties.
FIGURE 4.
Radon map for U.S. provided by EPA (EPA, 2009). Yellow areas in low elevation region is the lower radon area while the orange-ish colored area in Texas, in the northwest part of the state is the higher radon area.
Color legend: Dark red = > 4 pCi/L; Orange = Between 2 and 4 pCi/L; Yellow = < 2 pCi/L.
CONCLUSION
In this ecological study of archived data, there were lower cancer death rates in counties having relatively high elevations (and therefore relatively high levels of natural background radiation) compared to lower elevation counties (which have lower levels of natural background radiation), and this difference was statistically significant. More rigorous study into the effects of natural background radiation that accounts for confounding variables is indicated.
REFERENCES
- Abrams HL. Cancer risk following exposure to low level radiation. Center for International Security and Cooperation. Stanford University; 2006. [Cited 2009 Jun 4]. Available from: http://cisac.stanford.edu/events/cancer_risk_following_exposure_to_low_level_radiation/ [Google Scholar]
- Allright SP, Colgan PA, McAulay IR, Mullins E. Natual background radiation and cancer mortality in the Republic of Ireland. International Journal of Epidemiology. 1983;12(4):414–418. doi: 10.1093/ije/12.4.414. [DOI] [PubMed] [Google Scholar]
- Cohen B. Test of the linear-no threshold theory of radiation carcinogenesis for inhaled radon decay products. Health Physics. 1995;68:157–174. doi: 10.1097/00004032-199502000-00002. [DOI] [PubMed] [Google Scholar]
- EPA map of radon zones. United States Environmental Protection Agency; 2009. Jul 1, [Cited 2009 Oct 1]. Available from: http://www.epa.gov/radon/zonemap.html#mapcolors. [Google Scholar]
- Garson G. Statnotes. [Internet] North Carolina State University; 2009. Testing of assumptions. [Cited 2009 Feb 27]. Available from: http://faculty.chass.ncsu.edu/garson/PA765/assumpt.htm. [Google Scholar]
- General FAQ #29. Adjusted Bonferroni Comparisons. University of Texas; Austin: 2009. [Internet]. [Cited 2009 May 27]. Available from: http://ssc.utexas.edu/consulting/answers/general/gen29.html. [Google Scholar]
- Grimes DA, Schulz KF. Descriptive studies: what they can and cannot do. The Lancet. 2002;359:145–149. doi: 10.1016/S0140-6736(02)07373-7. [DOI] [PubMed] [Google Scholar]
- Hendry JH, Simon SL, Wojcik A, Sohrabi M, Burkart W, Cardis E, Laurier D, Tirmarche M, Hayata I. Human exposure to high natural background radiation: what can it teach us about radiation risks. Journal of Radiological Protection. 2009;29:A29–A42. doi: 10.1088/0952-4746/29/2A/S03. [DOI] [PMC free article] [PubMed] [Google Scholar]
- Jagger J. Natural background radiation and cancer death in Rocky Mountain States and Gulf Coast states. Health Physics. 1998;75(4):428–430. doi: 10.1097/00004032-199810000-00012. [DOI] [PubMed] [Google Scholar]
- Luckey TD. Radiation hormesis: the good, the bad, and the ugly. Dose Response. 2006;4 (3):169–190. doi: 10.2203/dose-response.06-102.Luckey. [DOI] [PMC free article] [PubMed] [Google Scholar]
- National Cancer Institute (NCI) Age-adjusted death rates for Texas, 2001–2005. State cancer profiles. 2009a. [Cited 2009 Oct 5]]. Available from: http://statecancerprofiles.cancer.gov.
- National Cancer Institute (NCI) Surveillance Epidemiology and End Results. National Cancer Institute; 2009b. SEER Stat Fact Sheets. [Cited 2009 Oct 5]. Available from: www.seer.cancer.gov. [Google Scholar]
- Scott BR. Evidence for radiation hormesis after in vitro exposure of human lymphocytes to low doses of ionizing radiation. Dose Response. 2008;6:252–271. doi: 10.2203/dose-response.07-024.Rithidech. [DOI] [PMC free article] [PubMed] [Google Scholar]
- U.S. Nuclear Regulatory Commission (NRC) Personal annual radiation dose calculator. 2009. [Cited 2009 Nov 20]. Available from: http://www.nrc.gov/about-nrc/radiation/around-us/calculator.html.
- Texas elevation range. Office of the Governor Rick Perry. Economic Development and Tourism; 2003. [elevations from USGS data] [Cited 2009 Dec 9]. Available from: http://governor.state.tx.us/files/ecodev/bidc/maproom/txmaps/ElevationRanges.pdf. [Google Scholar]
- United States Life Tables, 2004. National Vital Statistics Report. 9. Vol. 56. Centers for Disease Control and Prevention; 2007. [Cited 2009 Oct 5] Available from: www.cdc.gov. [PubMed] [Google Scholar]


