Abstract
For ionization radiation (IR) induced cancer, a linear non-threshold (LNT) model at very low doses is the default used by a number of national and international organizations and in regulatory law. This default denies any positive benefit from any level of exposure. However, experimental observations and theoretical biology have found that both linear and J-shaped IR dose-response curves can exist at those very low doses. We develop low dose J-shaped dose-response, based on systems biology, and thus justify its use regarding exposure to IR. This approach incorporates detailed, molecular and cellular descriptions of biological/toxicological mechanisms to develop a dose-response model through a set of nonlinear, differential equations describing the signaling pathways and biochemical mechanisms of cell cycle checkpoint, apoptosis, and tumor incidence due to IR. This approach yields a J-shaped dose response curve while showing where LNT behaviors are likely to occur. The results confirm the hypothesis of the J-shaped dose response curve: the main reason is that, at low-doses of IR, cells stimulate protective systems through a longer cell arrest time per unit of IR dose. We suggest that the policy implications of this approach are an increasingly correct way to deal with precautionary measures in public health.
Keywords: ionizing radiation, dose-response, hormesis, cell-cycle checkpoint, incidence rates, precautionary policy
INTRODUCTION
National federal laws direct cancer risk-based management of societal choices regarding exposure to many substances, the production of energy, and the commercialization of products: environmental protection (EPA), occupational protection (OSHA), consumer protection (CPSC), drugs and cosmetics use (FDA), and so on. A parallel approach occurs throughout the OECD countries, including the European Union with its REACH program. It is also well established that different agencies may use different risk management approaches but the regulatory model of choice, implicitly or explicitly, is the linear at low-doses (LNT) cancer dose-response model. The regulatory models are characterized by a linear function in which response is proportional to dose (or dose rate), roughly at risks below 0.01. However, particularly since 2005 (i.e., the US EPA Cancer Guidelines) there is an increasing legal recognition that alternative models to the LNT can be appropriate, provided sufficient evidence is available to justify such choices. The problem remains: which of many competing models is the superior one and why? This is an important question because society faces a serious and very costly precautionary philosophy. It consists of agencies having adopted a causal default assumption to regulate cancer risks at very low doses using models that have little current theoretical and empirical validity: these models are linear at very low doses.
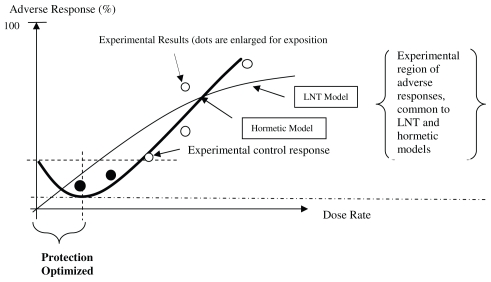
The precautionary paradox is that these defaults result in regulatory costs (measured in dollars) that can be disproportionate with the benefits (the supposed reduction in the incidence of cancers) because – in the vast majority of the instances known to us and documented by Calabrese (Calabrese and Ricci, 2010) – the defaults deny any health benefit from those low dose exposures even when these benefits are demonstrable (this is summarized, for cancers, in Figure 1). As we summarize in Figure 1, the remarkable point in the choice of model is that, when the J-shaped dose-response is correct, the regulatory concept of one in a million cancer risk becomes irrelevant. This is not an issue of uncertainty demanding precaution: rather, it is the opposite situation: it is the paradox where more certainty exists but it is neglected for the sake of a simplifying assumption that cannot be demonstrated. This is a result from assessing low exposures and infinitesimally low probabilities of cancer against generally much larger background cancer rates and by defining acceptable risks that are stated as one in a million (individual excess lifetime cancer risk) or as a range from one in a million to one in ten thousand. These regulatory probabilities are used to set – given models of dose-response –acceptable exposures to many carcinogens.
FIGURE 1.
Biphasic (hormetic) Dose-response Model for Cancer Incidence the percent response in the controls must be non-zero). Protection is “optimized” because it is greatest at a dose range furthest away from a non-zero percentage response in the controls. The black dots identify exposure-response points that are – or should be – included in any complete analysis otherwise the empirical relationship based on the white dots) cannot be falsified.
Choosing between different causal models for regulatory law and policy involves reasoning about the causal effect of exposure to low dose rates of pollutants on the incidence of cancer: this causal analysis involves complex biological pathways, genetics, molecular and cellular models that are formalized mathematically as differential equations, which then require statistical estimation. This is the essence of our work and its demonstration of J-shaped behaviors at low doses. Fundamentally, there is a bitter but necessary pill that must be swallowed: rigorous analysis is the norm, rather than the exception. If an assumption of biological behavior cannot be demonstrated – as is the case for the LNT (at very low dose or dose rates) — its use should be an exception because that default is not precautionary: it denies benefits when these exist.
Ionizing Radiations, LNT and Byphasic (Hormetic) Cancer Models
Ionizing radiation (IR) causes DNA damage that, if not adequately repaired, results in pro-carcinogenic mutations and eventually cause cancer (Little, 2003). For IR induced dose response of mutation, investigators usually use a linear non – threshold (LNT) model to estimate it (Upton, 2002). Some epidemiological studies use a linear-quadratic model in which radiogenic effects are linearly dependent at low doses and then become quadratic at higher doses (Edwards, 1986): they cannot admit J-shaped responses. Such models are used because sound, quantitative, mechanism based computational models linking the initial IR-induced damage with mutation and tumor formation are lacking. In some instances, statistical models such as these have been able to reproduce a J-shaped dose-response model, but this occurs only when the number of data is sufficiently large (Ricci et al. submitted).
Radiologists have attempted to estimate health risks from low doses of radiation for decades. Low dose IR exposure is particularly important for health risk because environmental and occupational exposure to IR generally lies in the low dose region. The LNT and linear non-quadratic dose response suggests that the biological effect of IR is proportional to dose even at very low dose. However, studies at low dose IR regions pose challenges to the default linear dose-response assumption. These studies include bystander effects, adaptive responses and low dose hypersensitivity (Bonner, 2004; Mothersill and Seymour, 2004a; Mothersill and Seymour, 2004b). In the adaptive response, for example, the cellular transformation frequency in the low dose region is reduced relative to controls (Azzam et al. 1996; Redpath and Antoniono, 1998; Redpath et al. 2001). It usually generates a J-shaped dose response at low dose, which is often referred to as hormesis. Therefore, consideration of mechanistically-based dose-response models for health risk has been found to be essential for assessing the potential impact of the confounders on the response at low, environmental doses (Bonner, 2004; Preston, 2005; Slikker et al. 2005).
Some radiation carcinogenesis models have been developed and implemented in recent years to include mechanistic aspects up to some level (Yakovlev and Polig, 1996; Wheldon et al. 2000; Ohtaki and Niwa, 2001; Heidenreich et al. 2002; Little et al. 2002; Mebust et al. 2002; Moolgavkar and Luebeck, 2003; Pierce, 2003; Sachs et al. 2005). Some of these are variants of clonal growth model (Heidenreich et al. 2002; Little et al. 2002; Moolgavkar and Luebeck, 2003; Sachs et al. 2005). Others include deterministic mathematical models (Wheldon et al. 2000), biophysical models (Mebust, et al. 2002), two-stage logistic models (Sachs et al. 2005) and stochastic process models (Yakovlev and Polig, 1996; Ohtaki and Niwa, 2001). These models can include cellular birth-death processes that are important determinants of dose-response behaviors in carcino-genesis (Wheldon et al. 2000), and account for the effects of exposure on genomic instability (Ohtaki and Niwa, 2001) and intercellular interaction (Sachs et al. 2005). None of these models, however, describe the molecular-level mechanisms that define how IR exposure leads to alterations in gene and protein expression and cellular outcomes.
Systems Approach
Recent reviews emphasize the new opportunities in dose response modeling afforded by developments in computational systems biology (Andersen et al. 2005a; Andersen et al. 2005b; Slikker et al. 2005). Systems biology is defined as a comprehensive quantitative analysis of the manner in which all the components of a biology system interact functionally over time (Aderem, 2005). Putting toxicology in a systems biology context involves the study of perturbations by environmental stressors on the gene and protein expressions and linking these perturbations to toxicological outcome. The incorporation of computational systems biology in dose response modeling requires modular description of the functional interactions of normal biology system and the perturbation of the normal biology by stressors (Andersen et al. 2005b).
To incorporate systems biology approach into the development of dose-response cancer models, simulation-based analysis is a distinct branch: model behavior is first compared with experimental observations; models that survive initial testing can be then used to explore questions by targeted experimentation or by simulation for situation that are not amenable to direct study (Kitano, 2002). Simulation-based study can provide better linkage between dose response behavior and the underlying molecular mechanism.
The objectives of this article are (1) to demonstrate a computational systems biology approach to modeling IR dose response; (2) to explore the pros and cons of this new approach through a practical study; (3) and to identify technical and practical challenges that arise in developing these models.
METHODOLOGY
As an early example to integrate systems biology approach into dose response modeling, this study integrates cell cycle checkpoint arrest by IR-mediated DNA damage into IR induced transformation frequency in two-stage clonal growth model (Moolgavkar and Knudson, 1981). We take this approach and extend it below.
Integration of Computational Systems Biology Approaches in Dose Response Modeling
Traditional dose response models generally implements a linear structure and focuses on toxicology, i.e., the perturbation caused by environmental stressor (Andersen, et al. 2005b). Figure 2 depicts the linkage of physiologically based pharmacokinetic (PBPK) and pharmacodynamic (PD) models to predict the effect of dose on response. PBPK models describe exposure to the biologically effective dose and calculate the form of the chemical/metabolite that is causative for the biological mode of action describes early biological response to the active dose; and the PBPD model describes how the toxic dose affects the body to cause altered structure/function and ultimately disease.
FIGURE 2.
Linear structure of linking PBPK and PD models to predict dose response.
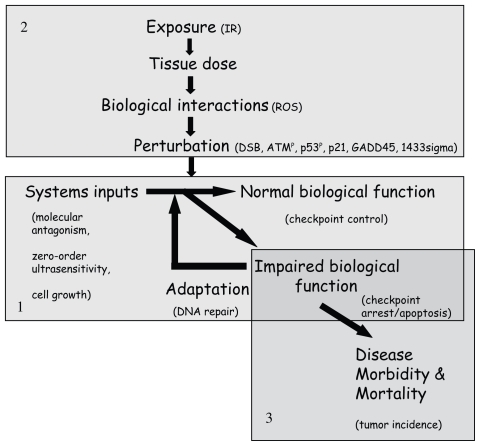
Compared to the traditional approaches of dose response modeling, computational systems biology approach implements a more complex structure, as shown in Figure 3. Here, a modular approach was used to illustrate this structure. Different modules describe different biological processes. Module 1 captures the normal “biology” describing how normal biological functions arise from relevant biological elements that together are called systems inputs; Module 2 captures the “perturbation” and links the perturbation to altered biological targets (e.g. proteins) that have direct influence on the normal biological system; Module 3 focuses on the “response” and disease outcome describing a process which links lower level impaired function to higher level malfunctions and diseases. The “biology” module can be any process directly damaged by the mode of action and deemed to play a significant role on dose response relationship. Therefore, incorporation of the maintenance of normal biological function is the key advantage of integration of computational systems biology approach in dose response modeling. In this manner, this approach enables a direct linkage between normal biology and toxicology.
FIGURE 3.
Schematic of integration of computational systems biology approaches in dose response modeling. Module 1, “biology” module; Module 2, “perturbation” module; Module 3, “response” module. Specific targets in current model are indicated in brackets.
Inclusion of Cell Cycle Model as the “Biology” Module
Cell cycle control is a basic function of a cell. Study of the dynamics of cell cycle regulation is one area of systems biology. Both experimentalists and modelers have made considerable progress in this area (Kohn, 1998; Tyson et al. 2002; Qu, et al. 2003a; Qu, et al. 2003b; Blais and Dynlacht, 2005; Chen et al. 2004; Sveiczer et al. 2004; Zwolak et al. 2005).
A normal cell cycle contains G1, S, G2, and M phases. S represents DNA synthesis; M represents mitosis, which includes prophase, metaphase, anaphase and telophase. S and M phases are separated by two gaps: G1 and G2. Proper progression through the cell cycle is assured by “checkpoints” that guard crucial transitions: G1 to S transition (G1/S checkpoint), G2 to M transition (G2/M checkpoint) and metaphase to anaphase transition (spindle checkpoint). Checkpoint control is a surveillance mechanism in cell cycle regulation that ensures suitable conditions for the transitions to occur. The G1/S checkpoint makes sure that (1) cells are large enough for a new round of DNA synthesis, (2) any damage suffered by the DNA has been repaired, and (3) external conditions are favorable for mitotic cell divisions. The G2/M checkpoint makes sure that (1) DNA is fully replicated, (2) any new damage sustained by the DNA has been repaired, and (3) the cell is large enough to divide. The spindle checkpoint control ensures that chromosomes are properly aligned on the mitotic spindle before the cohesins are degraded (Tyson et al. 2002).
IR, an important stressor, induces DNA damage and may disrupt cell cycling through activating several proteins which have direct interactions with cell cycle regulatory genes. These interactions lead to checkpoint arrest and apoptosis; checkpoint arrest allows time for DNA to repair. The delay at checkpoint lengthens the cell cycle and thus decreases cell proliferation. Cell proliferation rate directly influences the number of mutated neoplastic cells and is usually an essential factor in computational cancer modeling. Therefore, if checkpoint control is taken as the normal biological function in Figure 3, checkpoint arrest and apoptosis are perturbed functions caused by IR- mediated DNA damage, and DNA repair is an adaptation process. Checkpoint arrest induced decrease in cell proliferation rate will influence organism level response, i.e., cancer incidence. Hence, it is essential to include a cell cycle model as a “biology” module in systems biology approach based IR dose response modeling for cancer, to account for the effect of checkpoint arrest on cell proliferation rate. The inclusion of a cell cycle model adds more realism to the dose response modeling and helps explore the biological mechanisms of specific phenomena (e.g. hormesis) at low doses, which is impossible when the default model (LNT at low doses) is in fact an interpolation from the experimental data to the (0,0) point on the dose and cumulative probability of response coordinates.
Several mathematical cell cycle models have been developed to study physiology of the normal cell cycle (Csikasz-Nagy et al. 2009; Han et al. 2005; Li, et al. 2009; Novak et al. 1998; Novak et al. 2001; Tyson and Novak, 2001; Qu et al. 2003a; Qu et al. 2003b; Qu et al. 2004; Zamborszky et al. 2007). In this study, cell cycle modeling serves as the module of “biology” to support dose response modeling. Therefore, our implementation is simplified to capture key nodes in the signaling pathway and remain capable of modeling checkpoint control compared to existing cell cycle models. Furthermore, to support the whole structure of the new approach for dose response modeling (Fig. 3), the systems inputs of checkpoint control must provide a direct linkage to toxicological perturbation. Therefore, appropriate identification of systems inputs in checkpoint control is needed.
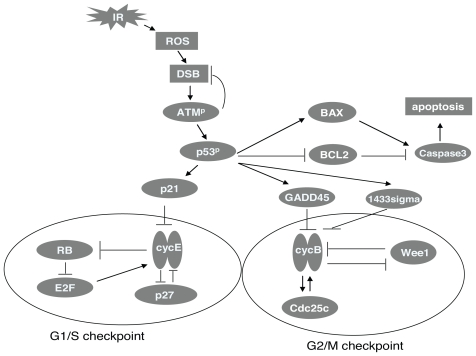
The identification of cell cycling inputs is based on the study of the cell cycle model developed by Tyson (Tyson and Novak, 2001; Tyson et al. 2001; Tyson et al. 2002). Molecular antagonism or positive feedback, cell growth and zero-order ultra-sensitivity were essential for checkpoint control (Tyson and Novak, 2001; Novak et al. 2007). With antagonism, a key protein (A) would regulate cell cycle transition, A has a counteractive protein B which represses the activity of A and is also simultaneously inhibited by A. The mutual antagonism between A and B ensures an irreversible transition. Furthermore, positive feedback can be taken as dual antagonism reaction and thus also assist irreversible transition. Perturbation signals (e.g. proteins activated by IR) directly interacting with A or B are thus necessary nodes in the “perturbation” module. Progress from one cell phase to next is promoted by cell growth (represented by cell mass m). Based upon existing cell cycle models and associated mathematical analysis, a zero-order ultra-sensitivity switch must exist in the antagonism reaction in order to make the dynamics of the checkpoint regulation occur (Tyson and Novak, 2001; Tyson et al. 2002, Kapuy et al. 2009). In zero-order ultra-sensitivity circuit, which often involves an enzymatic inter-conversion between a substrate and a product, switching occurs when the enzymes are saturated by the substrate and/or product (Goldbeter and Koshland, 1981; Goldbeter and Koshland, 1984). Here the zero-order ultra-sensitivity switch is identified as the third element of systems input essential for checkpoint control. Mathematical explanations of mutual antagonism and for the zero-order ultra-sensitivity switch are shown in Results. Molecular interactions of cell cycle regulation and the signaling pathways of IR induced perturbation used in the current model are shown in Figure 4. In brief, the antagonism reaction governing G1/S checkpoint in the model takes place between CycE and Rb and the antagonism reaction governing G2/M checkpoint in the model takes place between CycB and Wee1. Its computer codes are available from the author4. A detailed biochemical description of the signaling pathway and its associated mathematical model are elsewhere (Zhao and Conolly, 2010).
FIGURE 4.
Signaling pathway of checkpoint control and IR-induced perturbation (The antagonism reaction governing G1/S checkpoint in the model takes place between CycE and Rb and the antagonism reaction governing G2/M checkpoint takes place between CycB and Wee1. P27 and Cdc25 contribute to the two checkpoint transitions, respectively. To describe the perturbation caused by IR, IR first induces double strand break (DSB), then DSB activates ATM by autophosphorylation. Phosphorylated ATM (ATMp) has repair function to DSB and it can also phosphorylate and activate the transcriptional factor p53. Activated p53p then transcriptionally activates p21, GADD45 and 1433 sigma. These are the genes that repress G1/S and G2/M transitions. p53 dependent signaling also mediates the entry into the apoptotic pathway through regulation of Bax and Bcl-2. Bax is pro-apoptotic and is transcriptionally activated by p53. Bcl-2 is anti-apoptotic and is transcriptionally repressed by p53. Both Bax and Bcl-2 signal to caspases, which are proteases at the core of the apoptotic machinery).
Mathematical Model
The mathematical model consists of a set of nonlinear ordinary differential equations (ODE) describing the rates of changes in protein activities and cell mass. The absorbed dose rate of IR, represented by IRR, is the input variable. In the model, the rate of change in cell mass is described as a logistic function,
| (1) |
where m = cell mass, μ = growth rate constant, and mmax = maximum size to which a cell may grow if it does not divide.
Specific targets in the model have been identified for the Schematic and are shown in brackets in Figure 3. ROS is taken as the product of initial biological interaction from IR exposure; Subsequent changes in DSB, activated ATMp, p53p, p21, GADD45 and 1433sigma are downstream perturbations to the cell and will finally impair normal biological function –checkpoint control.
In the following section, we link the IR response and cell cycle model. Because G1/S and G2/M checkpoints are independent of each other, they are separately simulated. The combination of G1/S checkpoint and “perturbation” module is referred to as “G1/S checkpoint-perturbation” submodel; the combination of G2/M checkpoint and “perturbation” module is referred to as “G2/M checkpoint-perturbation” submodel.
“Response”
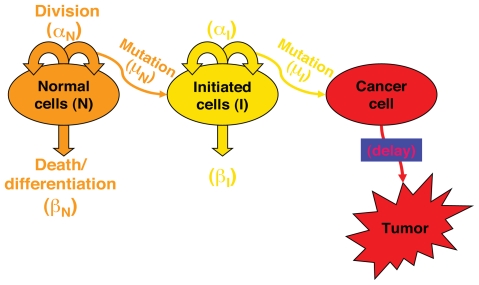
As a “response” module in Figure 3, the impaired function simulated by the IR perturbed cell cycle model was linked to a two-stage clonal growth model (Figure 5) to investigate the dose response for IR induced cancer. The linkage resides in direct relationship between checkpoint arrest and cell proliferation rate. The two-stage clonal growth model used for this analysis is identical in its biological structure to other two-stage models (Moolgavkar and Knudson, 1981; Cohen and Ellwein, 1990), describing populations of normal cells and of intermediate cells with one mutation. Mutations occurs during the process of cell division, so that the mutation parameter (μ) is a probability of mutation per cell division. A tumor cell arises when an intermediate cell acquires a second mutation. The equations of the two-stage clonal growth model are represented by Equations (2), (3) and (4):
FIGURE 5.
Description of two-stage cellular clonal growth model of cancer.
The mathematical model associated with the description in Figure 5 is:
| (2) |
| (3) |
| (4) |
Where:
p is the probability for a specified response (such as tumor)
N is the number of normal cells
αN is the division rate constant for normal cells (hour−1)
βN is the death rate constant for normal cells (hour−1)
μN is the probability of mutation per division for normal cells
I is the number of intermediate cells
αI is the division rate constant for intermediate cells (hour−1)
βI is the death rate constant for intermediate cells (hour−1)
μI is the probability of mutation per division for intermediate cells
The product of αN and μN represents mutational fraction per unit time. The cell division rate αN, inverse of cell cycle time, is directly influenced by checkpoint arrest. In this study, as an initial effort to implement a computational systems biology approach in dose response modeling, we focused on exploration of the relationship between IR dose and the quantity of αNμN. Neoplastic transformation is an important endpoint associated with IR carcinogenesis (Redpath et al. 2001) and strongly correlated with mutation and cancer (Mills et al. 2003; Ishikawa et al. 2004). Here αNμN is the surrogate of neoplastic transformation and is compared to experimental data.
Simulation Procedure of Dose Response Relationship
Cell proliferation rate αN, inverse of cell cycle time, can be directly simulated from the IR perturbed cell cycle model (Module 1 plus Module 2). When applying this computational systems biology approach, models that survive initial testing can then be used to make predictions (Kitano, 2002). In another article (Zhao and Conolly, 2010.), the IR perturbed cell cycle model was tested by comparing simulation results to extensive experimental data. The consistency between the simulation and data provided justification for these subsequent analyses.
The cell cycle time is a function of the lengths of G1/S and G2/M checkpoint arrests, as shown in Equation 5:
| (5) |
Where,
T = the cell cycle time under IR exposure
c = the normal cell cycle length without IR exposure, including G1, S, G2 and M phases, we assume it is 450 time unit in the study
A1 = the G1/S checkpoint arrest time
A2 = the G2/M checkpoint arrest time
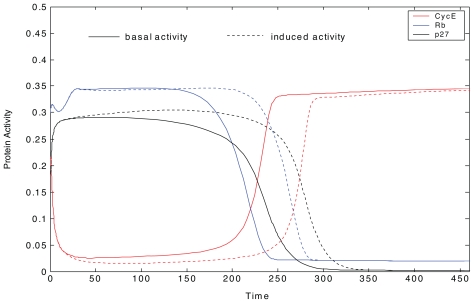
Time course plot or phase plane plot can be used to identify checkpoint arrest time. In a time course plot, the key proteins regulating checkpoint control have switch-like behaviors during G1 to S and G2 to M transitions (Zhao and Conolly, 2010). For example, when CycE jumps from a lower state to a higher state, the G1 to S transition is activated; when CycB jumps from a lower state to a higher state, the G2 to M transition is activated. The simulated switch-like behaviors of the proteins in G1/S checkpoint, are shown in Figure 6. The protein behaviors under normal conditions are indicated by basal activity; the protein behaviors under a certain IR exposure are indicated by induced activity. The switch can be used to identify the G1 to S transition. Here, it is assumed that when CycE’s activity increased greater than 0.1, G1 to S transition happens. Checkpoint arrest delay can be further identified by the time lag between the switches under IR exposure and normal conditions.
FIGURE 6.
Time course of key protein activities from G1 to S transition. The protein behaviors under normal conditions are indicated by basal activity; the protein behaviors under a certain IR exposure are indicated by induced activity. In the transition, proteins, including cyclin E and its cyclin dependent kinase CycE, Rb, and p27 have switch-like behaviors.
For a dynamical system with two variables x and y where
phase plane plots are used to study how x and y change relative to each other and to determine if the system has one or more steady states, i.e., f(x,y) = 0 and g(x,y) = 0. In the phase plane plot, a point on the x null-cline is identified by fixing the value of y and running the computational model to identify the corresponding steady state value of x. The entire x nullcline is developed by repeating this steady state analysis over the range of values of y that are of interest. The x nullcline is thus the set defined by f (x,y) = 0, or in other words, the set of values of x at which the system is at steady state for a range of values of y. Similarly, the y nullcline denotes steady state values of y for a range of values of x, g (x,y) = 0. Intersections of the x and y nullclines identify steady states of the entire dynamical system. In a system with more than one steady state each steady state is associated with a unique intersection of the nullclines. When the dynamical system has more than two state variables, the variables not represented in the 2-dimensional plot are assumed to be in a “pseudo-steady state”. That is, they change quickly with the variables of interest.
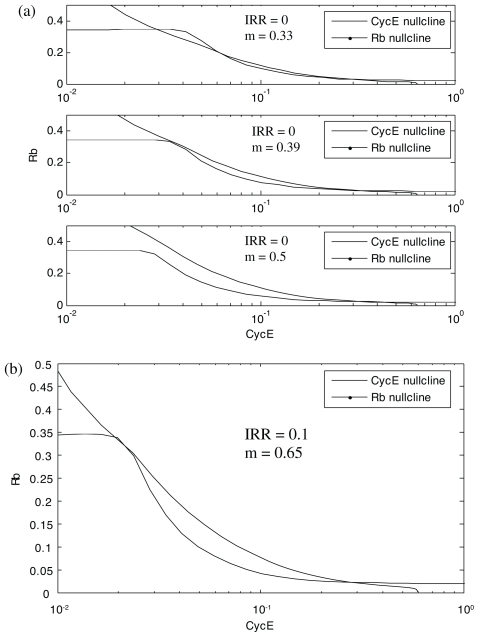
For example, Figure 7 shows a phase plane comparison of Rb and CycE nullclines in G1/S checkpoints without and with exposure to IR (Figs. 7a and 7b, respectively). As m (cell mass) increases from 0.33 to 0.39 to 0.5, the Rb nullcline moves to the left while CycE nullcline changes only for small values of Cdh1 (Fig. 7a). At m = 0.33, the CycE and Rb nullclines intersect 3 times. These intersections define two stable steady states separated by an unstable steady state (the unstable steady state is also called a saddle point). The two stable steady states correspond to G1 and S. G1 is defined by high Rb and low CycE activities, while S is defined by low Rb and high CycE activities.
FIGURE 7.
Phase plane plots of CycE and Rb nullclines in G1/S checkpoint without a) and with b) exposure to IR.
As m increases from 0.33 to 0.39, the intersection of nullclines defining G1 state converges with the saddle point. As m increases to 0.5, the intersection of nullclines that defines G1 disappears and the cell switches into the S steady state. Thus, in the absence of exposure to IR, 0.39 is a critical value of m. Here, we call it as critical mass. The G1/S transition does not occur until the cell grows to this critical mass.
The critical cell size associated with the transition from G1 to S increases in the presence of DNA damage subsequent to IR exposure (Fig. 7b). In this case, with IRR = 0.1, the critical value of m is 0.65. Recall that the critical value for the control case is 0.39. Activation of the G1/S checkpoint is thus evidenced by the extra time spent in G1 as the cell grows to this larger size (m = 0.65 vs. m = 0.39). This extra time provides time for DNA repair and it can be calculated based on Equation (1).
The mutational rate μN is assumed to be a linear function of IR. Some investigators have taken μN as a linear function of DNA damage, and DNA repair may shape the relationship between μN and environmental dose to nonlinear with a threshold or even “J-shaped” (Conolly et al. 2003). The main purpose here is to explore how checkpoint arrest time influences mutational fraction through proliferation rate, so an assumption of a simple linear relationship between μN and IR is appropriate. Therefore, μN has the following function:
| (6) |
Where,
μbas = basal probability of mutation per division for normal cells, 0.01 in the study
k = slope constant, three cases are evaluated in the study: 5.27×10⁻⁵ (Case 1), 3.69×10⁻⁵ (Case 2), 2.64×10⁻⁵ (Case 3)
IRD = dose of IR, the product of IRR and exposure time
RESULTS
Simulated results of dose response relationship are described in this section. Mathematical methods are then implemented to gain deeper biological insights into the mechanisms leading to the specific shapes of the dose response.
The LNT states that even the minutest exposure is bad; the other, the J-shape states that at those very same low levels, exposure is beneficial. The issue in the use of dose-response models for cancer is the extrapolation (or interpolation to 0,0 on the dose and response axes, for the linearized multistage model, LMS) to where cancer risks of interest to regulatory law fall between 10−4 and 10−6. These (individual lifetime probabilities) are orders of magnitude removed from the experimental data on dose and response. The J-shaped model suffers from limitations in the data: these are often not available because the traditional cancer bioassays (NCI/NTP program) do not include a sufficient number of exposures and responses to identify the J-shape, but can identify the ascending limb (Figure 1) from background response. In this section we test these competing models in terms of the results from biological modeling.
Simulation of Dose Response Relationships
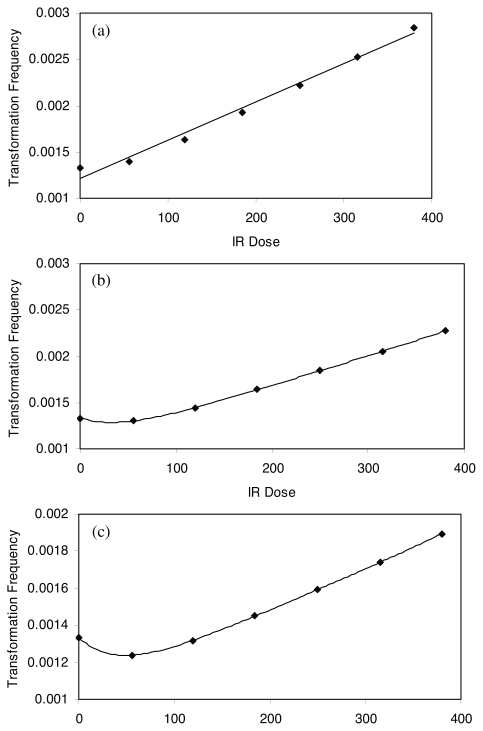
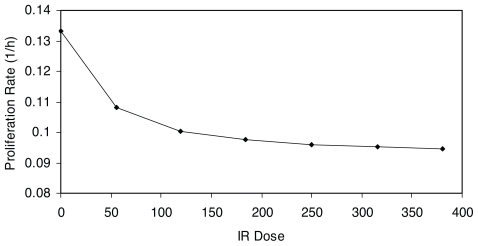
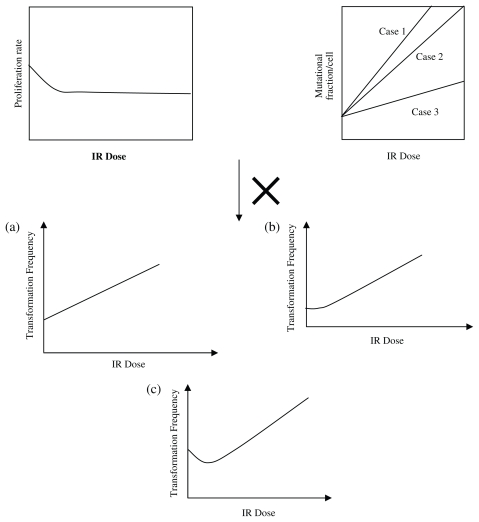
For IRR = 0, 0.1, 0.2, 0.3, 0.4, 0.5, 0.6, G1/S and G2/M checkpoint arrest time are identified using time course plot and phase plane plot, respectively. The cell cycle time are calculated based on Equation 5. The proliferation rate is calculated as inverse of cell cycle time. The IR dose is calculated by IR dose rate multiplying cell cycle time. Table 1 summarizes the estimated G1/S checkpoint arrest time, G2/M checkpoint arrest time, cell cycle time, IR dose and proliferation rate. Then the mutational fraction per hour, as surrogate for transformation frequency, is calculated by multiplying αN and μN for Cases 1, 2 and 3. Figures 8(a), 8(b) and 8(c) show the predicted shapes of dose response for IR induced transformation frequency for three cases, respectively. Figure 8 captured monotonically increasing (Case 1), nonmonotonically increasing or threshold (Case 2) and J-shaped (Case 3) dose response curves.
TABLE 1.
G1/S checkpoint arrest, G2/M checkpoint arrest, cell cycle time and proliferation rate.
| IRR | 0 | 0.1 | 0.2 | 0.3 | 0.4 | 0.5 | 0.6 |
| A1 (min) | 0 | 44 | 74 | 84 | 90 | 93 | 93.3 |
| A2 (min) | 0 | 61 | 74 | 81 | 85 | 88 | 90 |
| T (min) | 450 | 555 | 598 | 615 | 625 | 631 | 633.3 |
| IRD | 0 | 55.5 | 119.6 | 184.5 | 250 | 315.5 | 380.0 |
| ∂N (h−1) | 0.1333 | 0.108 | 0.100 | 0.098 | 0.096 | 0.095 | 0.095 |
FIGURE 8.
Predicted dose response shapes for IR induced transformation frequency for Cases 1, 2 and 3.
Biological Mechanisms for Specific Dose Response Curves
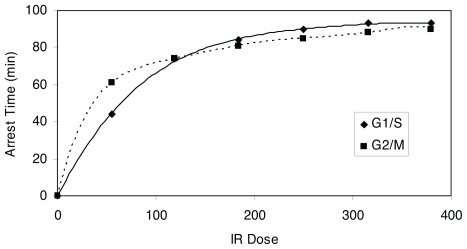
Insights with respect to the biological mechanisms, dose response of checkpoint arrest time and proliferation rate can be drawn from Figure 9, which is a plot of the G1/S and G2/M checkpoint arrest time versus IR dose; while Figure 10 depicts proliferation rate versus IR dose. Figure 11 qualitatively explains the causation of the various dose response curve shapes in the process. The arrest time in both checkpoints tends to saturate when increasing IR to a certain level. The corresponding proliferation rate decreases in a sublinear manner with the increment of IR dose. Therefore, for Case 1, when the slope of μN function is large, the value of μN dominates the result of the product of αN and μN in low dose region, resulting in a monotonically increasing dose response curve (Fig. 11a). For Case 2, when the slope of μN function is moderately small, the increase of μN and decrease of αN offset each other in low dose region, leading to a threshold dose response curve (Fig. 11b). For Case 3, when the slope of μN function is small, the value of αN dominates the result of the product of αN and μN in low dose region, while μN dominates the result in high dose region in which αN tends to saturate, thus resulting in a J-shaped dose response curve (Fig. 11c). Therefore, the J-shaped dose response is fundamentally caused by the saturation of the checkpoint arrest time when the dose of IR increases.
FIGURE 9.
Dose response curve of IR induced G1/S and G2/M checkpoint arrest time.
FIGURE 10.
Dose response curve of proliferation rate vs. IR.
FIGURE 11.
Illustration of the various shapes of dose response curves in the process.
According to intermediate results, critical cell mass saturates with IR exposure increasing. It is the fundamental mathematical reason in the ODE system for checkpoint arrest time saturation. Under the umbrella of systems biology approach, sophisticated mathematical methods should be further developed to study the behavior of critical cell mass in various situations, such as for different formats of the differential equations or under different parameter ranges. We can then obtain more insights regarding under what biological condition, a J-shaped dose response curve can happen.
CONCLUSIONS
We have developed and applied computational systems biology to investigate cancer dose response modeling through the integration of cell cycle modeling into a two-stage clonal growth model. This model accounts for molecular mechanisms involved in dose response and thus is capable of exploring how transformation frequency is influenced by cellular checkpoint arrest and associated molecular signaling network. Hence the model includes multiple-level components of a biological system, specifically applied to cancer from IR exposure. Furthermore, because the direct interaction between toxicological signal and systems biology regulator occurs at the molecular level, our model provides a more detailed description regarding the manner how stressors and genetics interacts directly to impair one or more cellular functions and cause adverse health effects. The newly emerging -omics technology dramatically facilitates dissecting and establishing these networks. The application of systems biology to dose response modeling is in fact a result of the emerging omics technology.
One characteristic of computational systems biology approach is that it uses mathematical simulation methods to assist the understanding of complex biological system. The current study demonstrates this characteristic - modular approaches enables simplification of the complicated system to representative key elements to facilitate investigation; mathematical methods allows for more insights into the underlying mechanisms.
A significant contribution of this article in carcinogenic mechanism study is that it captured the non-monotonic dose response for transformation frequency, as identified by experiments. The dominating factor leading to the predicted non-monotonic dose responses in this model is the increase in cell cycle time associated with activation of checkpoint arrest. The checkpoint arrest time saturates when IR reaches a certain level. This kind of dose response relationship is determined by the behavior of toxicological signal, which directly interacts with checkpoint control regulating proteins. Our study also suggests that checkpoint arrest can be one of the factors that lead to the non-monotonic shapes: the J-shaped dose-response form.
A main obstacle of developing systems model is the “parameter identifiability” problem: as the number of parameters increases, many different sets of model inputs fit the available data equally well. For example, our “cell cycle-perturbation” sub-model has been validated by comparing modeling with experimental results, focusing on its qualitative structure. This required using more than a hundred parameters in the model, which were assigned from knowledge of the biological mechanisms, whenever possible. Although “parameter identifiability” may affect our results, the interest of the current study is in the qualitative shape of dose response curve, for which the mechanism (modeling structure) plays a key role and the “parameter identifiability” problem is not a significant factor (Conolly and Lutz, 2004). Different parameter values may shape the dose response curve, but this reflects the influence of inter-individual variability on the dose response (Conolly et al. 2005). This problem will persist until sufficient data are available to identify each parameter value and should not be an obstacle to using systems of models to ascertain whether the LNT or the J-shape are to be used: the intervariability issue is of secondary importance, given this need.
Our ongoing efforts are on identifying how the range of the parameter values influences the behavior of the systems and the shape of the dose response. Finally, future study should determine how apoptosis pathway in the model influences the endpoint of survival fraction as well as transformation frequency through compensatory increase in cell division rate due to cell death. A tissue-level model should also be developed to account for intercellular communication-bystander effect. We of course are most interested in obtaining quantitative predictions, rather than merely describing a state of the system.
ACKNOWLEDGEMENT
Yuchao Zhao thanks Rory Conolly and Melvin Andersen for their stimulating discussions and contributions to review. The research was supported by grant to the CIIT Centers for Health Research (now Hamner Institutes for Health Sciences) from Department of Energy BER Grant No. DE-FG02-03ER63669.
Footnotes
Yuchao Zhao: mzhao1973@gmail.com
REFERENCES
- Aderem A. Systems biology: its practice and challenges. Cell. 2005;121:511–513. doi: 10.1016/j.cell.2005.04.020. [DOI] [PubMed] [Google Scholar]
- Andersen ME, Dennison JE, Thomas RS, Conolly RB. New directions in incidence-dose modeling. Trends Biotechnol. 2005a;23:122–127. doi: 10.1016/j.tibtech.2005.01.007. [DOI] [PubMed] [Google Scholar]
- Andersen ME, Thomas RS, Gaido KW, Conolly RB. Dose-response modeling in reproductive toxicology in the systems biology era. Reprod Toxicol. 2005b;19:327–37. doi: 10.1016/j.reprotox.2004.12.004. [DOI] [PubMed] [Google Scholar]
- Azzam EI, de Toledo SM, Raaphorst GP, Mitchel RE. Low-dose ionizing radiation decreases the frequency of neoplastic transformation to a level below the spontaneous rate in C3H 10T1/2 cells. Radiat Res. 1996;146:369–373. [PubMed] [Google Scholar]
- Blais A, Dynlacht BD. Constructing transcriptional regulatory networks. Genes Dev. 2005;19:1499–511. doi: 10.1101/gad.1325605. [DOI] [PubMed] [Google Scholar]
- Bonner WM. Phenomena leading to cell survival values which deviate from linear-quadratic models. Mutat Res. 2004;568:33–39. doi: 10.1016/j.mrfmmm.2004.06.044. [DOI] [PubMed] [Google Scholar]
- Calabrese EJ, Ricci PF. Encyclopedia of Environmental Health. Elsevier Publishers; 2010. Hormesis in Environmental Health. (In press) [Google Scholar]
- Chen KC, Calzone L, Csikasz-Nagy A, Cross FR, Novak B, Tyson JJ. Integrative analysis of cell cycle control in budding yeast. Mol Biol Cell. 2004;15:3841–3862. doi: 10.1091/mbc.E03-11-0794. [DOI] [PMC free article] [PubMed] [Google Scholar]
- Cohen SM, Ellwein LB. Cell proliferation in carcinogenesis. Science. 1990;249:1007–1011. doi: 10.1126/science.2204108. [DOI] [PubMed] [Google Scholar]
- Conolly RB, Gaylor DW, Lutz WK. Population variability in biological adaptive responses to DNA damage and the shapes of carcinogen dose-response curves. Toxicol Appl Pharmacol. 2005;207(2 Suppl):570–575. doi: 10.1016/j.taap.2005.04.027. [DOI] [PubMed] [Google Scholar]
- Conolly RB, Kimbell JS, Janszen D, Schlosser PM, Kalisak D, Preston J, Miller FJ. Biologically motivated computational modeling of formaldehyde carcinogenicity in the F344 rat. Toxicol Sci. 2003;75:432–447. doi: 10.1093/toxsci/kfg182. [DOI] [PubMed] [Google Scholar]
- Conolly RB, Lutz WK. Nonmonotonic dose-response relationships: mechanistic basis, kinetic modeling, and implications for risk assessment. Toxicol Sci. 2004;77:151–157. doi: 10.1093/toxsci/kfh007. [DOI] [PubMed] [Google Scholar]
- Csikasz-Nagy A, Kapuy O, Toth A, Pal C, Jensen LJ, Uhlmann F, Tyson JJ, Novak B. Cell cycle regulation by feed-forward loops coupling transcription and phosphorylation. Mol Syst Biol. 2009;5:236. doi: 10.1038/msb.2008.73. [DOI] [PMC free article] [PubMed] [Google Scholar]
- Edwards FM. Dose-response models and methods of risk prediction and causation estimation. Semin Nucl Med. 1986;16:118–130. doi: 10.1016/s0001-2998(86)80025-3. [DOI] [PubMed] [Google Scholar]
- Goldbeter A, Koshland DE., Jr An amplified sensitivity arising from covalent modification in biological systems. Proc Natl Acad Sci U S A. 1981;78:6840–6844. doi: 10.1073/pnas.78.11.6840. [DOI] [PMC free article] [PubMed] [Google Scholar]
- Goldbeter A, Koshland DE., Jr Ultrasensitivity in biochemical systems controlled by covalent modification. Interplay between zero-order and multistep effects. J Biol Chem. 1984;259:14441–14447. [PubMed] [Google Scholar]
- Han Z, Yang L, MacLellan WR, Weiss JN, Qu Z. Hysteresis and cell cycle transition: How crutial is it? Biophys J. 2005;88:1626–1634. doi: 10.1529/biophysj.104.053066. [DOI] [PMC free article] [PubMed] [Google Scholar]
- Heidenreich WF, Luebeck EG, Hazelton WD, Paretzke HG, Moolgavkar SH. Multistage models and the incidence of cancer in the cohort of atomic bomb survivors. Radiat Res. 2002;158:607–614. doi: 10.1667/0033-7587(2002)158[0607:mmatio]2.0.co;2. [DOI] [PubMed] [Google Scholar]
- Ishikawa T, Zhang SS, Qin X, Takahashi Y, Oda H, Nakatsuru Y, Ide F. DNA repair and cancer: lessons from mutant mouse models. Cancer Sci. 2004;95:112–117. doi: 10.1111/j.1349-7006.2004.tb03190.x. [DOI] [PMC free article] [PubMed] [Google Scholar]
- Kapuy O, He E, Lopez-Aviles S, Uhlmann F, Tyson JJ, Novak B. System-level feedbacks control cell cycle progression. FEBS Lett. 2009;22 doi: 10.1016/j.febslet.2009.08.023. Epub ahead of print. [DOI] [PMC free article] [PubMed] [Google Scholar]
- Kitano H. Computational systems biology. Nature. 2002;420:206–210. doi: 10.1038/nature01254. [DOI] [PubMed] [Google Scholar]
- Kohn KW. Functional capabilities of molecular network components controlling the mammalian G1/S cell cycle phase transition. Oncogene. 1998;168:1065–1075. doi: 10.1038/sj.onc.1201608. [DOI] [PubMed] [Google Scholar]
- Li S, Brazhnik P, Sobral B, Tyson JJ. Temporal controls of the asymmetric cell division cycle in Caulobacter crescentus. PLoS Comput Biol. 2009;58:e1000463. doi: 10.1371/journal.pcbi.1000463. [DOI] [PMC free article] [PubMed] [Google Scholar]
- Little MP. Risks associated with ionizing radiation. Br Med Bull. 2003;68:259–275. doi: 10.1093/bmb/ldg031. [DOI] [PubMed] [Google Scholar]
- Little MP, Haylock RG, Muirhead CR. Modelling lung tumour risk in radon-exposed uranium miners using generalizations of the two-mutation model of Moolgavkar, Venzon and Knudson. Int J Radiat Biol. 2002;781:49–68. doi: 10.1080/09553000110085797. [DOI] [PubMed] [Google Scholar]
- Mills KD, Ferguson DO, Alt FW. The role of DNA breaks in genomic instability and tumorigenesis. Immunol Rev. 2003;194:77–95. doi: 10.1034/j.1600-065x.2003.00060.x. [DOI] [PubMed] [Google Scholar]
- Mebust M, Crawford-Brown D, Hofmann W, Schollnberger H. Testing extrapolation of a biologically based exposure-response model from in vitro to in vivo conditions. Regul Toxicol Pharmacol. 2002;351:72–79. doi: 10.1006/rtph.2001.1516. [DOI] [PubMed] [Google Scholar]
- Moolgavkar SH, Knudson AG., Jr Mutation and cancer:a model for human carcinogenesis. J Natl Cancer Inst. 1981;666:1037–1052. doi: 10.1093/jnci/66.6.1037. [DOI] [PubMed] [Google Scholar]
- Moolgavkar SH, Luebeck EG. Multistage carcinogenesis and the incidence of human cancer. Genes Chromosomes Cancer. 2003;384:302–306. doi: 10.1002/gcc.10264. [DOI] [PubMed] [Google Scholar]
- Mothersill C, Seymour C. Radiation-induced bystander effects and adaptive responses—the Yin and Yang of low dose radiobiology? Mutat Res. 2004a;5681:121–128. doi: 10.1016/j.mrfmmm.2004.06.050. [DOI] [PubMed] [Google Scholar]
- Mothersill C, Seymour CB. Radiation-induced bystander effects—implications for cancer. Nat Rev Cancer. 2004b;42:158–164. doi: 10.1038/nrc1277. [DOI] [PubMed] [Google Scholar]
- Novak B, Csikasz-Nagy A, Gyorffy B, Chen K, Tyson JJ. Mathematical model of the fission yeast cell cycle with checkpoint controls at the G1/S, G2/M and metaphase/anaphase transitions. Biophys Chem. 1998;721-2:185–200. doi: 10.1016/s0301-4622(98)00133-1. [DOI] [PubMed] [Google Scholar]
- Novak B, Tyson JJ, Gyorffy B, Csikasz-Nagy A. Irreversible cell-cycle transitons are due to systems-level feedback. Nat Cell Biol. 2007;9:724–728. doi: 10.1038/ncb0707-724. [DOI] [PubMed] [Google Scholar]
- Novak B, Pataki Z, Ciliberto A, Tyson JJ. Mathematical model of the cell division cycle of fission yeast. Chaos. 2001;111:277–286. doi: 10.1063/1.1345725. [DOI] [PubMed] [Google Scholar]
- Ohtaki M, Niwa O. A mathematical model of radiation carcinogenesis with induction of genomic instability and cell death. Radiat Res. 2001;1565(Pt 2):672–667. doi: 10.1667/0033-7587(2001)156[0672:ammorc]2.0.co;2. [DOI] [PubMed] [Google Scholar]
- Pierce DA. Mechanistic models for radiation carcinogenesis and the atomic bomb survivor data. Radiat Res. 2003;1606:718–723. doi: 10.1667/rr3086. [DOI] [PubMed] [Google Scholar]
- Preston RJ. Radiation biology: concepts for radiation protection. Health Phys. 2005;886:545–556. doi: 10.1097/00004032-200506000-00003. [DOI] [PubMed] [Google Scholar]
- Qu Z, MacLellan WR, Weiss JN. Dynamics of the cell cycle: checkpoints, sizers, and timers. Biophys J. 2003a;856:3600–3611. doi: 10.1016/S0006-3495(03)74778-X. [DOI] [PMC free article] [PubMed] [Google Scholar]
- Qu Z, Weiss JN, MacLellan WR. Regulation of the mammalian cell cycle: a model of the G1-to-S transition. Am J Physiol Cell Physiol. 2003b;2842:C349–364. doi: 10.1152/ajpcell.00066.2002. [DOI] [PubMed] [Google Scholar]
- Qu Z, Weiss JN, MacLellan WR. Coordination of cell growth and cell division: a mathematical study. J Cell Sci. 2004;117:4199–4207. doi: 10.1242/jcs.01294. [DOI] [PubMed] [Google Scholar]
- Redpath JL, Antoniono RJ. Induction of an adaptive response against spontaneous neoplastic transformation in vitro by low-dose gamma radiation. Radiat Res. 1998;1495:517–520. [PubMed] [Google Scholar]
- Redpath JL, Liang D, Taylor TH, Christie C, Elmore E. The shape of the dose-response curve for radiation-induced neoplastic transformation in vitro: evidence for an adaptive response against neoplastic transformation at low doses of low-LET radiation. Radiat Res. 2001;1566:700–707. doi: 10.1667/0033-7587(2001)156[0700:tsotdr]2.0.co;2. [DOI] [PubMed] [Google Scholar]
- Ricci PF, Straja S, Cox LA., Jr Changing regulatory risk paradigms can be good for our health: Phasic or linear and threshold dose-response models? Env. Int. 2009 doi: 10.2203/dose-response.11-020.Ricci. (submitted) [DOI] [PMC free article] [PubMed] [Google Scholar]
- Sachs RK, Chan M, Hlatky L, Hahnfeldt P. Modeling Intercellular Interactions during Carcinogenesis. Radiat Res. 2005;1643:324–331. doi: 10.1667/rr3413.1. [DOI] [PubMed] [Google Scholar]
- Slikker W, Xu Z, Wang C. Application of a systems biology approach to developmental neu-rotoxicology. Reprod Toxicol. 2005;193:305–319. doi: 10.1016/j.reprotox.2004.10.003. [DOI] [PubMed] [Google Scholar]
- Sveiczer A, Tyson JJ, Novak B. Modelling the fission yeast cell cycle. Brief Funct Genomic Proteomic. 2004;24:298–307. doi: 10.1093/bfgp/2.4.298. [DOI] [PubMed] [Google Scholar]
- Tyson JJ, Chen K, Novak B. Network dynamics and cell physiology. Nat Rev Mol Cell Biol. 2001;2:908–916. doi: 10.1038/35103078. [DOI] [PubMed] [Google Scholar]
- Tyson JJ, Csikasz-Nagy A, Novak B. The dynamics of cell cycle regulation. Bioessays. 2002;2412:1095–1109. doi: 10.1002/bies.10191. [DOI] [PubMed] [Google Scholar]
- Tyson JJ, Novak B. Regulation of the eukaryotic cell cycle: molecular antagonism, hysteresis, and irreversible transitions. J Theor Biol. 2001;2102:249–263. doi: 10.1006/jtbi.2001.2293. [DOI] [PubMed] [Google Scholar]
- Upton AC. Carcinogenic effects of low-level ionizing radiation: problems and prospects. In Vivo. 2002;166:527–533. [PubMed] [Google Scholar]
- Wheldon EG, Lindsay KA, Wheldon TE. The dose-response relationship for cancer incidence in a two-stage radiation carcinogenesis model incorporating cellular repopulation. Int J Radiat Biol. 2000;765:699–710. doi: 10.1080/095530000138376. [DOI] [PubMed] [Google Scholar]
- Yakovlev A, Polig E. A diversity of responses displayed by a stochastic model of radiation car-cinogenesis allowing for cell death. Math Biosci. 1996;1321:1–33. doi: 10.1016/0025-5564(95)00047-x. [DOI] [PubMed] [Google Scholar]
- Zamborszky J, Hong CI, Csikasz NA. Computational analysis of mammalian cell division gated by a circadian clock: quantized cell cycle and cell size control. J Biol Rhythms. 2007;226:542–553. doi: 10.1177/0748730407307225. [DOI] [PubMed] [Google Scholar]
- Zhao Y, Conolly RB. Computational Modeling of Biochemical Pathways Linking Ionizing Radiation to Cell Cycle Arrest and Apoptosis. Environment Health Perspectives. 2010 to be submitted. [Google Scholar]
- Zwolak JW, Tyson JJ, Watson LT. Parameter estimation for a mathematical model of the cell cycle in frog eggs. J Comput Biol. 2005;121:48–63. doi: 10.1089/cmb.2005.12.48. [DOI] [PubMed] [Google Scholar]


