

Abstract
Purkinje neurons are the output cells of the cerebellar cortex and generate spikes in two distinct modes, known as simple and complex spikes. Revealing the point of origin of these action potentials, and how they conduct into local axon collaterals, is important for understanding local and distal neuronal processing and communication. By using a recent improvement in voltage-sensitive dye imaging technique that provided exceptional spatial and temporal resolution, we were able to resolve the region of spike initiation as well as follow spike propagation into axon collaterals for each action potential initiated on single trials. All fast action potentials, for both simple and complex spikes, whether occurring spontaneously or in response to a somatic current pulse or synaptic input, initiated in the axon initial segment. At discharge frequencies of less than ∼250 Hz, spikes propagated faithfully through the axon and axon collaterals, in a saltatory manner. Propagation failures were only observed for very high frequencies or for the spikelets associated with complex spikes. These results demonstrate that the axon initial segment is a critical decision point in Purkinje cell processing and that the properties of axon branch points are adjusted to maintain faithful transmission.
Introduction
Communication between most neurons in the CNS entails the conversion of synaptic potentials into changes in the rate or timing of action potentials (APs). How this conversion is achieved, and how faithfully the information is transmitted once it is encoded, is a fundamental question in neuroscience. Electrophysiological investigations in vertebrate neurons have demonstrated that typically action potentials initiate at the axon initial segment (Coombs et al., 1957; Häusser et al., 1995; Stuart et al., 1997; Martina et al., 2000; Palmer and Stuart, 2006; Shu et al., 2007). However, investigations of subicular cortical pyramidal cells or cerebellar Purkinje neurons have suggested that spikes may initiate in the first node of Ranvier (Colbert and Johnston, 1996; Clark et al., 2005). More recent pharmacological investigations suggest that Purkinje cells, like most other cell types, do initiate action potentials in the axon initial segment (AIS) (Khaliq and Raman, 2006). One difficulty in determining the initiation site of action potentials is the inability, using traditional recording techniques, to record along the somatic–axonal axis with high spatial resolution.
Cerebellar Purkinje cells generate trains of simple spikes spontaneously, because of their intrinsic membrane properties (Raman and Bean, 1999), modulated by excitatory (e.g., parallel fiber) and inhibitory synaptic inputs. In contrast, activation of climbing fibers from the inferior olive results in the generation of a large EPSP that initiates a complex spike, consisting of one or two full action potentials, between which appear one to three additional partially inactivated spikes, known as spikelets (Ito and Simpson, 1971; Campbell and Hesslow, 1986; Khaliq and Raman, 2005; Davie et al., 2008). Both the spikes and the spikelets occurring in response to the large somatodendritic EPSP are initiated in the axon, although precisely where in the axon is unknown (Stuart and Häusser, 1994; Khaliq and Raman, 2005; Monsivais et al., 2005; Davie et al., 2008).
The pattern of spikes experienced by presynaptic boutons depends critically on the propagation of these action potentials along the axon and its collaterals. Propagation failures have been demonstrated in invertebrate preparations and in some mammalian systems (Yau, 1976; Grossman et al., 1979a,b; Smith, 1980; Antic et al., 2000; Debanne, 2004). Regarding the frequency of axonal failures, studies using calcium imaging techniques have demonstrated that failures of axon propagation are rare in pyramidal cells of the neocortex and hippocampus (Mackenzie and Murphy, 1998; Cox et al., 2000; Koester and Sakmann, 2000). These studies are limited to frequencies of ∼100 Hz or less because of the slow kinetics of Ca2+ signaling. Extracellular recordings from cortical axons have suggested that propagation failures may be common during high-frequency activity (Meeks et al., 2005), although whole-cell axonal recordings have failed to confirm conduction failures in the main axon (Shu et al., 2007), potentially because of the high signal-to-noise ratio (S/N) of whole-cell relative to extracellular recordings. In cerebellar Purkinje neurons, propagation failures along the main axon have been observed at frequencies in excess of 250 Hz and during spikelet generation (Khaliq and Raman, 2005; Monsivais et al., 2005). Whether or not failures occur in axon collaterals has not been directly addressed because of the difficulty of recording from these small structures.
Here, through the use of a recent significant advance in voltage-sensitive dye imaging (Canepari et al., 2010; Holthoff et al., 2010), we provide direct evidence that, in cerebellar Purkinje neurons, all action potentials initiate in the AIS and during simple spike activity propagate faithfully down the main axon and into local axon collaterals at frequencies of <250 Hz. At frequencies above normal physiological rates, or during the generation of spikelets of the complex spike, spike initiation and/or propagation failures can be observed in the main axon proximal to the first collateral. These modifications of waveform output from Purkinje neurons and their targets will have a significant influence on cerebellar function and dysfunction.
Materials and Methods
Slice preparation and maintenance.
We prepared parasagittal slices of cerebellar vermis from mice [L7-tau-GFP (gift from Sascha du Lac, Salk Institute, La Jolla, CA) or pcp2-EGFP (Jackson ImmunoResearch Laboratories)] in accordance with national and institutional guidelines. Male or female mice (2–5 weeks of age) were deeply anesthetized with sodium pentobarbital (50 mg/kg) and killed through decapitation. The brain was rapidly removed and placed in ice-cold (<5°C) cutting solution containing the following (in mm): 85 NaCl, 2.5 KCl, 3.5 MgSO4, 0.5 CaCl2, 25 NaHCO3, 1.25 NaH2PO4, 10 glucose, 3 myo-inositol, 3 Na-pyruvate, 0.5 l-ascorbic acid, 75 sucrose, and aerated with 95% O2, 5% CO2 to a final pH of 7.4. We dissected the cerebellar vermis, glued it to an ice-cold stage on a Leica microslicer, and cut 200–400 μm slices in ice-cold cutting solution. The sections were placed in an incubator at 35°C for 0.5 h in the cutting solution, and were then transferred to a chamber containing artificial CSF (in mm: 126 NaCl, 3.0 KCl, 1.0 MgSO4, 2.0 CaCl2, 26 NaHCO3, 1.25 NaH2PO4, 10 glucose, 3 myo-inositol, 2 Na-pyruvate, 0.4 l-ascorbic acid) at room temperature for at least 0.5 h before dye loading and recording in a submersion chamber.
Cell selection.
The voltage-sensitive dye imaging system is constructed around an upright microscope (Olympus BX51WI) equipped to switch easily between three different imaging systems: (1) confocal epifluorescence for cell selection and morphological reconstruction (Yokogawa CSU-XAH system; Solamere Technology); (2) infrared-differential interference contrast (IR-DIC) video microscopy for establishing whole-cell recordings; and (3) wide-field epifluorescence for voltage-sensitive dye imaging (see Fig. 1). Initially, slices were examined with the confocal imaging system for morphological completeness of their dendritic and especially axonal components, using a three-line argon laser at 50 mW, 488 nm (National Laser Company) (see Fig. 1; supplemental Movies 1, 2, available at www.jneurosci.org as supplemental material). Both pcp2-EGFP and L7-tau-GFP mice gave satisfactory to excellent results when examining dendritic and axonal morphologies, although the L7-tau-GFP mice were superior for examining axonal projections, but inferior to pcp2-EGFP mice for examining dendritic morphologies (supplemental Movies 1, 2, available at www.jneurosci.org as supplemental material). This process of cell selection illuminated individual neurons typically for <1 min and was determined to be nontoxic. Illuminating Purkinje neurons in this manner, while performing whole-cell somatic recordings, for a period of 10 min failed to reveal any detectible change in their membrane potential, input resistance, membrane time constant, or action potential characteristics (e.g., threshold, height, width, dV/dt) (data not shown).
Figure 1.

Methods for obtaining voltage-sensitive dye recordings from Purkinje cell axons. Schematic of the experimental setup shown in the middle: IR-DIC video microscopy was used for patching neurons; the voltage-sensitive dye was excited using a 532 nm solid-state laser in wide-field illumination mode; emission light was recorded with a high-speed CCD-camera; a spinning-disc confocal scanner was used for morphological reconstruction. A, A composite EGFP fluorescence image of a Purkinje cell with intact axonal arbor generated from stacks of images obtained with a spinning-disc confocal scanner. Cerebellar slices were from transgenic mouse lines (L7-tau-GFP shown; pcp2-EGFP was also used) in which GFP or EGFP was expressed in Purkinje cells. B, Voltage-sensitive dye fluorescence image of a part of the axonal arbor in recording position obtained with the CCD camera for voltage imaging (different cell from A).
The S/N ratio in voltage-sensitive dye recording depends, among other factors, on the amount of dye filling the cell, the morphology of the cell, and the proximity of the cell to the surface of the slice. Because we image in wide-field mode, all structures to be simultaneously monitored must lie close to the plane of focus. The closer the imaged structures lie to the surface of the slice, the less the image is degraded by light scattering in the tissue. The selection of neurons with processes that are intact and anatomically appropriate for imaging has been one of the major limiting steps in experiments using voltage-sensitive dye recording because thin neuronal processes are not visible under IR-DIC videomicroscopy. By using transgenic mouse lines expressing green fluorescent protein (GFP) or enhanced green fluorescent protein (EGFP), we were able to select neurons with optimal morphology before dye loading, greatly increasing the efficiency of these experiments. The GFP and EGFP fluorescence does not interfere with voltage-sensitive dye signals because of the non-overlapping emission spectra of these two fluorophores.
Voltage-sensitive dye loading and recording.
We loaded selected neurons with voltage dye with a glass patch electrode by filling the tip with dye-free internal solution (in mm: 130 K-gluconate, 7 KCl, 4 ATP-Mg, 0.3 GTP-Na, 10 phosphocreatine-Na, 10 HEPES, 0.4% biocytin, adjusted to pH 7.4 and 284 mol/kg), and then backfilled with the dye-containing internal solution (JPW3028; 400–800 μm) and performed whole-cell somatic recordings from the selected neuron under IR-DIC optics (see Fig. 1B). The dye JPW3028 is a doubly positively charged analog of the aminostryryl-pyridinium series of lipophilic voltage-sensitive dyes available from Invitrogen as D-6923. This electrochromic dye does not significantly increase the membrane capacitance of the labeled neuron as evident from a number of control measurements showing that the waveform of the electrically recorded action potentials remains unaltered after intracellular application of the dye (Canepari et al., 2007). The physical basis for the lack of the capacitive load effect, characteristic for some fluorescence resonance energy transfer as well as some protein voltage probes, is that the interaction of the electric field with electrochromic dyes leads to a charge movement across a very small fraction of the membrane field (the size of the chromophore) (Blunck et al., 2005). Estimation of cell membrane capacitance in voltage clamp throughout dye loading showed no significant increase (p > 0.05; n = 4). In addition, parameters monitoring spike kinetics (width, maximum slope, and minimum slope) were not different for cells loaded with dye and cells without dye (p > 0.05; n = 5, each group). Dye-free solution in the tip is necessary because this highly lipophilic dye would otherwise spill onto the slice before sealing and patching the cell of interest. Any dye bound to membrane outside the cell of interest increases the background fluorescence (F) and thus degrades recording sensitivity. The selected cell was patched and stained at room temperature for 20–50 min by allowing passive diffusion of the dye into the cell. After staining, we carefully detached the patch electrode from the neuron forming an outside-out patch after which the slice is incubated at room temperature for 1–1.5 h, allowing the dye to diffuse from the soma into distal processes. The dye diffuses slowly compared with other dyes of the same size/weight because of its high affinity for lipid membranes. Before recording, the perfusion solution temperature was typically increased to physiological level (35–36°C; a small number of recordings were obtained at room temperature), and we repatched the stained cell with a voltage-sensitive dye-free electrode (although the patch pipette now contained 0.4% biocytin for morphological reconstruction) for simultaneous optical and electrophysiology recording.
Cells filled with the voltage-sensitive dye were illuminated with a 450 mW frequency-doubled diode-pumped Nd:YVO4 low-noise laser emitting at 532 nm (MLL532; Changchun New Industries Optoelectronics Technology). The laser beam was directed to a light guide coupled to the microscope via a single-port epifluorescence condenser (TILL Photonics) designed to overfill the back aperture of the objective. In this way, near-uniform illumination of the object plane was attained. Illumination of the soma was limited by the microscope field-stop to minimize damage to the recorded neuron. Fluorescence from the stained cell was collected through the objective (60× water-immersion; 1.0 numerical aperture; Nikon), long-pass filtered (RG610 HP; Omega Optical), and projected onto a 80 × 80 pixel high-speed CCD camera with a 10 kHz maximum frame rate (NeuroCCD-SMQ; RedShirtImaging) mounted at the front camera port of the trinocular tube. At the magnification that we used, each pixel of the camera corresponded to a square region 4 μm per side. The calculation of action potential initiation point used the middle of the pixel (e.g., 2 μm) as the value for statistical purposes. Changes in voltage-sensitive dye fluorescence were imaged during simple spikes evoked with single 0.5 ms current pulses injected into the soma, or trains of 20 pulses delivered at 100–350 Hz or during spontaneously generated trains of action potentials. Complex spikes were evoked by stimulating climbing fibers with 100 μS, 50–200 μA local stimulation in the dendritic layer ∼50 μm lateral to the recorded neuron. Each trial lasted ∼20–60 ms, and the voltage-sensitive dye was illuminated only during this period. We could obtain between 15 and 25 trials before changes in the electrophysiological properties of the recorded neuron (action potential amplitude and duration, resting membrane potential, resting input resistance) were evident, in which case the experiment was terminated.
Data analysis.
The S/N ratio obtained during voltage-sensitive dye imaging varied from cell to cell depending on the concentration of dye and proximity of the axon to the surface of the slice (supplemental Fig. 2, available at www.jneurosci.org as supplemental material). Thus, to achieve comparable S/N (>6:1) ratio across experiments, we averaged fluorescence changes from groups of neighboring pixels. Although we typically could obtain this S/N ratio in single-trial recordings, in some cases we performed temporal averaging of a small number (4–32) of trials (supplemental Fig. 2, available at www.jneurosci.org as supplemental material). To avoid smearing in the trial-to-trial average because of temporal jitter, for each trial we aligned the signal in each pixel to the peak electrical (somatic recordings) or optical (averaged over the entire axon) signal. A low-pass binomial filter (one pass) was applied to reduce high-frequency noise. Within trial bleaching and low-frequency noise were removed by subtracting an exponential or polynomial function fit to portions of the fluorescence signal containing no spikes (supplemental Fig. 2C, available at www.jneurosci.org as supplemental material). The ΔF/F signal from different parts of the neuron varies because of factors other than voltage (e.g., density of dye, partitioning of dye in inner and outer membranes, depth of process in tissue, etc.). To compare the timing of action potentials in different regions of the neuron, we scaled all spikes to the same baseline and peak height (supplemental Fig. 2D, available at www.jneurosci.org as supplemental material). The waveform of fluorescence action potential signals shown in Figures 2–4 were interpolated to 100 kHz using a cubic spline; raw data points (collected at 10 kHz) are superimposed on the interpolated curve for traces shown on an expanded timescale (supplemental Fig. 2F, available at www.jneurosci.org as supplemental material). We determined the location of spike initiation as the portion of the axon where the change in fluorescence corresponding to propagating spikes first reaches half-maximum amplitude. Because the 10 kHz frame rate captured only three to four data points on the rising phase of each spike (see Fig. 2), we fit a line between the two data points surrounding the rising phase half-height and solved for the time at which the spike reached half-maximum amplitude (“onset latency”). This method was superior to using either the foot or the peak of the action potentials, since both of these are characterized by a slowly changed membrane potential, allowing for substantial temporal jitter to be introduced by small variations in the accuracy of amplitude measurement.
Figure 2.

Action potentials initiate in the Purkinje cell axon initial segment. A, Voltage-sensitive dye fluorescence image of the soma–axon region in recording position shown on the left. Traces on the right, Single-trial recordings of AP signals, initiated by somatic current injection, from nine locations indicated on the image. Each trace is a spatial average of four to five same-color pixels. Signals are scaled to the same peak height. The symbols represent actual data points; the solid lines are reconstructed signals using cubic spline interpolation. The vertical line denotes the time at half-maximum amplitude at the edge of the soma (location 1). Note that the AIS segment traces (green and red) initiate the action potential first. B, AP recordings from the AIS and the first node of Ranvier scaled to the same height and compared on an expanded timescale. C, The time to half-maximum amplitude subtracted from the time at half-max for the edge of the soma (“onset latency”) as a function of distance from the soma. D, Group data (n = 15) illustrating the level of consistency in the spatial localization of spike onset and the spike propagation velocity across cells. Error bars indicate SEM. E, Group data statistics. The onset latency is lowest in the axon initial segment, and in all cells preceded the spike in the first node of Ranvier (p = 0.000006; n = 15). The diagonal line represents equity. The diamonds represent spikes initiated with a current pulse. The data obtained from spontaneous spikes are indicated by X's. The data in red was obtained at 35°C, whereas the data in blue was obtained at 23°C.
Figure 3.

All action potentials of a train initiate in the axon initial segment. A, Voltage-sensitive dye fluorescence image of the soma–axon region in recording position shown on top. Traces below are AP signals evoked by repetitive soma stimulation at 200 Hz (bottom trace). Signals were recorded by an electrode in the soma (black) and optically from AIS and first node of Ranvier (blue and green) as indicated on the image. The scale bar illustrates percentage ΔF/F for the optical signals. B, Comparison of AP waveforms from the AIS (green) and first node (blue) for the first and ninth spike in the train. C, Latency difference between the first node and AIS for the nine spikes in the train; AIS discharges first for all spikes. The equation is the best linear fit of the data, and the slope of this line is not significantly different from zero (p = 0.89; n = 3 cells). Error bars indicate SEM.
Figure 4.

Action potentials propagate in a saltatory manner. A, Spontaneously initiated action potential. Bottom frame, Voltage-sensitive dye fluorescence image of the soma–axon region with the AIS, first and second nodes as indicated. Colored frames, A time sequence of color-coded spatial map of relative membrane potential during initiation of AP shown in C. Signals from detectors centered over the main axon and collaterals are shown. The color scale is in relative units with resting membrane potential shown in blue/green, half-maximum amplitude in red, and peak of the AP in yellow. Individual frames are separated by 50 μs (obtained from cubic spline interpolation of original data points recorded at 100 μs intervals) (Fig. 2B). At ∼50 μs, the spike initiated in the AIS and propagated down the axon. At ∼100 μs, the first node was discharged to half-maximum amplitude before the immediately adjacent axonal regions. At ∼200 μs, the region of the second axon collateral (second node) is approaching half-maximal. B, A time sequence of changing spatial profiles of membrane potential during initiation and propagation of an action potential. The spatial plots constructed by dividing the axon into 20 regions of equal length. The average relative voltage for each region plotted as a function of distance from the soma. The time of each spatial plot in the sequence corresponds to time points indicated for color-coded frames in A. Note how the action potential propagates from the AIS to the first node, then to the second node, followed by propagation into the internodal regions. C, A temporal average of 26 spontaneous action potentials for the AIS, first node, and second node with time lines corresponding to the data in A and B. See also supplemental Movie 3 and supplemental Figure 4 (available at www.jneurosci.org as supplemental material).
When examining the probability of spike propagation, we were able to reduce the sampling rate to 5 kHz and examine a larger set of pixels, to image a larger portion of the axon and collaterals. This sample rate is sufficient to accurately detect action potentials in the imaged structures, even on single trials. Spike failures were considered to have occurred when the action potential fell below the noise level for all points at and distal to the point in question, and when previous action potentials were observed to give rise to the normal S/N ratio of at least 6 at these same locations. All analyses were performed in NeuroPlex (RedShirtImaging) and Matlab. At the end of the experiment, the axonal arbor of the neuron was recorded either by obtaining a z-stack of the arbor with the confocal microscope, or through processing of the tissue to reveal biocytin.
Movie methods.
Movies of action potential initiation and propagation were generated by performing a pixel by pixel (4 μm square) average, aligned in time according to the peak of each action potential (averaged over the entire axon). A mask was applied to exhibit only those pixels lying over the neuronal process of interest. A cubic spline interpolation at 100 kHz was then applied to the average data points (supplemental Fig. 2F, available at www.jneurosci.org as supplemental material). Each pixel was scaled to the same average baseline and peak amplitudes (from 0 to 1). A color code was applied such that the most negative value was blue, the peak (peak of the spike) value was yellow, and the halfway value was red (supplemental Fig. 4A, available at www.jneurosci.org as supplemental material). Although data points were collected every 100 μs, we used the cubic spline interpolation to extrapolate the likely values of relative membrane potential at 50 μs intervals (supplemental Fig. 4A, available at www.jneurosci.org as supplemental material). The average data was filtered with a low-pass (2850 Hz cutoff frequency) Gaussian filter (supplemental Fig. 4B, available at www.jneurosci.org as supplemental material). The resulting spatial distribution of relative voltages over time was then subjected to spatial smoothing by averaging the values of each pixel with that of the immediately adjacent pixels (that carried signal) in a 3 × 3 array (3 × 3 mean filter). This averaging was done for each pixel according to the raw values at the neighboring pixels. From one to five iterations of this spatial smoothing were performed (supplemental Fig. 4C,D, available at www.jneurosci.org as supplemental material).
Methods for complex spikelet failures.
The spikelets of complex spikes could be of relatively small amplitude, which added significantly to the challenge of detection of the propagation of these events and determining the region of propagation failure. This is particularly true since there is temporal overlap of the spike/spikelet waveforms within a complex spike. We considered a spikelet to have failed to propagate down the axon if it became undetectable at the furthest locations of the main axon (see Figs. 6, 7; supplemental Fig. 5, available at www.jneurosci.org as supplemental material). We found that the first spikelet in the complex spike propagates in the main axon and axon collaterals with a low probability (<6%). To investigate spatial characteristics of spikelet failure, we plotted amplitude of the first and second spikelets, normalized to the height of the first spike, as a function of distance from the soma (n = 5 cells).
Figure 6.
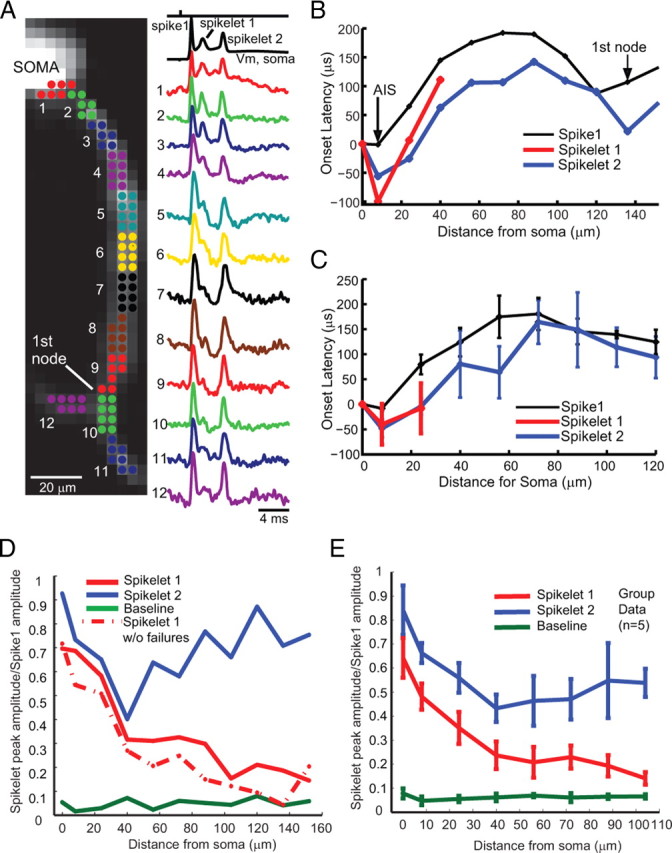
Action potentials show variable propagation probabilities during complex spikes. A, Voltage-sensitive dye fluorescence image of the soma–axon region in recording position shown on the left. Top trace on the right (black), Timing of climbing fiber activation by extracellular electrical stimulation. Second trace (black), Whole-cell somatic recording. Bottom color traces, Optical recordings of AP signals, evoked with climbing fiber stimulation, from 12 locations indicated on the image. Each trace is a temporal average of 18 trials and a spatial average of 6–8 pixels. Signals are scaled so that the first AP is of the same height. B, C, Action potential onset latency, measured from the time to half-maximum amplitude, as a function of distance from the edge of the soma for the first sodium spike (thin trace) and subsequent spikelets (red and blue traces) for a Purkinje cell (B) and average group data (C). In both cases, the first spikelet fails to propagate at 30–60 μm, before the first branch point. D, Relative amplitude (proportion of amplitude of the first and second spikelets) versus distance from the soma. Note that the first spikelet continuously decreases, whereas the second spikelet decreases and then increases in amplitude. The first spikelet amplitude was measured as the peak membrane potential at 0.5–3 ms after the first spike, whereas the second spikelet amplitude was measured as the peak membrane potential at 3–10 ms after the first spike (see Materials and Methods). The bottom data points represent baseline noise before initiation of a complex spike. The dashed line (spikelet 1 without failures) represents the average response after excluding two trials in which the first spikelet propagated successfully down the main axon. E, Group data (n = 5) demonstrating the general property of the first spikelet to decrease over the first 100 μm of the axon, whereas the amplitude of the second spikelet often decreases and then increases with distance from the soma, indicating active propagation. The bottom data points represent average baseline data points before spike initiation. The peak amplitude of each spikelet contains in part the underlying membrane potential change because of activation of either the previous spike or the slow depolarization of the complex spike (this is particularly true of sites near the soma). In all cells, the first spikelet decayed to 30% or less of its amplitude at initiation within 100 μm of the soma. All trials are included. See supplemental Figure 5 (available at www.jneurosci.org as supplemental material) for the point of spikelet failures for individual neurons. Error bars indicate SEM.
Figure 7.

A, Voltage-sensitive dye fluorescence image of the axonal section containing a primary and a secondary branch in recording position. The spatial relationship with the soma is shown schematically in the bottom left panel. B, Electrical (soma; black) and optical recordings of the complex spike signals from locations on the main axon before (black) and after (red) the branch point as well as the membrane potential in the primary (green) and secondary (orange) axon collaterals indicated in the schematic. Top trace (black), Timing of electrical stimulation of the climbing fiber. In this experiment, the first spike reliably propagates throughout the main axon and axon collaterals. The first spikelet failed to propagate into the primary collateral, and subsequent spikelets propagated with intermediate probability. C, Summary data showing propagation probability for the initial spike (1), first spikelet (2), and second spikelet (3) comprising complex spikes evoked with climbing fiber stimulation (n = 6 cells). Propagation probability for each component of the complex spike was identical for the main axon after the axon collateral branch point and for axon collaterals. Error bars indicate SEM.
For measurement of spikelet initiation, we averaged across trials (3–18) and across groups of pixels (6–8) to achieve a S/N ratio appropriate for tracking spikelets, which were often <60% of the amplitude of a full spike. Separate averages were obtained for each spike and spikelet by aligning trials to the peak of each spike and spikelet recorded in current clamp. We then defined times windows corresponding to the first spike, first spikelet, and second spikelet, and divided the maximum values found in the spikelet windows by the amplitude of the first spike, which always propagated. Since the first spike and subsequent spikelet occurred close in time (up to 1000 Hz), the spikelet was often superimposed on the falling phase of the first spike. To correct for offset imposed by the falling phase of the first spike on the amplitude of the first spikelet, we subtracted a double-exponential function fit to the falling phase of the first spike before measuring amplitude of the first spikelet. An estimate of the noise was obtained by dividing the peak value measured in a time window preceding the complex spike by the amplitude of the first spike. Spikes were considered to fail when the ratio of the spikelet peak to the amplitude of the first spike fell to the level of the noise. For two cells, the peak ratio for the second spikelet never returned to baseline because of the inclusion of rare trials in which the second spikelet propagated. By averaging only trials in which the second spike failed to propagate, we calculated that the amplitude of the spikelet dropped to the level of the noise at 94 ± 24 μm from the soma.
Results
To examine action potential initiation and propagation in cerebellar Purkinje neurons using voltage-sensitive dye imaging, it was important to first obtain a cell in which a significant portion of the main axon and collaterals were intact and within ∼50 μm of the upper surface of the slice. This process of cell selection was greatly enhanced by examining, using a spinning disk confocal system, Purkinje cells in cerebellar slices from transgenic mice lines in which these cells contain a high density of a fluorescent protein label (GFP or EGFP) (Fig. 1; supplemental Movies 1, 2, available at www.jneurosci.org as supplemental material) (see Materials and Methods). Examining morphological features of Purkinje neurons using GFP fluorescence did not reveal any significant adverse effects even with 10 min of continuous imaging (see Materials and Methods). Once a cell was selected in which the main axon and collaterals could be followed for at least 300 μm, the neuron was patched under IR-DIC optics and loaded with the voltage-sensitive dye JPW3028 as previously described (Antic et al., 1999; Djurisic et al., 2004; Canepari et al., 2008).
After the labeling period, a whole-cell recording was again obtained from the soma of the stained neuron. Only cells that exhibited no significant change in their electrophysiological properties (e.g., input resistance, time constant, action potential amplitude, width and peak dV/dt) between the first and second whole-cell recordings were accepted for additional experimentation. In these neurons, the electrical signals were recorded with the somatic patch electrode while the initiation and propagation of action potentials were simultaneously monitored optically at multiple locations along the main axon and collaterals using a high speed (up to 10,000 Hz frame rate) CCD camera (see Materials and Methods). We took advantage of the recent critical improvement in voltage-sensitive dye imaging technique based on monochromatic, laser light excitation (532 nm; 450 mW) in the wide-field epifluorescence microscopy mode. The combination of an increase in light intensity (beyond the level that can be achieved with an arc lamp) and the use of near optimal monochromatic excitation wavelengths resulted in a dramatic improvement in the sensitivity of voltage imaging (expressed as the S/N ratio) by a factor that varied from 10 to 40 in different measurements (Canepari et al., 2010; Holthoff et al., 2010). This significant increase in S/N ratio allows us to examine single trial data, typically with minimal spatial averaging and filtering (see Materials and Methods). To avoid effects of photodynamic damage, we monitored the width of the action potential from trial to trial, both in the soma and in the fluorescence signal averaged over the whole axon (supplemental Fig. 6, available at www.jneurosci.org as supplemental material). Trials were excluded from analysis if they exhibited significant changes in spike width, reflecting potential damage to sodium and potassium channels.
To compare spike initiation timing, we chose the time of half-maximal rise during the upstroke of the action potential at each point along the axon (Fig. 2). The half-maximal point was chosen because this was a more reliable parameter than either the peak or the foot of the action potential for two main reasons. First, the accuracy of measurements based on the comparison of time to half-amplitude is better than the 0.1 ms sampling interval because the measurements are made, using linear interpolation, along the most rapidly changing phase of the signal. Second, noise in the signal can cause an error in the time of the transition to a given signal amplitude; the greater the rate of change of the signal amplitude as it traverses a given amplitude level, the less will be the error in transition time (Malmstadt et al., 1974; Ross and Krauthamer, 1984). These factors favor the time to half-amplitude, which is approximately the point of maximal influx of Na+, as the most reliable measure of spike timing (see Materials and Methods).
Examination of the timing of simple spike initiation, generated in response to the intrasomatic injection of a short duration (0.5 ms) depolarizing current pulse, with voltage-sensitive dye imaging revealed the half-maximal amplitude point of the rising phase of the action potential to occur earliest in the AIS at an average distance of 16.4 ± 1.5 μm from the soma (n = 11 cells). This spike then propagated down the main axon toward and beyond the first node of Ranvier at an average rate of 1.03 ± 0.28 m/s (Fig. 2A–E) (n = 11). In many of our axonal recordings, the first node of Ranvier was identifiable as the location of the first branch point, giving rise to an axon collateral (Figs. 2A, 3A) (Chan-Palay, 1971; Clark et al., 2005; Orduz and Llano, 2007). Similar results were also obtained when examining simple spikes that occurred spontaneously at frequencies of 23–105 Hz (supplemental Fig. 1, available at www.jneurosci.org as supplemental material). One advantage of the imaging technique used here is that, in many recordings of repetitive discharges, the S/N ratio was sufficient to allow us to determine the site of spike initiation for every action potential in a train in single-trial recordings. At all frequencies of simple spike activity examined (0.1–250 Hz), with spikes generated either spontaneously or through the repetitive intrasomatic injection of short current pulses, we found that the action potentials initiated at the AIS (Fig. 3B,C) (n = 345 spikes in 15 cells).
Comparison of the action potential timing in the AIS and the first node of Ranvier demonstrated a consistent latency difference (AIS spiking before first node) for all action potentials in a spike train (Fig. 3). However, this does not mean that action potentials propagated smoothly along the axon. Indeed, in approximately one-half of the recorded cells, we found that the first node of Ranvier reached half-maximum AP amplitude before immediately adjacent axonal regions. A typical result is shown in Figure 4A, in which a mask has been applied to restrict the analysis to only those pixels lying over the center of the axonal processes. The simultaneous presentation of the temporal and spatial dynamics of action potential initiation and propagation is facilitated by a color-coded display. In Figure 4, a relative scale was applied separately to each optical channel (CCD pixel) with the minimum value of the signal amplitude (resting membrane potential) represented by blue/green, the peak of the action potential by yellow, and the half-maximal point by red. Each frame in the sequence shown in Figure 4A is a color-coded representation of the spatial distribution of relative membrane potential at one point in time with individual frames separated by 50 μs. Such a high temporal resolution was derived from action potential waveforms recorded from multiple locations at a frame rate of 10 kHz followed by 20–100 kHz interpolation of the cubic spline fit (Fig. 2B; supplemental Fig. 2, available at www.jneurosci.org as supplemental material). The spatiotemporal distribution of the half-amplitude signal (red) revealed the initiation of action potentials in the AIS followed by propagation down the axon as well as backpropagation into the soma. In approximately one-half of the neurons in which the first node of Ranvier was clearly resolved (n = 8 of 15), we observed that the AIS spike was rapidly followed by spike generation in the first node, followed by the generation of action potentials at a slight lag at the axonal regions between the AIS and first node (Fig. 4A,B). In the experiment shown in Figure 4, a second “hot spot” of spike initiation was observed distally to the first node of Ranvier and corresponded to the origin of a second axon collateral (Fig. 4A). Again, the spike conducted rapidly along the main axon between the site of origin of the first and second axon collaterals, suggesting that both branch points correspond to nodes of Ranvier (Fig. 4A,B). A similar conclusion about the initiation and spread of the AP can be reached based on the spatiotemporal distribution of the peak of the AP signal (yellow). Thus, the action potentials in 8 of 15 neurons were observed to propagate down the main axon in a “saltatory” manner (supplemental Movies 3, 4, available at www.jneurosci.org as supplemental material). Of the seven axons that did not clearly exhibit this characteristic, four had onset latency measurements that were too noisy in some portion of the axon to clearly discern a local minimum at the first node. The other three axons exhibited a smooth propagation of action potential conduction along the main axon, suggesting that saltatory conduction had not occurred in this small subgroup of cells (3 of 15).
The amplitude versus time derivative of action potentials reveal that they rise very rapidly, with the rate of change becoming much slower near, and falling to zero at, the peak of the spike (McCormick et al., 1985). Because of this, the membrane potential spends a significant fraction of the duration of the action potential near its peak voltage. One consequence of this can be seen by examining the spatial distribution of relative membrane potential over time during the propagation of the action potential in Figure 4B. Although there are clear and large differences in the membrane potential at the AIS versus the first node of Ranvier at each point of time during the rising phase of the action potential in the AIS, once the spike has peaked at this location, the membrane potential at the first node of Ranvier is able to “catch up” (Fig. 4B). This is because at the first node of Ranvier the membrane potential is rapidly rising during the initial phase of local spike initiation, whereas at the AIS, the membrane potential is already near the peak of the spike and is slowly changing (Fig. 4C). Thus, the proportion of the axon that is within a similar membrane potential range changes during different phases of the spike. During the rapidly rising phase (0–200 μs), the spatial profile of the membrane potential is quite nonuniform, whereas near the peak of the spike (250–400 μs), large segments of the axon between the soma and the first and even second nodes are simultaneously depolarized to within a narrow membrane potential range (Fig. 4B).
The high spatial and temporal resolution of the voltage imaging technique used here provides a unique way to examine possible failures in AP initiation and propagation, especially propagation across branch points, even during high-frequency discharges (Fig. 5). Typically, the main axon of Purkinje neurons issues a primary collateral within ∼60–150 μm, and sometimes a second primary collateral could be identified at a distance of 200–300 μm from the soma. These collaterals turn toward the cell body layer, ultimately giving rise to synaptic contacts onto nearby Purkinje neurons and other cell types (Hamori and Szentagothai, 1968; Larramendi and Lemkey-Johnston, 1970; Chan-Palay, 1971; De Camilli et al., 1984; Orduz and Llano, 2007; Watt et al., 2009). These primary collaterals can give rise to secondary, tertiary, and higher order collaterals (Fig. 5).
Figure 5.

Propagation of simple spikes into axon collaterals. A, Voltage-sensitive dye fluorescence image of a section of the axon arbor in recording position (top left). The spatial relationship with the soma is shown schematically on the right. Recordings from four locations indicated in the image are shown below. The bottom traces (black) indicate stimulus current and electrode recordings from the soma. Simple spikes evoked by trains of repetitive current pulses injected into the soma at 200–250 Hz reliably propagate in the main axon (green and blue traces), primary (red) collaterals, and secondary collaterals (orange). At 300–350 Hz, action potentials sometimes fail to initiate in one Purkinje cell (cell 1) but not in the other (cell 2). B, Probability of initiation of simple spikes in the main axon (blue, dashed line), as well as the probability of propagation of these spikes, once initiated, down the main axon (blue) and primary (green) and secondary (red) collaterals as a function of stimulation frequency (n = 6 neurons). During simple spike activity, all action potentials that were initiated propagated down the main axon and only rarely did these spikes fail to invade the primary and secondary axon collaterals. See supplemental Figure 3 (available at www.jneurosci.org as supplemental material). Error bars indicate SEM.
In a series of measurements, we were able to monitor the initiation and propagation of simple action potential discharges in the main axon as well as the primary and secondary collaterals (n = 562 stimuli in 6 cells) (Fig. 5) at frequencies of 100–350 Hz. At frequencies below ∼300 Hz, the intrasomatic injection of short duration current pulses resulted in the reliable initiation of action potentials in the AIS (Fig. 5B) (n = 13 failures of 283 spikes; 4.6%). At frequencies between 300 and 350 Hz, however, we observed a slightly higher initiation failure rate (n = 47 failures/279 spikes; 16.8%), although these failures to initiate an action potential did not occur evenly throughout all neurons (compare Fig. 5A,B). Although not tested, we assume that these initiation failures were the result of the relative refractory period for spike initiation in the AIS (Hasenstaub et al., 2005).
All action potentials that were successfully initiated at the AIS by the intrasomatic current pulse successfully propagated down the main axon and nearly all successfully invaded the axon collaterals. We observed failures to invade the axon collateral on only 8 of 502 action potentials (1.6% branch point failure rate), and all of these failures occurred in the axon of one neuron and only at frequencies of ≥300 Hz (supplemental Fig. 3, available at www.jneurosci.org as supplemental material). These rare failures were associated with the generation of a spike of unusually low amplitude in the AIS, suggesting that partial inactivation of the Na+ currents in this portion of the axon had occurred (Khaliq and Raman, 2005; Monsivais et al., 2005). Thus, the propagation of action potentials down the main axon and into primary and secondary branches appeared to be highly reliable, especially at frequencies that are typical for simple spike discharge in vivo (<250 Hz) (Thach, 1968; Buttner and Waespe, 1984; Medina and Lisberger, 2009) (Fig. 5B).
In another series of measurements, we monitored and analyzed the initiation and propagation pattern of complex spikes in the axonal arbor. Complex spikes are generated in Purkinje neurons in response to activation of their climbing fiber inputs, and typically consist of a full amplitude action potential followed by one to three sharp depolarizing potentials of smaller amplitude called spikelets. Sometimes, the final action potential of the complex spike is again of larger amplitude (Figs. 6A, 7B) (Khaliq and Raman, 2005; Davie et al., 2008). We examined the point of initiation and axonal propagation of the first full action potentials as well as the subsequent spikelets (Figs. 6, 7). As with simple spikes, the action potentials of the complex spike, both full and partial amplitude, occurred first in the AIS (Fig. 6A–C). Interestingly, however, the spikes initiated closer to the soma than those of simple spike activity. The first full spike of the complex spike initiated at 3.6 ± 1.2 μm from the soma, whereas the first spikelet initiated at 5.2 ± 1.5 μm and the second at 9.2 ± 3.3 μm along the AIS. The initiation of spikes near the soma during complex spikes is likely the result of the large depolarization induced by the massive EPSP generated in the soma and dendrite in response to climbing fiber stimulation.
The first spike of the complex, as a rule, propagated faithfully down the axon and collaterals (Figs. 6A, 7B). Spikelets, however, exhibited a variable probability of propagation down the main axon and consequently into the collaterals. In the cells illustrated in Figures 6 and 7, the first spikelet fails to propagate down the main axon and collaterals, whereas the second spikelet, which is larger in amplitude than the first, propagates with a relatively high probability (Figs. 6, 7; supplemental Fig. 5, available at www.jneurosci.org as supplemental material). Spikelet propagation probability was measured in single trials. The point at which the first spikelet failed to propagate (defined as the point at which the spikelet peak could not be distinguished from the noise) (see Materials and Methods) was relatively consistent and occurred at 40–130 μm from the edge of the soma (X = 94 ± 24 μm; n = 5 cells). Spikelets that did not fail to propagate typically increased in amplitude after the first node of Ranvier and thus presumably became full-amplitude action potentials (Figs. 6, 7). We did not observe failures of propagation along primary or secondary collaterals if the spike or spikelet propagated successfully in the main axon (Fig. 7). We also did not observe any failures of propagation of spikes or spikelets (either during the complex spike or simple spike activity) to propagate into the soma, which has been observed in some cases in cortical pyramidal cells (Shu et al., 2007). Finally, although spikelets sporadically occurred at very high frequency (up to 1000 Hz) in some neurons, the average rate of spikes propagating down the axon during a complex spike was 275 ± 16 Hz (n = 58 complex spikes in 6 neurons).
Discussion
We have demonstrated here that all fast action potentials, whether generated as simple spikes or as part of a complex spike, initiate in the AIS. Simple spikes then propagate, in a saltatory manner and almost without fail at frequencies within the physiological range (less than ∼250 Hz) (Thach, 1968; Buttner and Waespe, 1984; Kahlon and Lisberger, 2000), down the main axon and into primary and secondary axon collaterals. The smaller spikelets of a complex spike often fail to propagate down the main axon, as observed previously (Ito and Simpson, 1971; Campbell and Hesslow, 1986; Khaliq and Raman, 2005; Monsivais et al., 2005). Spike initiation failures mostly occurred at high frequencies (≥350 Hz) and were primarily associated with an inability of the axon initial segment to recover sufficiently from the refractory period after the preceding spike. Axon collateral branch point failures were rarely observed under our conditions.
In mammalian neurons, action potentials typically (but not always) start in the axon initial segment. Cerebellar Purkinje neurons initiate action potentials, of both simple and complex spike variety, in their axons (Stuart and Häusser, 1994; Clark et al., 2005; Monsivais et al., 2005; Khaliq and Raman, 2006). The precise location of this initiation, however, has been to some degree unclear. Immunocytochemical localization of Nav1.6 and Nav1.1 channels reveal a high density in the Purkinje cell AIS, which occupies approximately the first 10–20 μm of the axon (Jenkins and Bennett, 2001). Immediately after the AIS, the main axon is myelinated, with the first node of Ranvier occurring ∼60–150 μm from the cell body (Gianola and Rossi, 2004; Clark et al., 2005; Khaliq and Raman, 2006; Orduz and Llano, 2007). Nodes of Ranvier are associated with a high density of Nav1.6 Na+ channels (Caldwell et al., 2000; Duflocq et al., 2008) and thus represent highly excitable regions. Extrapolation of the action potential initiation point, using group data consisting of extracellular recordings from single axonal locations simultaneous with whole-cell recordings from the soma of Purkinje neurons, has suggested that spikes may initiate in the first node of Ranvier, as opposed to the AIS (Clark et al., 2005).
Pharmacological investigations, however, suggest that action potentials of Purkinje neurons do indeed initiate in the AIS (Khaliq and Raman, 2006). Thus, reduction of Na+ currents in the AIS, but not the first node of Ranvier, results in strong effects on action potential threshold and repetitive spiking characteristics. Our data provide direct and clear evidence that the AIS is the point of initiation of Na+-dependent action potentials in cerebellar Purkinje neurons. On average, the region of the AIS that initiated an action potential earliest during simple spike activity was 16 μm from the soma, near the end of the AIS and the beginning of myelination. In other cell types, this region of the AIS has the lowest local threshold owing in part to a high density of Nav1.6 channels characterized with an activation threshold that is 10–15 mV more negative than other types of Na+ channels (Colbert and Pan, 2002; Boiko et al., 2003; Hu et al., 2009). Another contributing factor is the small size of this compartment with a small capacitive and conductance load, such that the entry of Na+ ions is able to have a rapid and strong effect on local membrane potential. We directly observed saltatory conduction of the action potential in approximately one-half of cells recorded. In these cases, the first node of Ranvier discharged immediately after the AIS, but before the intervening axonal membrane. This “jumping” of the action potential from the AIS to the first node may help to explain previous difficulties in observing the precise location of action potential initiation in Purkinje neurons, since this will significantly shorten the interval between AIS and first node action potentials. During complex spikes, action potentials initiated closer to the soma, with the first spike initiating very near the cell body, and later spikelets initiating a few micrometers further down the AIS. Presumably, this near somatic initiation of the action potentials of the complex spike results from the fast and large depolarization of the somatic-dendritic membrane potential because of the large EPSP generated by the climbing fiber stimulation.
Electrophysiological investigations of invertebrate axons, as well as computational studies (Zhou and Chiu, 2001), have suggested that action potential propagation may fail at branch points (Grossman et al., 1979a,b; Smith, 1980; Debanne, 2004). Direct tests of axonal conduction failures in axon collaterals, or at branch points, in the mammalian brain have been difficult to obtain because of their small size. Simultaneous somatic and extracellular axonal recordings in cerebellar Purkinje cells reveal that conduction failures along the main axon only occur at frequencies greater than ∼250 Hz, and often only after prolonged discharge (Khaliq and Raman, 2005; Monsivais et al., 2005). Although we observed spike initiation failures at these high frequencies, we found that, once a spike was initiated in the AIS, it nearly always propagated down the main axon, and only rarely did it fail to propagate into axon collaterals. Our lack of observation of axon conduction failures, even at high frequencies, may be because we did not examine the effects of prolonged high-frequency discharge, as was done by other investigators (Khaliq and Raman, 2005, 2006; Monsivais et al., 2005). Extracellular recordings from Purkinje neurons in awake, behaving animals indicate that simple spikes typically occur at frequencies of 30–120 Hz, with occasional peaks in firing rate in excess of 250 Hz (Thach, 1968; Buttner and Waespe, 1984; Kahlon and Lisberger, 2000). Thus, failures of propagation of simple spike activity along the main, myelinated, axon and axon collaterals are likely to be rare under normal conditions.
The main axon of Purkinje neurons gives rise to the first axon collateral ∼60–150 μm from the soma. This axonal process typically bends back toward the cell body layer, and gives rise to higher order collaterals that innervate other Purkinje, Golgi, and basket cells (Hamori and Szentagothai, 1968; Larramendi and Lemkey-Johnston, 1970; De Camilli et al., 1984; Watt et al., 2009). Failure of the action potential to propagate into the primary axon collateral was rare and associated with a smaller amplitude action potential in the main axon proximal to the branch point, even through this spike propagated along the main axon past the branch point (supplemental Fig. 3, available at www.jneurosci.org as supplemental material). The smaller amplitude of the action potential in the main axon suggests that these spikes were compromised by falling within the spike refractory period and thus may have not generated enough local current flow in the branch point to initiate a spike in the primary collateral. In other cells, the branch point was observed to boost the action potential, discharging before immediately adjacent regions of the axon, a pattern consistent with branch points containing a high density of Na+ channels (Caldwell et al., 2000; Duflocq et al., 2008). Presumably, once action potentials generated in the AIS are successful at initiating a spike at the first axonal branch point, the boosting of this spike by the local high density of Na+ channels insures the propagation of these spikes into the axon collaterals as well as down the main axon. Thus, not only is the AIS a critical decision point for the transformation of synaptic activity (and intrinsic conductances) into action potential activity, but the region between the AIS and first node of Ranvier functions, particularly during complex spikes, as a critical region for deciding which spikes are propagated and which are not.
Previous electrophysiological recordings from Purkinje cell axons during complex spike generation indicate that many spikelets, especially those of smaller amplitude, may not propagate down the main axon (Ito and Simpson, 1971; Campbell and Hesslow, 1986; Khaliq and Raman, 2005; Monsivais et al., 2005). Similarly, we found that the small spikelets often do not successfully initiate an action potential in the first node of Ranvier after their generation in the AIS and thus fail to propagate down the main axon or into axon collaterals. Using high-resolution Vm imaging, we provide direct evidence for the precise location of both spikelet initiation (see above) and failure. Spikelets, which are small in amplitude, are presumably generated by a significantly reduced inward flux of Na+ ions at the AIS. During failures of propagation, this reduced Na+ current is insufficient to provide enough axial current flow down the main axon to bring the first node of Ranvier to spike threshold, and thus the spikelet fails to propagate between the AIS and the first node (see Results). In vivo, climbing fiber activation typically results in at least two successfully propagating axonal action potentials at 200–300 Hz, followed by a brief pause in action potential activity (Bloedel and Roberts, 1971; Sato et al., 1992). Because of the presence of a large low-threshold Ca2+ current in deep nuclear neurons (Llinás and Mühlethaler, 1988; Aizenman and Linden, 1999), the synchronized discharge and pause of several Purkinje neurons may result in a pause followed by enhanced rebound activity in the output of the cerebellum (McDevitt et al., 1987).
Our results confirm the high fidelity of action potential conduction in mammalian axons (Cox et al., 2000; Koester and Sakmann, 2000; Raastad and Shepherd, 2003; Shu et al., 2007), with relatively rare failures in the main axon occurring as a reduction in AIS spike amplitude (and presumably inward current flow), which subsequently results in an inability of the AIS spike to initiate a full action potential in the first node of Ranvier. During simple spike activity, this appears to have relatively little functional consequence, since propagation failures down the main axon and into axon collaterals were almost completely absent at physiological frequencies. During complex spikes, however, the failure of AIS–first node propagation provides a variable filter on the output of the cerebellar cortex onto their target neurons. Our results also demonstrate that, in cerebellar Purkinje neurons, as in other mammalian cell types, the axon initial segment is the key location for the initiation and propagation of fast, Na+-dependent action potentials and represents a key location for the conversion of synaptic potentials into alterations in neuronal firing rate and timing.
Note added in proof.
Recently, another study confirmed that action potentials initiate in the AIS of Purkinje cells (Palmer et al., 2010).
Footnotes
This work was supported by the National Institutes of Health (D.A.M., D.Z.), the National Science Foundation (NSF) (D.Z.), an NSF graduate research fellowship (A.F.), and the Kavli Institute for Neuroscience at Yale. We thank Sascha du Lac (Salk Institute, La Jolla, CA) for the L7-tau-GFP mice.
References
- Aizenman CD, Linden DJ. Regulation of the rebound depolarization and spontaneous firing patterns of deep nuclear neurons in slices of rat cerebellum. J Neurophysiol. 1999;82:1697–1709. doi: 10.1152/jn.1999.82.4.1697. [DOI] [PubMed] [Google Scholar]
- Antic S, Major G, Zecevic D. Fast optical recordings of membrane potential changes from dendrites of pyramidal neurons. J Neurophysiol. 1999;82:1615–1621. doi: 10.1152/jn.1999.82.3.1615. [DOI] [PubMed] [Google Scholar]
- Antic S, Wuskell JP, Loew L, Zecevic D. Functional profile of the giant metacerebral neuron of Helix aspersa: temporal and spatial dynamics of electrical activity in situ. J Physiol. 2000;527:55–69. doi: 10.1111/j.1469-7793.2000.00055.x. [DOI] [PMC free article] [PubMed] [Google Scholar]
- Bloedel JR, Roberts WJ. Action of climbing fibers in cerebellar cortex of the cat. J Neurophysiol. 1971;34:17–31. doi: 10.1152/jn.1971.34.1.17. [DOI] [PubMed] [Google Scholar]
- Blunck R, Chanda B, Bezanilla F. Nano to micro—fluorescence measurements of electric fields in molecules and genetically specified neurons. J Membr Biol. 2005;208:91–102. doi: 10.1007/s00232-005-0822-z. [DOI] [PubMed] [Google Scholar]
- Boiko T, Van Wart A, Caldwell JH, Levinson SR, Trimmer JS, Matthews G. Functional specialization of the axon initial segment by isoform-specific sodium channel targeting. J Neurosci. 2003;23:2306–2313. doi: 10.1523/JNEUROSCI.23-06-02306.2003. [DOI] [PMC free article] [PubMed] [Google Scholar]
- Büttner U, Waespe W. Purkinje cell activity in the primate flocculus during optokinetic stimulation, smooth pursuit eye movements and VOR-suppression. Exp Brain Res. 1984;55:97–104. doi: 10.1007/BF00240502. [DOI] [PubMed] [Google Scholar]
- Caldwell JH, Schaller KL, Lasher RS, Peles E, Levinson SR. Sodium channel Nav1.6 is localized at nodes of Ranvier, dendrites, and synapses. Proc Natl Acad Sci U S A. 2000;97:5616–5620. doi: 10.1073/pnas.090034797. [DOI] [PMC free article] [PubMed] [Google Scholar]
- Campbell NC, Hesslow G. The secondary spikes of climbing fibre responses recorded from Purkinje cell axons in cat cerebellum. J Physiol. 1986;377:225–235. doi: 10.1113/jphysiol.1986.sp016183. [DOI] [PMC free article] [PubMed] [Google Scholar]
- Canepari M, Djurisic M, Zecevic D. Dendritic signals from rat hippocampal CA1 pyramidal neurons during coincident pre- and post-synaptic activity: a combined voltage- and calcium-imaging study. J Physiol. 2007;580:463–484. doi: 10.1113/jphysiol.2006.125005. [DOI] [PMC free article] [PubMed] [Google Scholar]
- Canepari M, Vogt K, Zecevic D. Combining voltage and calcium imaging from neuronal dendrites. Cell Mol Neurobiol. 2008;28:1079–1093. doi: 10.1007/s10571-008-9285-y. [DOI] [PMC free article] [PubMed] [Google Scholar]
- Canepari M, Willadt S, Zecevic D, Vogt K. Imaging inhibitory synaptic potentials using voltage-sensitive dyes. Biophys J. 2010 doi: 10.1016/j.bpj.2010.01.024. in press. [DOI] [PMC free article] [PubMed] [Google Scholar]
- Chan-Palay V. The recurrent collaterals of Purkinje cell axons: a correlated study of the rat's cerebellar cortex with electron microscopy and the Golgi method. Z Anat Entwicklungsgesch. 1971;134:200–234. doi: 10.1007/BF00519300. [DOI] [PubMed] [Google Scholar]
- Clark BA, Monsivais P, Branco T, London M, Häusser M. The site of action potential initiation in cerebellar Purkinje neurons. Nat Neurosci. 2005;8:137–139. doi: 10.1038/nn1390. [DOI] [PubMed] [Google Scholar]
- Colbert CM, Johnston D. Axonal action-potential initiation and Na+ channel densities in the soma and axon initial segment of subicular pyramidal neurons. J Neurosci. 1996;16:6676–6686. doi: 10.1523/JNEUROSCI.16-21-06676.1996. [DOI] [PMC free article] [PubMed] [Google Scholar]
- Colbert CM, Pan E. Ion channel properties underlying axonal action potential initiation in pyramidal neurons. Nat Neurosci. 2002;5:533–538. doi: 10.1038/nn0602-857. [DOI] [PubMed] [Google Scholar]
- Coombs JS, Curtis DR, Eccles JC. The interpretation of spike potentials of motoneurones. J Physiol. 1957;139:198–231. doi: 10.1113/jphysiol.1957.sp005887. [DOI] [PMC free article] [PubMed] [Google Scholar]
- Cox CL, Denk W, Tank DW, Svoboda K. Action potentials reliably invade axonal arbors of rat neocortical neurons. Proc Natl Acad Sci U S A. 2000;97:9724–9728. doi: 10.1073/pnas.170278697. [DOI] [PMC free article] [PubMed] [Google Scholar]
- Davie JT, Clark BA, Häusser M. The origin of the complex spike in cerebellar Purkinje cells. J Neurosci. 2008;28:7599–7609. doi: 10.1523/JNEUROSCI.0559-08.2008. [DOI] [PMC free article] [PubMed] [Google Scholar]
- Debanne D. Information processing in the axon. Nat Rev Neurosci. 2004;5:304–316. doi: 10.1038/nrn1397. [DOI] [PubMed] [Google Scholar]
- De Camilli P, Miller PE, Levitt P, Walter U, Greengard P. Anatomy of cerebellar Purkinje cells in the rat determined by a specific immunohistochemical marker. Neuroscience. 1984;11:761–817. doi: 10.1016/0306-4522(84)90193-3. [DOI] [PubMed] [Google Scholar]
- Djurisic M, Antic S, Chen WR, Zecevic D. Voltage imaging from dendrites of mitral cells: EPSP attenuation and spike trigger zones. J Neurosci. 2004;24:6703–6714. doi: 10.1523/JNEUROSCI.0307-04.2004. [DOI] [PMC free article] [PubMed] [Google Scholar]
- Duflocq A, Le Bras B, Bullier E, Couraud F, Davenne M. Nav1.1 is predominantly expressed in nodes of Ranvier and axon initial segments. Mol Cell Neurosci. 2008;39:180–192. doi: 10.1016/j.mcn.2008.06.008. [DOI] [PubMed] [Google Scholar]
- Gianola S, Rossi F. GAP-43 overexpression in adult mouse Purkinje cells overrides myelin-derived inhibition of neurite growth. Eur J Neurosci. 2004;19:819–830. doi: 10.1111/j.0953-816x.2004.03190.x. [DOI] [PubMed] [Google Scholar]
- Grossman Y, Parnas I, Spira ME. Differential conduction block in branches of a bifurcating axon. J Physiol. 1979a;295:283–305. doi: 10.1113/jphysiol.1979.sp012969. [DOI] [PMC free article] [PubMed] [Google Scholar]
- Grossman Y, Parnas I, Spira ME. Mechanisms involved in differential conduction of potentials at high frequency in a branching axon. J Physiol. 1979b;295:307–322. doi: 10.1113/jphysiol.1979.sp012970. [DOI] [PMC free article] [PubMed] [Google Scholar]
- Hamori J, Szentagothai J. Identification of synapses formed in the cerebellar cortex by Purkinje axon collaterals: an electron microscope study. Exp Brain Res. 1968;5:118–128. doi: 10.1007/BF00238701. [DOI] [PubMed] [Google Scholar]
- Hasenstaub A, Shu Y, Haider B, Kraushaar U, Duque A, McCormick DA. Inhibitory postsynaptic potentials carry synchronized frequency information in active cortical networks. Neuron. 2005;47:423–435. doi: 10.1016/j.neuron.2005.06.016. [DOI] [PubMed] [Google Scholar]
- Häusser M, Stuart G, Racca C, Sakmann B. Axonal initiation and active dendritic propagation of action potentials in substantia nigra neurons. Neuron. 1995;15:637–647. doi: 10.1016/0896-6273(95)90152-3. [DOI] [PubMed] [Google Scholar]
- Holthoff K, Zecevic D, Konnerth A. Rapid time-course of action potentials in spines and remote dendrites of mouse visual cortical neurons. J Physiol. 2010;588:1085–1096. doi: 10.1113/jphysiol.2009.184960. [DOI] [PMC free article] [PubMed] [Google Scholar]
- Hu W, Tian C, Li T, Yang M, Hou H, Shu Y. Distinct contributions of Nav1.6 and Nav1.2 in action potential initiation and backpropagation. Nat Neurosci. 2009;12:996–1002. doi: 10.1038/nn.2359. [DOI] [PubMed] [Google Scholar]
- Ito M, Simpson JI. Discharges in Purkinje cell axons during climbing fiber activation. Brain Res. 1971;31:215–219. doi: 10.1016/0006-8993(71)90648-2. [DOI] [PubMed] [Google Scholar]
- Jenkins SM, Bennett V. Ankyrin-G coordinates assembly of the spectrin-based membrane skeleton, voltage-gated sodium channels, and L1 CAMs at Purkinje neuron initial segments. J Cell Biol. 2001;155:739–746. doi: 10.1083/jcb.200109026. [DOI] [PMC free article] [PubMed] [Google Scholar]
- Kahlon M, Lisberger SG. Changes in the responses of Purkinje cells in the floccular complex of monkeys after motor learning in smooth pursuit eye movements. J Neurophysiol. 2000;84:2945–2960. doi: 10.1152/jn.2000.84.6.2945. [DOI] [PMC free article] [PubMed] [Google Scholar]
- Khaliq ZM, Raman IM. Axonal propagation of simple and complex spikes in cerebellar Purkinje neurons. J Neurosci. 2005;25:454–463. doi: 10.1523/JNEUROSCI.3045-04.2005. [DOI] [PMC free article] [PubMed] [Google Scholar]
- Khaliq ZM, Raman IM. Relative contributions of axonal and somatic Na channels to action potential initiation in cerebellar Purkinje neurons. J Neurosci. 2006;26:1935–1944. doi: 10.1523/JNEUROSCI.4664-05.2006. [DOI] [PMC free article] [PubMed] [Google Scholar]
- Koester HJ, Sakmann B. Calcium dynamics associated with action potentials in single nerve terminals of pyramidal cells in layer 2/3 of the young rat neocortex. J Physiol. 2000;529:625–646. doi: 10.1111/j.1469-7793.2000.00625.x. [DOI] [PMC free article] [PubMed] [Google Scholar]
- Larramendi LM, Lemkey-Johnston N. The distribution of recurrent Purkinje collateral synapses in the mouse cerebellar cortex: an electron microscopic study. J Comp Neurol. 1970;138:451–459. doi: 10.1002/cne.901380405. [DOI] [PubMed] [Google Scholar]
- Llinás R, Mühlethaler M. Electrophysiology of guinea-pig cerebellar nuclear cells in the in vitro brain stem-cerebellar preparation. J Physiol. 1988;404:241–258. doi: 10.1113/jphysiol.1988.sp017288. [DOI] [PMC free article] [PubMed] [Google Scholar]
- Mackenzie PJ, Murphy TH. High safety factor for action potential conduction along axons but not dendrites of cultured hippocampal and cortical neurons. J Neurophysiol. 1998;80:2089–2101. doi: 10.1152/jn.1998.80.4.2089. [DOI] [PubMed] [Google Scholar]
- Malmstadt H, Enke CG, Grouch SR. Menlo Park, CA: W. A. Benjamin; 1974. Electronic measurements for scientists. [Google Scholar]
- Martina M, Vida I, Jonas P. Distal initiation and active propagation of action potentials in interneuron dendrites. Science. 2000;287:295–300. doi: 10.1126/science.287.5451.295. [DOI] [PubMed] [Google Scholar]
- McCormick DA, Connors BW, Lighthall JW, Prince DA. Comparative electrophysiology of pyramidal and sparsely spiny stellate neurons of the neocortex. J Neurophysiol. 1985;54:782–806. doi: 10.1152/jn.1985.54.4.782. [DOI] [PubMed] [Google Scholar]
- McDevitt CJ, Ebner TJ, Bloedel JR. Changes in the responses of cerebellar nuclear neurons associated with the climbing fiber response of Purkinje cells. Brain Res. 1987;425:14–24. doi: 10.1016/0006-8993(87)90478-1. [DOI] [PubMed] [Google Scholar]
- Medina JF, Lisberger SG. Encoding and decoding of learned smooth-pursuit eye movements in the floccular complex of the monkey cerebellum. J Neurophysiol. 2009;102:2039–2054. doi: 10.1152/jn.00075.2009. [DOI] [PMC free article] [PubMed] [Google Scholar]
- Meeks JP, Jiang X, Mennerick S. Action potential fidelity during normal and epileptiform activity in paired soma-axon recordings from rat hippocampus. J Physiol. 2005;566:425–441. doi: 10.1113/jphysiol.2005.089086. [DOI] [PMC free article] [PubMed] [Google Scholar]
- Monsivais P, Clark BA, Roth A, Häusser M. Determinants of action potential propagation in cerebellar Purkinje cell axons. J Neurosci. 2005;25:464–472. doi: 10.1523/JNEUROSCI.3871-04.2005. [DOI] [PMC free article] [PubMed] [Google Scholar]
- Orduz D, Llano I. Recurrent axon collaterals underlie facilitating synapses between cerebellar Purkinje cells. Proc Natl Acad Sci U S A. 2007;104:17831–17836. doi: 10.1073/pnas.0707489104. [DOI] [PMC free article] [PubMed] [Google Scholar]
- Palmer LM, Stuart GJ. Site of action potential initiation in layer 5 pyramidal neurons. J Neurosci. 2006;26:1854–1863. doi: 10.1523/JNEUROSCI.4812-05.2006. [DOI] [PMC free article] [PubMed] [Google Scholar]
- Palmer LM, Clark BA, Grundemann J, Roth A, Stuart G, Hausser M. Initiation of simple and complex spikes in cerebellar Purkinje cells. J Physiol. 2010 doi: 10.1113/jphysiol.2010.188300. [DOI] [PMC free article] [PubMed] [Google Scholar]
- Raastad M, Shepherd GM. Single-axon action potentials in the rat hippocampal cortex. J Physiol. 2003;548:745–752. doi: 10.1113/jphysiol.2002.032706. [DOI] [PMC free article] [PubMed] [Google Scholar]
- Raman IM, Bean BP. Ionic currents underlying spontaneous action potentials in isolated cerebellar Purkinje neurons. J Neurosci. 1999;19:1663–1674. doi: 10.1523/JNEUROSCI.19-05-01663.1999. [DOI] [PMC free article] [PubMed] [Google Scholar]
- Ross WN, Krauthamer V. Optical measurements of potential changes in axons and processes of neurons of a barnacle ganglion. J Neurosci. 1984;4:659–672. doi: 10.1523/JNEUROSCI.04-03-00659.1984. [DOI] [PMC free article] [PubMed] [Google Scholar]
- Sato Y, Miura A, Fushiki H, Kawasaki T. Short-term modulation of cerebellar Purkinje cell activity after spontaneous climbing fiber input. J Neurophysiol. 1992;68:2051–2062. doi: 10.1152/jn.1992.68.6.2051. [DOI] [PubMed] [Google Scholar]
- Shu Y, Duque A, Yu Y, Haider B, McCormick DA. Properties of action-potential initiation in neocortical pyramidal cells: evidence from whole cell axon recordings. J Neurophysiol. 2007;97:746–760. doi: 10.1152/jn.00922.2006. [DOI] [PubMed] [Google Scholar]
- Smith DO. Mechanisms of action potential propagation failure at sites of axon branching in the crayfish. J Physiol. 1980;301:243–259. doi: 10.1113/jphysiol.1980.sp013202. [DOI] [PMC free article] [PubMed] [Google Scholar]
- Stuart G, Häusser M. Initiation and spread of sodium action potentials in cerebellar Purkinje cells. Neuron. 1994;13:703–712. doi: 10.1016/0896-6273(94)90037-x. [DOI] [PubMed] [Google Scholar]
- Stuart G, Schiller J, Sakmann B. Action potential initiation and propagation in rat neocortical pyramidal neurons. J Physiol. 1997;505:617–632. doi: 10.1111/j.1469-7793.1997.617ba.x. [DOI] [PMC free article] [PubMed] [Google Scholar]
- Thach WT. Discharge of Purkinje and cerebellar nuclear neurons during rapidly alternating arm movements in the monkey. J Neurophysiol. 1968;31:785–797. doi: 10.1152/jn.1968.31.5.785. [DOI] [PubMed] [Google Scholar]
- Watt AJ, Cuntz H, Mori M, Nusser Z, Sjöström PJ, Häusser M. Traveling waves in developing cerebellar cortex mediated by asymmetrical Purkinje cell connectivity. Nat Neurosci. 2009;12:463–473. doi: 10.1038/nn.2285. [DOI] [PMC free article] [PubMed] [Google Scholar]
- Yau KW. Receptive fields, geometry and conduction block of sensory neurones in the central nervous system of the leech. J Physiol. 1976;263:513–538. doi: 10.1113/jphysiol.1976.sp011643. [DOI] [PMC free article] [PubMed] [Google Scholar]
- Zhou L, Chiu SY. Computer model for action potential propagation through branch point in myelinated nerves. J Neurophysiol. 2001;85:197–210. doi: 10.1152/jn.2001.85.1.197. [DOI] [PubMed] [Google Scholar]