

Abstract
Metabolic coupling of Mycobacterium tuberculosis to its host is foundational to its pathogenesis. Computational genome-scale metabolic models have shown utility in integrating -omic as well as physiologic data for systemic, mechanistic analysis of metabolism. To date, integrative analysis of host–pathogen interactions using in silico mass-balanced, genome-scale models has not been performed. We, therefore, constructed a cell-specific alveolar macrophage model, iAB-AMØ-1410, from the global human metabolic reconstruction, Recon 1. The model successfully predicted experimentally verified ATP and nitric oxide production rates in macrophages. This model was then integrated with an M. tuberculosis H37Rv model, iNJ661, to build an integrated host–pathogen genome-scale reconstruction, iAB-AMØ-1410-Mt-661. The integrated host–pathogen network enables simulation of the metabolic changes during infection. The resulting reaction activity and gene essentiality targets of the integrated model represent an altered infectious state. High-throughput data from infected macrophages were mapped onto the host–pathogen network and were able to describe three distinct pathological states. Integrated host–pathogen reconstructions thus form a foundation upon which understanding the biology and pathophysiology of infections can be developed.
Keywords: computational biology, host–pathogen, Mycobacterium tuberculosis, systems biology, macrophage
Introduction
Mycobacterium tuberculosis (M. tb) is a highly persistent pathogen that primarily affects the third world. About one-third of the world's population is infected, with 9.27 million new cases and 1.76 million deaths in 2007 (WHO, 2009). Furthermore, the development of multidrug-resistant tuberculosis and extensively drug-resistant tuberculosis, which are infections that cannot be treated with first-line and second-line drugs, respectively, continue to keep M. tb a concern in developed countries.
A key aspect of M. tb's pathogenicity is its ability to dramatically change its metabolism in different states. After infecting an alveolar macrophage, M. tb shifts into an infectious state, stopping biomass accumulation. M. tb also accumulates mycolic and fatty acids on its cell wall in order to survive a very hostile phagosome environment that is nutrient poor, hypoxic, nitrosative, and oxidative (Schnappinger et al, 2003). The mycolic and fatty acids are essential to M. tb's resistance to drug therapies (Barkan et al, 2009). Under a latent state, the pathogen cannot be spread and the patient is not in danger. However, latent tuberculosis can activate in the lungs (75% of cases) or other parts of the body.
The lack of proper experimental M. tb models that provide a mechanistic understanding of in vivo conditions hinders a better understanding of the infection process (Boshoff and Barry, 2005). It is not only difficult to work with M. tb because of its slow growth rate, but most in vitro models are inaccurate simulations of in vivo conditions. In vivo animal models better characterize the disease, but there is less control over experimental conditions.
Genome-scale metabolic reconstructions are useful for increasing the understanding of the genotype/phenotype relationship in organisms (Oberhardt et al, 2009). These networks are built in a bottom–up manner in which the nodes (metabolites) are connected by links (biochemical transformations and reactions) as defined by genetic and physiological data (Palsson, 2004; Reed et al, 2006). There are now genome-scale reconstructions for numerous prokaryotes (Thiele et al, 2005; Feist et al, 2007), including two such networks for M. tb (Beste et al, 2007; Jamshidi and Palsson, 2007) and eukaryotes (Duarte et al, 2004; Sheikh et al, 2005). In addition, the global human metabolic network, Recon 1, has been reconstructed (Duarte et al, 2007) containing all the annotated biochemical reactions for human cells. Recon 1 has sparked interest in building specific networks for different human tissues and cells.
As the number of genome-scale reconstructions increases, there has been interest in building networks that characterize the metabolic interaction between multiple organisms. In this study, we looked to increase the understanding of the metabolic changes in both the host (alveolar macrophage) and the pathogen (M. tb) during infection through the use of a host–pathogen genome-scale reconstruction. We did this by first building a manually curated cell-specific human network for the alveolar macrophage. We then integrated the host model (HM) with the pathogen model (PM) (iNJ661) to form the host–pathogen model (HPM). We used established constraint-based analysis methods (Becker et al, 2007) and published gene expression data for M. tb infections to further our understanding of macrophage and M. tb metabolic functions.
Results
Interrogation of the interactions between an HM and PM required completing four steps: (1) construction of the alveolar macrophage HM, (2) adaptation of the M. tb PM, (3) integration of the two into an HPM, and (4) analysis of the resulting HPM in different contexts. These analyses led to three general observations,
Integration of the PM into the HM both reduced the size and altered the solution space of both models. The changes in the PM were primarily because of the interfacial constraints set on the network.
Analysis of the PM portion of the HPM improved gene essentiality predictions.
The HPM enabled analysis of complex data sets from complex experimental conditions and was able to highlight differences in metabolism through the comparison of the three infectious states.
Constructing the HM: human alveolar macrophage, iAB-AMØ-1410
Reconstruction of the global alveolar macrophage network was a time intensive two-step process beginning with algorithmic tailoring of Recon 1 followed by a set of manual curation steps (Figure 1). Using gene expression data from inactive macrophages, maximum enzyme fluxes, and exchange data for the macrophage (see Supplementary information), two preliminary models were built using two different previously published algorithms (Becker and Palsson, 2008; Shlomi et al, 2008). These algorithms produced context-specific, not global, models that were the best fit of reaction flux and pathway length to the gene expression and exchange data. All other inactive and dead-end reactions were removed by these algorithms. Unfortunately, macrophages are known to have varied gene expression states, such as during infection and inflammation; therefore, the algorithms do not take into account other potential states. In fact, both algorithms failed to include nitric oxide synthase, which is critical for nitric oxide production. This is due to the initial gene expression data used for inactive alveolar macrophages. Hence, a global, consensus model was constructed through manual curation and reconciliation of the two models. Manual curation was conducted using primary literature, enzyme, and immunohistological databases, and network structure and requirements. The global model included all inactive and dead-end reactions to provide opportunities for further research with different exchange constraints and to allow for future gap filling, respectively. The resulting HM was named iAB-AMØ-1410 for i (in silico), AB (the primary author's initials), AMØ (alveolar macrophage), 1410 (number of open reading frames).
Figure 1.

Workflow of building the cell-specific model iAB-AMØ-1410. Gene expression data for alveolar macrophages and macrophage-specific exchanges were fed into two model building algorithms (GIMME and Shlomi-NBT-08) to build two preliminary context-specific alveolar macrophage networks. Using enzyme databases (BRENDA and HPRD), immunohistological staining databases (Human Protein Atlas), transporter databases (HMTD), primary literature (see Supplementary information), and network features, the preliminary models were reconciled and manually curated into the final iAB-AMØ-1410.
Characterizing the HM, iAB-AMØ-1410
The iAB-AMØ-1410 model has many of the capabilities of Recon 1 because of its high number of reactions (intracellular: 3012) and active genes (1410) (Figure 2A). In addition, the HM maintains a high reaction count from all major subsystems (Figure 2B). Macrophages are known to be highly metabolically active as well as have many different metabolic states because of varied patterns of gene expression (Gordon, 2007). A biomass maintenance function was formulated (see Materials and methods) and used to constrain the HM. The metabolic components of the biomass maintenance function are detailed in the Supplementary information. As macrophages do not readily multiply, the biomass maintenance function used here represents cellular maintenance requirements, such as lipid, protein, mRNA turnover, DNA repair, and ATP maintenance.
Figure 2.

Comparison of reactions and network capabilities of iAB-AMØ-1410 and the global human network (Recon 1). (A) The overall gene and reaction counts of Recon 1 and iAB- AMØ-1410 are provided. The majority of genes and reactions are preserved. (B) Most reactions were included in the final macrophage network. The largest reductions in number of reactions by subsystem were in amino-acid, lipid, and polysaccharide metabolism. Carbohydrate and central metabolism were well preserved as expected. (C) In stark contrast to the number of reactions included, the network capabilities of iAB-AMØ-1410 are much reduced as compared with Recon 1. Large reductions of metabolic functions occurred in polysaccharide, cofactor, amino-acid, and nucleotide metabolism. This is due in part to removing key reactions from Recon 1, but more importantly to the exchange constraints of the model.
A series of tests were used to validate the macrophage model. We first tested ATP production of the macrophage model. We optimized the HM for ATP production yielding a flux of 0.6843 mmol/h/g cell DW (4C). In vitro experiments with macrophages yielded an ATP generation rate of 0.7121 mmol/h/g cell DW (Newsholme et al, 1999). This puts the HM at a production accuracy of 96.1%. Second, we simulated nitric oxide production, which is another important metabolic capacity of macrophages. Maximum nitric oxide production in silico was 0.0359 mmol/h/g cell DW, which is 1.7% lower than the maximum in vitro rate of 0.0365 mmol/h/g cell DW (Griscavage et al, 1993). The macrophage is also highly anaerobic in its growth despite its uptake of oxygen (Newsholme et al, 1999). Macrophages have high production rates of lactate (Burke and Lewis, 2002) because of high glucose oxidation very similar to the Warburg effect (Warburg, 1956). Consistent with this phenotype, the HM predicts a high glucose oxidation rate and produces 0.3093 mmol/h/g cell DW of lactate.
Figure 4.

Schematic of the integration and results of the alveolar macrophage (iAB-AMØ-1410) and Mycobacterium tuberculosis (iNJ661) reconstructions. (A) Metabolic links between the extracellular space (e), alveolar macrophage (am), phagosome (ph), and Mycobacterium tuberculosis (mt) in iAB-AMØ-1410-Mt-661. The model is compartmentalized using the abbreviations as shown. The major carbon sources of the alveolar macrophage are glucose and glutamine. The macrophage is also aerobic and requires the essential amino acids. Albeit its use of oxygen, the macrophage exhibits anaerobic respiration and produces much lactate. The major carbon sources available for M. tb in the phagosome environment are glycerol and fatty acids. The phagosome environment is also functionally hypoxic. (B) The flux span of iAB-AMØ-1410-Mt-661 is significantly reduced (51%) compared with iAB-AMØ-1410. This shows a stricter definition of the alveolar macrophage solution space without adding additional constraints on the alveolar macrophage portion of the network. (C) Reaction, metabolite, and gene properties of the three reconstructions. Maximum production rates of ATP, nitric oxide, redox potential (NADH), and biomass are shown.
Recon 1 was characterized and validated by showing its potential in accomplishing 288 metabolic functions with the proper exchange constraints. A similar assessment of the HM was performed using the same 288 metabolic functions of Recon 1 (see Supplementary information). Unlike the reaction count (Figure 2B), the HM does not preserve the comprehensive metabolic functions of Recon 1 (Figure 2C), as would be expected. Important metabolic functions dealing with carbohydrate and central metabolism are well preserved. However, several peripheral metabolic functions such as amino-acid, lipid, cofactor, and nucleotide metabolism were not preserved. There are two reasons for this. First, removing a few reactions from Recon 1 to build the HM does not significantly affect the reaction count, but it can have significant effects on functional pathways. Second, the 288 metabolic functions were originally characterized in Recon 1 using open exchange constraints. In this study, we ran all simulations using the macrophage exchange constraints, which can have substantive effects on output. For example, most metabolic functions in the miscellaneous category dealt with growth under different substrates. As there was no literature support for the macrophage to import some of these metabolites, the simulations were deemed as failures.
Infection in silico, the HPM: iAB-AMØ-1410-Mt-661
The alveolar macrophage network, iAB-AMØ-1410, was integrated with the M. tb network, iNJ661. The integration involved three steps: mathematical integration, setting interfacial constraints, and revision of the objective function (Figure 3). Integration had a few preparatory steps. We renamed reactions and metabolites for proper compartmentalization, added transporter reactions that linked the alveolar macrophage cytosol with a new phagosome compartment, and modified iNJ661 to uptake metabolites from the phagosome rather than the extracellular compartment. M. tb blocks certain signaling pathways to hinder maturation of the phagosome into the phagolysosome (Pieters, 2008). Without the formation of the phagolysosome, M. tb is able to survive within the phagosome. After these preparatory steps, the two stoichiometric matrices were mathematically combined. In doing so, we created a modularized network with M. tb residing in the macrophage phagosome, using resources from its host (Figure 4A). The final model was named iAB-AMØ-1410-Mt-661, which added the first letter of the genus and species name (Mt) of the pathogen and 661 for the number of open reading frames.
Figure 3.

Workflow of building the host–pathogen model, iAB-AMØ-1410-Mt-661. Integration involved combining the two stoichiometric matrices, recompartmentalizing the metabolites and reactions, and creating a relevant phagosome environment through transport and sink reactions. In order to characterize the model under in vivo conditions, the biomass objective function was revised. Using gene expression data from infectious states in vitro and in vivo, the objective function was iteratively modified to match gene expression tests completed by sampling the solution space. The new objective function better represents the metabolic activity of the pathogen under in vivo conditions.
Upon integration, it was readily apparent that a proper infectious state could not be simulated unless interfacial constraints were set between the HM and PM, as the PM would take up any metabolite from the HM. Thus, we set interfacial exchange constraints based on literature. In the phagosome, M. tb is under hypoxic conditions (Honer zu Bentrup and Russell, 2001) and oxidative stress from metabolites such as nitric oxide (Schnappinger et al, 2003). In addition, glucose is depleted and the pathogen is dependent on glycerol and fatty acids (McKinney et al, 2000; Schnappinger et al, 2003) as a carbon source. Interestingly, the PM would not grow in silico unless there was a minimal oxygen uptake, consistent with functional hypoxia as opposed to anoxia. M. tb biomass production was compared with M. tb oxygen uptake showing a linear dependence on oxygen until an uptake of 0.129 mmol/h/g cell DW was reached, in which additional oxygen did not increase the biomass value (Supplementary Figure S1). The uptake represented 13.2% of the in vitro uptake rate (Jamshidi and Palsson, 2007), which was used for simulations. The oxygen M. tb biomass curve is consistent with existing knowledge that reduced oxygen is associated with slowed M. tb growth and disease progression (Rustad et al, 2009). In addition, in vitro studies lowering partial pressure of oxygen below 1% of normal conditions have shown to fully halt M. tb replication (Yuan et al, 1998). A detailed listing of the exchange constraints of in vitro (iNJ661) and in vivo (iAB-AMØ-1410-Mt-661) networks for M. tb is provided in the Supplementary information.
The third integration step involved revision of the iNJ661 objective function (biomass) to better represent an acute infection. The original biomass function for the PM was formulated to represent rapid growth in mid-log phase. In mid-log phase, the pathogen tries to accumulate biomass by dividing rapidly. However, under in vivo conditions, the pathogen survives in the phagosome's harsh environment, resulting in an altered metabolic state. In order to build a new objective function, we used M. tb gene expression data derived from in vivo mouse model studies (Talaat et al, 2004; Shi et al, 2005) as well as infection simulated in vitro studies (Bacon et al, 2004; Hampshire et al, 2004; Voskuil et al, 2004). Though the in vivo expression profiling studies came from mouse and in vitro simulated models, the studies represent the best available transcriptional profiling of M. tb during an infectious state. There have been some noted differences, especially in nitric oxide production mechanisms between murine and human macrophages (Schneemann and Schoeden, 2007), but the human alveolar macrophage is able to produce nitric oxide in a similar manner to murine macrophages (Rich et al, 1997).
The biomass reaction is a demand function that pulls resources from the metabolic model. Each metabolite in the biomass affects reaction activity and hence, the final solution space. We hypothesized that by using the known differential reaction activity determined by differentially expressed genes, an altered infection-specific solution space could be defined by tailoring the PM's biomass objective function. Using randomized sampling, we characterized the solution space for each metabolic component in the biomass function, individually. Using linear regression in an iterative manner, we added and removed metabolic components of the biomass objective function to develop a new objective function (Table I) with a solution space that best fit the gene expression data. Particularly, we removed phenolic glycolipids from the M. tb infection objective function. These computationally driven revisions were confirmed with established experimental data that showed that M. tb H37Rv clinical strains lack biosynthesis of phenolic glycolipids (Constant et al, 2002).
Table 1. Modifications of the original iNJ661 biomass objective function to produce the final infectious state Mycobacterium tuberculosis objective function.
| Infectious state Mycobacterium tuberculosis objective function components | |||
|---|---|---|---|
| Original | Increased | Reduced | Removed |
| RNA | Amino acids | ATP maintenance | Peptidoglycans |
| Mycobactin | DNA | Phenolic glycolipids | |
| Mycocerosates | Fatty acids | ||
| Mycolic acids | Phospholipids | ||
| Sugars | |||
Characterizing the metabolism of the HPM
The macrophage component of the integrated HPM is similar to iAB-AMØ-1410, with an M. tb component, which is starkly different from iNJ661. The integration radically affected the major objective function fluxes of the macrophage and M. tb components (Figure 4C). The maximum macrophage biomass was slightly reduced (∼12%), while maximum ATP, nitric oxide, and NADH production were significantly reduced (∼75, ∼55, and ∼70%, respectively). Such a large reduction in ATP, nitric oxide, and NADH production points toward a weakened or compromised alveolar macrophage. The M. tb biomass function was also greatly reduced. We then compared the size of the macrophage solution space in the HM and the HPM (Figure 4B). There was a significant reduction in the size of the solution space (51% reduction of the mean reaction flux span). By adding the M. tb model to the alveolar macrophage reconstruction, we were able to substantially decrease the solution space without adding any additional constraints on the internal reactions of the macrophage portion of the network. Only two reactions had a larger flux span: the exchanges of sulfate and phosphate. The reactions with the largest flux span reduction (>70%) dealt with fatty acid, lipid, and proteoglycan metabolism as well as transport reactions. The M. tb network tightened the flexibility of these reactions because of its need for fatty acids and glycerol.
Changes in reaction activity of iAB-AMØ-1410-Mt-661
Using randomized sampling, we identified the distribution of all feasible steady states for each reaction in iAB-AMØ-1410, iNJ661, and iAB-AMØ-1410-Mt-661. Statistically significant up- and down-regulated reactions in the integrated HPM were identified after in silico phagocytosis of M. tb. The majority of differences are seen in the M. tb portion of the integrated model, which was expected because of the changes in exchange constraints and revised objective function. However, there are also some differences in the alveolar macrophage portion of the network.
The changes in flux states of the M. tb portion of the HPM show a shift in carbon uptake and overall usage. There are major shifts in flux states in central metabolism. Glycolysis is suppressed (Figure 5, ENO) with the production of acetyl-CoA coming from fatty acids through the glyoxylate shunt (Figure 5, ICL). In addition, glucose is generated from gluconeogenesis (Figure 5, FBP). Beyond central metabolism, there are several changes. For example, there is an up-regulation of fatty acid oxidation pathways, as fatty acids become a major carbon source. In addition, there is a shift toward mycobactin and mycolic acid synthesis. Production of nucleotides, peptidoglycans, and phenolic glycolipids is also reduced. Thus, the model more accurately described an infectious state for M. tb. Overall, 75 reactions were up-regulated, while 128 reactions were suppressed. A full listing of reactions, associated genes, and their flux states are provided in the Supplementary information.
Figure 5.

Topological map of the metabolites and reactions in the central metabolism of M. tb. The map shows predicted change of expression states when comparing in vivo (iAB-AMØ-1410-Mt-661) and in vitro (iNJ661) conditions. The expression states were determined from the change in the solution space by randomized sampling. Reactions that were up-regulated in iAB-AMØ-1410-Mt-661 are labeled in green, while down-regulated reactions are labeled in red. Pathways pertaining to glyoxylate metabolism were up-regulated while glycolysis is down-regulated. The sampling results of three key reactions of central metabolism are shown. Isocitrate lyase (ICL) and fructose bisphosphatase (FBP) are up-regulated in iAB-AMØ-1410-Mt-661, while enolase (ENO) is down-regulated. It is important to note that the results are absolute values of the normalized values. The flux state of enolase in iAB-AMØ-1410-Mt-661 is negative suggesting gluconeogenesis.
There are fewer changes in the alveolar macrophage portion of the integrated model. Only 8 reactions were up-regulated and 46 reactions were down-regulated. There is a higher reliance on glycolysis as reported by a much greater activity through phosphoglycerate mutase and enolase. In addition, reactions in the pathways for nitric oxide production are up-regulated. However, the majority of the changes were down-regulations of ATP production, nucleotide synthesis, and amino-acid metabolism. The changes in flux states of the alveolar macrophage during infection point toward a suppressed metabolic state that has a high reliance on glucose oxidation.
Gene essentiality predictions
Interestingly, by modeling the host and pathogen together, we were able to increase the accuracy of gene deletion tests. Single gene essentiality predictions were completed for the M. tb portion of the HPM and compared with the results from iNJ661. Model predictions were improved for essential as well as non-essential genes when compared with experimental data. In total, the PM predicts 188 essential metabolic genes, while the HPM predicts 162. Predictions from the two networks overlap with 153 similarly predicted genes (see Supplementary information). The non-overlapping predictions are shown in Tables II and III.
Table 2. Genes predicted to be essential in iAB-AMØ-1410-Mt-661.
| ID | Gene | Function/reaction | TraSH support |
|---|---|---|---|
| aDenotes genes that were shown to be essential in other experimental publications. | |||
| Rv0252 | nirB | Nitrite reductase | No |
| Rv0253 | nirD | Nitrite reductase | — |
| Rv0363c | fba | Fructose-bisphosphate aldolase | — |
| Rv0946c | pgi | Glucose-6-phosphate isomerase | — |
| Rv1099c | Fructose-bisphosphatase | Yes | |
| Rv1161 | narG | Nitrate reductase | Noa |
| Rv1162 | narH | Nitrate reductase | Noa |
| Rv1163 | narJ | Nitrate reductase | Noa |
| Rv1164 | narI | Nitrate reductase | Noa |
| Rv1475c | acn | Aconitase | — |
| Rv2391 | sirA | Sulfite reductase | Yes |
Table 3. Genes predicted to be unessential in iAB-AMØ-1410-Mt-661.
| ID | Gene | Function/reaction | TraSH support |
|---|---|---|---|
| Rv0334 | rmlA | Nucleotidyl transferase | |
| Rv0482 | murB | Aminosugars metabolism | Yes |
| Rv1011 | ispE | Terpenoid biosynthesis | |
| Rv1018c | glmU | Nucleotidyl transferase | Yes |
| Rv1086 | — | Geranyltranstransferase | Yes |
| Rv1302 | rfe | Peptidoglycan metabolism | Yes |
| Rv1315 | murA | UDP-N-acetylglucosamine 1-carboxyvinyltransferase | |
| Rv1338 | murI | Glutamate racemase | No |
| Rv1512 | epiA | Nucleotide-sugar epimerase | |
| Rv2136c | — | (Un)decaprenyl-diphosphatase | Yes |
| Rv2152c | murC | UDP-N-acetylmuramate-alanine ligase | |
| Rv2153c | murG | N-acetylglucosamine transferase | |
| Rv2155c | murD | UDP-N-acetylmuramoylalanine-D-glutamate ligase | |
| Rv2156c | murX | Phospho-N-acetylmuramoyl-pentappeptidetransferase | |
| Rv2157c | murF | UDP-N-acetylmuramoyl-tripeptide-D-alanyl-D-alanine ligase | |
| Rv2158c | murE | UDP-N-acetylmuramoylalanyl-D-glutamate-2,6-diaminopimelat E ligase | |
| Rv2163c | pbpB | Peptidoglycan subunit synthesis | |
| Rv2870c | dxr | 1-deoxy-D-xylulose 5-phosphate reductoisomerase | Yes |
| Rv2957 | — | Glycosyltransferase | Yes |
| Rv2958c | — | Glycosyltransferase | Yes |
| Rv2962c | — | Glycosyltransferase | Yes |
| Rv2981c | ddlA | D-alanine-D-alanine ligase | No |
| Rv3265c | wbbL1 | Rhamnosyltransferase | Yes |
| Rv3266c | rmlD | dTDP-6-deoxy-L-lyxo-4-hexulose reductase | Yes |
| Rv3398c | idsA1 | Dimethylallyltranstransferase | |
| Rv3423c | alr | Alanine racemase | |
| Rv3436c | glmS | Glutamine-fructose-6-phosphate transaminase | |
| Rv3465 | rmlC | dTDP-4-dehydrorhamnose 3,5-epimerase | |
| Rv3581c | ispF | 2-C-methyl-D-erythritol 2,4-cyclodiphosphate synthase | |
| Rv3582c | ispD | 2-C-methyl-D-erythritol 4-phosphate cytidylyltransferase | |
| Rv3792 | — | Arabinofuranosyl transferase | |
| Rv3793 | embC | Arabinofuranosyl extension | |
| Rv3794 | embA | Arabinofuranosyl extension | No |
| Rv3795 | embB | Arabinofuranosyl extension | |
| Rv3808c | glfT | Galactofuranose transferase | |
| Rv3809c | glf | UDP-galactopyranose mutase | Yes |
| Rv3818 | — | UDP-MurNAc hydroxylase |
The changes in gene essentiality were compared with published in vivo experimental data (Sassetti and Rubin, 2003). Using Transposon Site Hybridization (TraSH), Sassetti and Rubin identified M. tb genes that are essential for survival in a mouse lung model. A total of 374 of 2972 M. tb genes assessed using TraSH overlap with the metabolic models used here. For the nine genes that were predicted as essential solely in the HPM, two are supported by the TraSH data, while five contradict it. Four of the contradictions are components of nitrate reductase (narGHIJ). Though the TraSH data does not support it, Sohaskey (2008) has shown that nitrate reduction enhances M. tb survival under sudden stresses of hypoxia and nitric oxide, which M. tb is under during the infectious state. In addition, our gene essentiality results are further validated by in vitro M. tb tests (Pinto et al, 2007) of the essentiality of sulfite reduction (sirA).
Thirty-five genes are predicted to be essential in the PM, but non-essential in the HPM. Of the 35 genes, 12 are also non-essential in TraSH. Only two genes (murI, embA) conflict with the TraSH data. The majority of the genes deal with peptidoglycan metabolism and membrane metabolism. Such a change from in vitro conditions shows a shift from division and production of biomass to a more specific infectious state dealing with a harsh phagosome environment. Hence, genes that deal with membrane and cell wall components are less likely to affect the survival of M. tb in vivo.
The changes in our new objective function (Table I) deduced by gene expression data is key for the non-essential predictions. The 35 genes are predicted as non-essential only in the HPM with the revised objective function for M. tb. Removal of peptidoglycan and phenolic glycolipid components of the objective function increased prediction accuracy with the HPM as evidenced with better correspondence with in vivo data (TraSH), which also further supported the condition-specific objective function reformulation.
Host–pathogen interactions in different infectious states
M. tb is an insidious pathogen and can remain latent for many years before actively infecting a host. Furthermore, its clinical presentation can be extremely varying and it can infect every organ system. Antibiotic treatment regimens are often tailored for different types of tissue infections, based on their ability to penetrate different tissues. In an analogous manner, infections in different tissues may involve activation of different metabolic pathways in the host and pathogen. Hence, depending on the nature of the infection and the type of tissue affected, different treatment regiments may be appropriate. We sought to determine the activity of metabolic pathways in both the macrophage and M. tb in order to better understand M. tb infections and predict potential drug targets. In this study, we analyzed differences between active infections in two different tissues as well as latent tuberculosis.
An important application of genome-scale metabolic network reconstructions is to provide a biologically meaningful context for the analysis of large data sets, that is a ‘context for content’ (Oberhardt et al, 2009). High-throughput data such as gene expression profiles can be mapped to the reconstructions and subsequently analyzed to evaluate functional consequences of changes in expressions levels of genes. We mapped expression data (Thuong et al, 2008) of macrophages from different M. tb infectious states (latent, pulmonary, meningeal) onto the HPM (iAB-AMØ-1410-Mt-661) and built three infection-specific models: iAB-AMØ-1410-Mt-661L (HPM-L), iAB-AMØ-1410-Mt-661P (HPM-P), and iAB-AMØ-1410-Mt-661M (HPM-M), which can then be compared based on the differentially active and inactive reactions in the three states in both the macrophage and M. tb determined by flux variability analysis (Figure 6). A full detailing of the approach is provided in Materials and methods.
Figure 6.

Reaction comparison of the three infection-specific models of iAB-AMØ-1410-Mt-661 for latent, pulmonary, and meningeal tuberculosis. (A) We used macrophage gene expression data from three types of M. tb infections to build context-specific models of iAB-AMØ-1410-Mt-661 for latent (L), pulmonary (P), and meningeal (M) tuberculosis. The models had significant differences in reactions for the macrophage and surprisingly M. tb. (B) There were many reactions with disparate activity between the three infections. We determined the subsystems of the reactions with differential activity. (C) The total number of disparate reactions was calculated. The left-most panel shows the macrophage reactions shown to be active in each state as calculated from the expression profile. This data was then used with the GIMME algorithm to build three flux-balance models using iAB-AMØ-1410-Mt-661. The middle diagram shows the active M. tb reactions in each model. The right-most diagram shows the active macrophage reactions in each model.
The majority of differences in active reactions were found in the macrophage (Figure 6B and C). This is expected because of the expression profile data coming from the macrophage. We saw two main discrepancies in active macrophage reactions between the three different types of infections. First, hyaluronan synthesis and exchange was active only in the HPM-P. This suggests that hyaluronan is produced and secreted into the extracellular space. Hyaluronan is important for cell proliferation, especially for progression of some malignant tumors (Itano et al, 2008). It seems that hyaluronan could have an important function as a carbon source for pulmonary M. tb. In fact, it has been shown that hyaluronan synthase is active and important for extracellular replication of M. tb (Hirayama et al, 2009). As hyaluronan synthase is not critical for macrophage survival, inhibiting hyaluronan synthase (has123) could be a potential method for stopping activation of M. tb from a latent to active pulmonary state.
Second, we saw activation of vitamin D and folate metabolism in the active infectious states (HPM-P and HPM-M). Vitamin D injections were once used as a pre-antibiotic era treatment for tuberculosis (Martineau et al, 2007). It is proposed that vitamin D is crucial for increasing nitric oxide production in the macrophage. In the active infectious states, the macrophage is readily fighting the infection and hence has active vitamin D metabolism. Folate is important as an enzyme cofactor for DNA synthesis and repair. It has been shown to be up-regulated during activation of macrophages for arthrosclerosis (Antohe et al, 2005). The HPM-P and HPM-M predict that this also occurs for active M. tb infection.
Finally, we saw fewer but interesting changes in reaction activity of the M. tb portion of the three context-specific HPMs (Figure 6B and C). Polyprenyl metabolism was only active in the HPM-L and de novo synthesis of nicotinamide cofactors was active in latent and meningeal M. tb infections. Polyprenyl metabolism is important for the cell wall and it makes sense that it is active in the latent state when M. tb builds up its cell wall. Both of these pathways have been mentioned as potential drug targets for tuberculosis (Eoh et al, 2007; Boshoff et al, 2008). The lack of activity of the polyprenyl and nicotinamide pathways in the HPM-P and the polyprenyl pathway in the HPM-M suggests that such drug targets would not be as effective in eradicating the pathogen in a pulmonary or meningeal infection. However, the activity of these two pathways in the HPM-L suggests that such drug targets could be potentially viable for latent infections. Using high-throughput data from only one organism in the host–pathogen network, we were able to infer resulting changes in the other organism through simulations. This is critical for host–pathogen interactions in which high-throughput data cannot be properly attained for one of the organisms. A listing of all the reactions in each of the three infection-specific models is provided in the Supplementary information.
Discussion
There has been growing interest in genome-scale metabolic reconstructions and constraint-based analysis over the past 10 years. Development of a global human metabolic reconstruction, Recon 1, as well as reconstructions of multiple human pathogens enabled us to simulate how metabolism in the host and pathogen changes as a result of infection.
In order to carry out this study, a manually curated human alveolar macrophage model of cellular metabolism, iAB-AMØ-1410, was created using Recon 1. Purely algorithmic approaches were inadequate to achieve a physiologically relevant model, hence extensive manual curation was used. Flux predictions for ATP and NO production for the macrophage were within 5–10% of experimental measurements. In addition, the in silico model exhibited high glucose oxidation and lactate production, also seen experimentally.
The HM was then integrated with an M. tb reconstruction, resulting in an HPM. We compared the two reconstructions to different experimental data sets for macrophages and M. tb to validate our models. Interestingly, integration of the pathogen with the host immediately shrunk the solution space without the imposition of additional internal constraints. As the objective function of M. tb in the infectious state is necessarily different than the biomass growth function, gene expression data was used to help define the metabolic objectives in the infectious state. These predictions were validated through comparison with in vivo gene essentiality studies (TraSH).
Among the observations of the HPM, it was noted that there was a higher reliance on glycerol and fatty acids in a hypoxic environment that relied on gluconeogenesis to produce sugars. The integrated model was reliant on the glyoxylate shunt. In addition, nucleotide synthesis was suppressed with increased mycolic acid synthesis. As with in vitro simulations, blocking nitrogen and sulfur reduction pathways were shown to significantly affect survival rates of the pathogen. Analysis of the HPM model also showed improved gene essentiality predictions compared with the PM alone.
We used gene expression data to specify the context for analysis of three different types of M. tb infection: latent, pulmonary, and meningeal. There were key differences in both the metabolism of the macrophage and M. tb in the different infection types. iAB-AMØ-1410-Mt-661 predicted hyaluronan synthase in the macrophage to be a potential drug target for inhibiting pulmonary M. tb infection. In addition, we showed that mapping high-throughput data on one reconstruction of a host–pathogen network can elucidate physiologically relevant differences on the other reconstruction in the network. Polyprenyl metabolism and certain nicotinamide pathways were shown to be only active in latent and meningeal infections. Drug targets for these pathways have been discussed previously and should be only looked into for latent M. tb infections. A recent growing amount of evidence has shown M. tb to actively metabolize cholesterol (Brzostek et al, 2009; Hu et al, 2010). Interestingly, some reactions involved in cholesterol metabolism were highlighted by the model. As these pathways have not yet been fully characterized and were not in the current PM, the significance and interpretation of these findings were not clear at this point, but point to an area worth expanding the scope of the model and directing further future investigation.
Metabolic network reconstructions have many different uses and can be viewed as platforms for data interpretation, analysis, and prediction. Metabolism is being increasingly recognized as important in the role of pathogenicity (Kafsack and Llinas, 2010). Thus, metabolic HPMs are essential for detailing the molecular interaction between human cells and pathogens because of the importance of metabolic changes in both the human host cell and the pathogen. Host–pathogen reconstructions have several applications including providing a context for content analysis, biological discovery, and predictive power. Such reconstructions can serve as scaffolds for mapping high-throughput data onto the host or pathogen and then determining the changes in the other organism. In addition, discrepancies in experimental data and in silico predictions can help elucidate unknown interfacial interactions between the host and pathogen. For example, we showed that some oxygen uptake was necessary for M. tb infection, consistent with functional hypoxia, as opposed to strictly anaerobic versus aerobic conditional dependence. Finally, host–pathogen reconstructions take a step toward being a more biologically faithful platform for predicting potential drug targets as the network better represents in vivo conditions. For example, the models can be used to serve as platforms for understanding the host–pathogen interactions through dual perturbation experiments in silico (Jamshidi and Palsson, 2009) for screening responses to different drugs simultaneously with different growth conditions, which could then be complemented with in vitro or even ex vivo experiments.
There are numerous opportunities for improvement and discovery in HPMs. The host and pathogen integration was performed in a modularized manner, thus allowing for replacement of the M. tb component with other bacterial pathogens that infect macrophages such as Salmonella typhimurium (AbuOun et al, 2009) or viral pathogens such as the human immunodeficiency virus. In addition, future revisions of the M. tb reconstruction that further expand the scope of the metabolic processes included in the current model, transcription/translation machinery, and/or Toll-like receptors (Li et al, 2009) can be fitted within this framework. Another interesting application of the integration framework involves building bacterial community networks that show the interaction between more than two organisms in different environments, such as the gut. We hope that this successful demonstration of the integration of two genome-scale models will spur future computational explorations into multi-organism models to complement experiments and drive forward mechanistic understanding as well as generate new hypotheses.
Materials and methods
Construction of iAB-AMØ-1410
The reconstruction is derived from the global human metabolic network, Recon 1. Recon 1 consists of 1496 ORFs accounting for 3012 intracellular reactions and 2583 metabolites (Figure 2A). Recon 1 was used as described in Duarte et al (2007), with a few revisions. The originally described Complex IV reaction was replaced with three reactions. This was performed to ensure that the reaction was charge balanced, at the cost of decoupling superoxide production from the cytochrome c oxidase reaction (i.e. any coupling would have to be fixed by the modeler adjusting the relative constraints on the equations). In addition, the trans-mitochondrial phosphate transporter was re-written in the electroneutral form. The reaction formulas are explicitly shown in the Supplementary information.
An overview of the model building process is shown in Figure 1. Cell-specific gene expression data for healthy, inactivated alveolar macrophage was obtained from Gene Expression Omnibus. The specific gene expression study (Kazeros et al, 2008) had a healthy patient sample size of n = 11. Presence/absence calls were made for the gene expression data using the PANP software package in the R computing platform. The PANP algorithm used signal intensities to determine the presence of transcripts. Exchange constraints as well as upper bounds for fluxes of major pathways of central metabolism were set from literature (Newsholme et al, 1986, 1999; Sato et al, 1987; Curi et al, 1988). The expression data was then mapped to the reactions and using two separate algorithms, GIMME (Becker and Palsson, 2008) and Shlomi-NBT-08 (Shlomi et al, 2008), we built two preliminary cell-specific models. The two preliminary models were reconciled with primary literature databases (BRENDA (Chang et al, 2009) and HPRD (Keshava Prasad et al, 2009)), immunohistological staining data (Human Protein Atlas (Berglund et al, 2008)), transporter databases (HMTD (Yan and Sadee, 2000)), primary literature (see Supplementary information), and network stoichiometry to build a final, fully curated reconstruction.
Biomass composition
The biomass was formulated similar to the methods described in previous eukaryotic reconstructions of Saccharomyces cerevisiae and Mus musculus (Famili et al, 2003; Sheikh et al, 2005). The biomass component percentages were determined from literature (protein/sugar (Iyengar and Vakil, 1985), lipid (Schmien et al, 1974), and DNA (Grutman and Orgel, 1970)) and are presented in the Supplementary information. The total composition of each biomass element with respect to the whole cell, except for RNA, was found in literature for macrophages. The total RNA content was adapted from the yeast and mouse reconstructions. All components were found in macrophages, but the RNA amount was adapted from the yeast and mouse reconstructions. DNA composition was set to 41% GC content. RNA and protein composition was determined by averaging the sequence composition of expressed transcripts from the gene expression data used to build the HM. Sugar was assumed to be stored solely as glycogen. Lipid components were adapted from studies on human alveolar macrophages (Sahu and Lynn, 1977). ATP maintenance requirements were calculated similar to the method for the mouse reconstruction. All calculations for biomass formulation are provided in the Supplementary information. The biomass reaction was not used as the objective function. Instead, a lower bound was set as a maintenance requirement for the HM at physiologically relevant levels (Mbawuike and Herscowitz, 1989) for all computational tests. Objective functions used for the HM include ATP and nitric oxide production.
Integration of iAB-AMØ-1410 and iNJ661
The integration workflow is shown in Figure 3. Before integrating iAB-AMØ-1410 and iNJ661, the reactions and metabolites were renamed to delineate between organisms and compartments. Once the reactions and metabolites were recompartmentalized, the stoichiometric matrix of the PM was added to the right-hand side of the HM. The external environment of the PM was renamed as the phagosome environment. Transporter reactions were added that connected the cytoplasm of the HM with the phagosome environment for the exchange metabolites. The PM's exchange reactions were set to zero, except for ferric ion, copper ion, and hydrogen. These metabolites are not present in the HM and the exchanges were used as sinks because of the PM's need. The transporter reactions provided metabolites known to be in the phagosome to the PM, including ions (Wagner et al, 2005), nitric oxide, fatty acids, traces of glycerol, and oxygen (10% of iNJ661). A full list of metabolites available in the phagosome is provided in the Supplementary information.
Flux-balance analysis
The reconstructions were represented mathematically using the stoichiometric matrix (S). The matrix is m by n, containing m metabolites and n reactions. The relationship of reactions and the concentration time derivatives is as shown:
 |
where x and v denote the concentrations of metabolites and fluxes of reactions, respectively. Steady-state flux-balance analysis is accomplished using the following linear optimization problem:
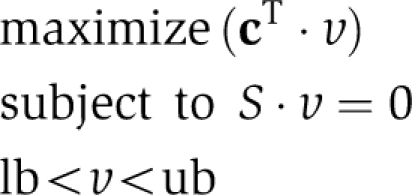 |
The optimization problem is constrained by thermodynamic and enzyme kinetics using upper and lower bounds (ub, lb) on the fluxes of reactions. The optimization vector (c) is a zero-vector except for a one assigned to the reaction or function to be optimized for. A full description of flux-balance analysis and its biological uses can be found in earlier publications (Varma and Palsson, 1994).
The flux span is calculated by the difference of the maximization and minimization of the linear optimization problem above for all reactions in the models. Reactions that carried no flux and were perceived to be involved in thermodynamically infeasible loops were not considered when calculating the flux span.
Characterizing the macrophage's metabolic functions
The global human metabolic network contained 288 metabolic functions. Sink reactions were added for the metabolite being produced in each metabolic function. Flux-balance analysis was completed using the SimPheny software platform and the pathways were detected by manual inspection of flux maps. The original exchange constraints for iAB-AMØ-1410 were used for all simulations. A listing of all the simulations and results are provided in the Supplementary information.
Reaction activity tests
iAB-AMØ-1410, iNJ661, and iAB-AMØ-1410-Mt-661 were randomly sampled using a Monte Carlo method detailed below. The macrophage objective functions were maintained at the aforementioned physiologically relevant levels. The tuberculosis objectives were maintained at 75% of the maximum values.
As substrate uptake rates for in vitro versus in vivo M. tb are significantly different, the sampling results required normalization to properly predict differential expression of metabolic pathways. We assumed that the cells will use a slightly different set of reactions for the two growth conditions. In addition, the total flux through all pathways will be constrained by the amount of enzyme, assuming there is adequate substrate. To represent this, we normalized the sample points to have the same median total network flux level by summing the absolute flux through all tuberculosis reactions for each sample point. All points are scaled by the median network flux.
Differential reaction activity was determined under the assumption that if the distributions of candidate flux states, from sampling, for the same reaction under two different conditions do not significantly overlap, then the cell will have to adjust the gene expression to compensate for the complete shift in the solution space. For each tuberculosis reaction, a P-value was computed, comparing the distributions of normalized sample points of the two models. Significance of change was determined at a false discovery rate of 0.05 (Storey and Tibshirani, 2003). The genes of the significantly changed reactions were determined from the gene–protein reaction association data and compared with published gene expression data.
Monte Carlo sampling
Monte Carlo sampling was used to generate a set of uniform, feasible flux distributions (points). The method is a modified version of the artificially centered hit and run (ACHR) algorithm (Kaufman and Smith, 1998). Initially, a set of non-uniform pseudo-random points, called warmup points, is generated. In a series of iterations, each point is moved in a random manner to a new point, always remaining within the solution space. This is performed by (1) choosing a random direction, (2) computing the limits of how far one can travel in that direction and (3) choosing a new point randomly along this line. After many iterations, the set of points will be mixed and approach a uniform random sample of the solution space.
Warmup points are generated by linear programming. For each point, the objective coefficients are set to a random vector with values in [−1,1]. This generates a point at random corners in the solution space. The direction of movement is chosen as described in Kaufman and Smith (1998). The center point of all points is computed and the direction is the difference of a randomly selected point and the center point. This has the effect of biasing the directions in the longer directions of the solution space and speeds up the rate of mixing while maintaining sample uniformity.
One of the problems with the ACHR is that the termination condition is not clearly defined. Here, we introduce the concept of the mixed fraction as a measure of how many iterations are required until proper mixing. A partition is created over the set of points by drawing a line at the median value with half the points on either side of the line. The mixed fraction is a count of how many points cross this line between the beginning of sampling and the end as a fraction of the total number of points. Initially, the mixed fraction is 1 as all points are on the same side of the partition. When perfect mixing is achieved, each point has a 50% chance of crossing the partition line so the mixed fraction will be close to 0.5. This value is approached asymptotically and a threshold of 0.53 was used for sampling.
Infectious state M. tb objective function formulation
The initial build of iAB-AMØ-1410-Mt-661 used the original tuberculosis biomass objective function of iNJ661. To build an objective function more specific to in vivo conditions of M. tb, the PM objective function was modified according to gene expression data. The original biomass was split into major metabolite components (Table I). Each component was randomly sampled to determine averages of reaction fluxes. In an iterative manner using linear regression, the components were either removed or weighted and sampling was redone. This process was continued till the sampling results from the specific objective function best fit the gene expression data.
Gene essentiality tests
Gene essentiality tests were completed by systematically setting all reaction fluxes associated with a gene to an upper and lower bound of zero. Flux-balance analysis was then computed to determine the change, if any, of phenotypic state. Only tuberculosis genes were tested in the PM and the HPM. We set 0.2 of the maximal biomass as the threshold for essentiality.
Building M. tb infection specific models
We used gene expression profiling data from ex vivo macrophages infected with M. tb (Thuong et al, 2008). The study had three types of macrophages: derived from nurses with latent tuberculosis and treated patients of pulmonary and meningeal tuberculosis. The expression data was used to build three context-specific models using the PANP software package and GIMME algorithm. All reactions were deemed active in the models that were able to carry a non-zero steady-state flux. This was performed using flux variability analysis, in which the minimum and maximum fluxes are independently calculated for each reaction in an iterative manner (Reed and Palsson, 2004).
Supplementary Material
iAB-AMØ-1410 SBML provided in SBML format
iAB-AMØ-1410-Mt-661 SBML
Spreadsheet detailing all 288 metabolic functions and which are functional in the macrophage.
Spreadsheet detailing the up- and down-regulated reactions after integration.
Gene Essentiality tests for the M. tb portion of the networks.
Listing of the active and inactive reactions in the three infectious states of M. tb studied.
Spreadsheet containing reactions and metabolites of the macrophage model. Literature sources for manual curation and confidence levels of reactions are also provided.
Spreadsheet with listing of reactions and metabolites in the final integrated model.
Calculations for building biomass maintenance function for macrophage.
Table containing exchange metabolites of the macrophage model.
Table containing exchange metabolites of the M. tb and integrated host-pathogen models.
Listing of all additional and updated reactions in Recon 1 as discussed in the methods section.
M. tb growth during infection in silico is dependent on oxygen uptake. There is a linear dependence on oxygen until about 13% of the measured in vitro oxygen uptake is reached. Any additional oxygen does not increase the in silico growth rate.
Acknowledgments
We thank Richard Que for helping in putting together the Supplementary information. This work was supported in part by National Institutes of Health Grants GM068837 and Y1-AI-8401-01, and the National Science Foundation IGERT Plant Training Grant DGE-0504645.
Footnotes
The authors declare that they have no conflict of interest.
References
- AbuOun M, Suthers PF, Jones GI, Carter BR, Saunders MP, Maranas CD, Woodward MJ, Anjum MF (2009) Genome scale reconstruction of a Salmonella metabolic model. J Biol Chem 284: 29480–29488 [DOI] [PMC free article] [PubMed] [Google Scholar]
- Antohe F, Radulescu L, Puchianu E, Kennedy MD, Low PS, Simionescu M (2005) Increased uptake of folate conjugates by activated macrophages in experimental hyperlipemia. Cell Tissue Res 320: 277–285 [DOI] [PubMed] [Google Scholar]
- Bacon J, James BW, Wernisch L, Williams A, Morley KA, Hatch GJ, Mangan JA, Hinds J, Stoker NG, Butcher PD, Marsh PD (2004) The influence of reduced oxygen availability on pathogenicity and gene expression in Mycobacterium tuberculosis. Tuberculosis (Edinb) 84: 205–217 [DOI] [PubMed] [Google Scholar]
- Barkan D, Liu Z, Sacchettini JC, Glickman MS (2009) Mycolic acid cyclopropanation is essential for viability, drug resistance, and cell wall integrity of Mycobacterium tuberculosis. Chem Biol 16: 499–509 [DOI] [PMC free article] [PubMed] [Google Scholar]
- Becker SA, Feist AM, Mo ML, Hannum G, Palsson BO, Herrgard MJ (2007) Quantitative prediction of cellular metabolism with constraint-based models: the COBRA Toolbox. Nat Protocols 2: 727–738 [DOI] [PubMed] [Google Scholar]
- Becker SA, Palsson BO (2008) Context-specific metabolic networks are consistent with experiments. PLoS Comput Biol 4: e1000082. [DOI] [PMC free article] [PubMed] [Google Scholar]
- Berglund L, Bjorling E, Oksvold P, Fagerberg L, Asplund A, Szigyarto CA, Persson A, Ottosson J, Wernerus H, Nilsson P, Lundberg E, Sivertsson A, Navani S, Wester K, Kampf C, Hober S, Pontén F, Uhlén M (2008) A genecentric human protein atlas for expression profiles based on antibodies. Mol Cell Proteomics 7: 2019–2027 [DOI] [PubMed] [Google Scholar]
- Beste DJ, Hooper T, Stewart G, Bonde B, Avignone-Rossa C, Bushell ME, Wheeler P, Klamt S, Kierzek AM, McFadden J (2007) GSMN-TB: a web-based genome-scale network model of Mycobacterium tuberculosis metabolism. Genome Biol 8: R89. [DOI] [PMC free article] [PubMed] [Google Scholar]
- Boshoff HI, Barry CE III (2005) Tuberculosis—metabolism and respiration in the absence of growth. Nat Rev Microbiol 3: 70–80 [DOI] [PubMed] [Google Scholar]
- Boshoff HI, Xu X, Tahlan K, Dowd CS, Pethe K, Camacho LR, Park TH, Yun CS, Schnappinger D, Ehrt S, Williams KJ, Barry CE III (2008) Biosynthesis and recycling of nicotinamide cofactors in mycobacterium tuberculosis. An essential role for NAD in nonreplicating bacilli. J Biol Chem 283: 19329–19341 [DOI] [PMC free article] [PubMed] [Google Scholar]
- Brzostek A, Pawelczyk J, Rumijowska-Galewicz A, Dziadek B, Dziadek J (2009) Mycobacterium tuberculosis is able to accumulate and utilize cholesterol. J Bacteriol 191: 6584–6591 [DOI] [PMC free article] [PubMed] [Google Scholar]
- Burke B, Lewis CE (2002) The macrophage, 2nd edn. Oxford, New York: Oxford University Press [Google Scholar]
- Chang A, Scheer M, Grote A, Schomburg I, Schomburg D (2009) BRENDA, AMENDA and FRENDA the enzyme information system: new content and tools in 2009. Nucleic Acids Res 37: D588–D592 [DOI] [PMC free article] [PubMed] [Google Scholar]
- Constant P, Perez E, Malaga W, Laneelle MA, Saurel O, Daffe M, Guilhot C (2002) Role of the pks15/1 gene in the biosynthesis of phenolglycolipids in the Mycobacterium tuberculosis complex. J Biol Chem 277: 38148–38158 [DOI] [PubMed] [Google Scholar]
- Curi R, Newsholme P, Newsholme EA (1988) Metabolism of pyruvate by isolated rat mesenteric lymphocytes, lymphocyte mitochondria and isolated mouse macrophages. Biochem J 250: 383–388 [DOI] [PMC free article] [PubMed] [Google Scholar]
- Duarte NC, Becker SA, Jamshidi N, Thiele I, Mo ML, Vo TD, Srivas R, Palsson BO (2007) Global reconstruction of the human metabolic network based on genomic and bibliomic data. Proc Natl Acad Sci USA 104: 1777–1782 [DOI] [PMC free article] [PubMed] [Google Scholar]
- Duarte NC, Herrgard MJ, Palsson B (2004) Reconstruction and validation of Saccharomyces cerevisiae iND750, a fully compartmentalized genome-scale metabolic model. Genome Res 14: 1298–1309 [DOI] [PMC free article] [PubMed] [Google Scholar]
- Eoh H, Brown AC, Buetow L, Hunter WN, Parish T, Kaur D, Brennan PJ, Crick DC (2007) Characterization of the Mycobacterium tuberculosis 4-diphosphocytidyl-2-C-methyl-D-erythritol synthase: potential for drug development. J Bacteriol 189: 8922–8927 [DOI] [PMC free article] [PubMed] [Google Scholar]
- Famili I, Forster J, Nielsen J, Palsson BO (2003) Saccharomyces cerevisiae phenotypes can be predicted by using constraint-based analysis of a genome-scale reconstructed metabolic network. Proc Natl Acad Sci USA 100: 13134–13139 [DOI] [PMC free article] [PubMed] [Google Scholar]
- Feist AM, Henry CS, Reed JL, Krummenacker M, Joyce AR, Karp PD, Broadbelt LJ, Hatzimanikatis V, Palsson BO (2007) A genome-scale metabolic reconstruction for Escherichia coli K-12 MG1655 that accounts for 1260 ORFs and thermodynamic information. Mol Syst Biol 3: 121. [DOI] [PMC free article] [PubMed] [Google Scholar]
- Gordon S (2007) The macrophage: past, present and future. Eur J Immunol 37(Suppl 1): S9–17 [DOI] [PubMed] [Google Scholar]
- Griscavage JM, Rogers NE, Sherman MP, Ignarro LJ (1993) Inducible nitric oxide synthase from a rat alveolar macrophage cell line is inhibited by nitric oxide. J Immunol 151: 6329–6337 [PubMed] [Google Scholar]
- Grutman MI, Orgel M (1970) Nucleic acid content in cultures of macrophages with antigen. Biull Eksp Biol Med 70: 70–71 [PubMed] [Google Scholar]
- Hampshire T, Soneji S, Bacon J, James BW, Hinds J, Laing K, Stabler RA, Marsh PD, Butcher PD (2004) Stationary phase gene expression of Mycobacterium tuberculosis following a progressive nutrient depletion: a model for persistent organisms? Tuberculosis (Edinb) 84: 228–238 [DOI] [PMC free article] [PubMed] [Google Scholar]
- Hirayama Y, Yoshimura M, Ozeki Y, Sugawara I, Udagawa T, Mizuno S, Itano N, Kimata K, Tamaru A, Ogura H, Kobayashi K, Matsumoto S (2009) Mycobacteria exploit host hyaluronan for efficient extracellular replication. PLoS Pathog 5: e1000643. [DOI] [PMC free article] [PubMed] [Google Scholar]
- Honer zu Bentrup K, Russell DG (2001) Mycobacterial persistence: adaptation to a changing environment. Trends Microbiol 9: 597–605 [DOI] [PubMed] [Google Scholar]
- Hu Y, van der Geize R, Besra GS, Gurcha SS, Liu A, Rohde M, Singh M, Coates A (2010) 3-Ketosteroid 9alpha-hydroxylase is an essential factor in the pathogenesis of Mycobacterium tuberculosis. Mol Microbiol 75: 107–121 [DOI] [PubMed] [Google Scholar]
- Itano N, Zhuo L, Kimata K (2008) Impact of the hyaluronan-rich tumor microenvironment on cancer initiation and progression. Cancer Sci 99: 1720–1725 [DOI] [PMC free article] [PubMed] [Google Scholar]
- Iyengar UR, Vakil UK (1985) Enumeration and structural assessment of peritoneal macrophages during progressive protein deficiency in rats. J Biosci 7: 15–26 [Google Scholar]
- Jamshidi N, Palsson BO (2007) Investigating the metabolic capabilities of Mycobacterium tuberculosis H37Rv using the in silico strain iNJ661 and proposing alternative drug targets. BMC Syst Biol 1: 26. [DOI] [PMC free article] [PubMed] [Google Scholar]
- Jamshidi N, Palsson BO (2009) Using in silico models to simulate dual perturbation experiments: procedure development and interpretation of outcomes. BMC Syst Biol 3: 44. [DOI] [PMC free article] [PubMed] [Google Scholar]
- Kafsack BF, Llinas M (2010) Eating at the table of another: metabolomics of host-parasite interactions. Cell Host Microbe 7: 90–99 [DOI] [PMC free article] [PubMed] [Google Scholar]
- Kaufman DE, Smith RL (1998) Direction choice for accelerated convergence in hit-and-run sampling. Oper Res 46: 84–96 [Google Scholar]
- Kazeros A, Harvey BG, Carolan BJ, Vanni H, Krause A, Crystal RG (2008) Overexpression of apoptotic cell removal receptor MERTK in alveolar macrophages of cigarette smokers. Am J Respir Cell Mol Biol 39: 747–757 [DOI] [PMC free article] [PubMed] [Google Scholar]
- Keshava Prasad TS, Goel R, Kandasamy K, Keerthikumar S, Kumar S, Mathivanan S, Telikicherla D, Raju R, Shafreen B, Venugopal A, Balakrishnan L, Marimuthu A, Banerjee S, Somanathan DS, Sebastian A, Rani S, Ray S, Harrys Kishore CJ, Kanth S, Ahmed M et al. (2009) Human protein reference database—2009 update. Nucleic Acids Res 37: D767–D772 [DOI] [PMC free article] [PubMed] [Google Scholar]
- Li F, Thiele I, Jamshidi N, Palsson BO (2009) Identification of potential pathway mediation targets in Toll-like receptor signaling. PLoS Comput Biol 5: e1000292. [DOI] [PMC free article] [PubMed] [Google Scholar]
- Martineau AR, Wilkinson RJ, Wilkinson KA, Newton SM, Kampmann B, Hall BM, Packe GE, Davidson RN, Eldridge SM, Maunsell ZJ, Rainbow SJ, Berry JL, Griffiths CJ (2007) A single dose of vitamin D enhances immunity to mycobacteria. Am J Respir Crit Care Med 176: 208–213 [DOI] [PubMed] [Google Scholar]
- Mbawuike IN, Herscowitz HB (1989) MH-S, a murine alveolar macrophage cell line: morphological, cytochemical, and functional characteristics. J Leukoc Biol 46: 119–127 [DOI] [PubMed] [Google Scholar]
- McKinney JD, Honer zu Bentrup K, Munoz-Elias EJ, Miczak A, Chen B, Chan WT, Swenson D, Sacchettini JC, Jacobs WR Jr, Russell DG (2000) Persistence of Mycobacterium tuberculosis in macrophages and mice requires the glyoxylate shunt enzyme isocitrate lyase. Nature 406: 735–738 [DOI] [PubMed] [Google Scholar]
- Newsholme P, Curi R, Gordon S, Newsholme EA (1986) Metabolism of glucose, glutamine, long-chain fatty acids and ketone bodies by murine macrophages. Biochem J 239: 121–125 [DOI] [PMC free article] [PubMed] [Google Scholar]
- Newsholme P, Curi R, Pithon Curi TC, Murphy CJ, Garcia C, Pires de Melo M (1999) Glutamine metabolism by lymphocytes, macrophages, and neutrophils: its importance in health and disease. J Nutr Biochem 10: 316–324 [DOI] [PubMed] [Google Scholar]
- Oberhardt MA, Palsson BO, Papin JA (2009) Applications of genome-scale metabolic reconstructions. Mol Syst Biol 5: 320. [DOI] [PMC free article] [PubMed] [Google Scholar]
- Palsson BO (2004) Two-dimensional annotation of genomes. Nat Biotechnol 22: 1218–1219 [DOI] [PubMed] [Google Scholar]
- Pieters J (2008) Mycobacterium tuberculosis and the macrophage: maintaining a balance. Cell Host Microbe 3: 399–407 [DOI] [PubMed] [Google Scholar]
- Pinto R, Harrison JS, Hsu T, Jacobs WR Jr, Leyh TS (2007) Sulfite reduction in mycobacteria. J Bacteriol 189: 6714–6722 [DOI] [PMC free article] [PubMed] [Google Scholar]
- Reed JL, Palsson BO (2004) Genome-scale in silico models of E. coli have multiple equivalent phenotypic states: assessment of correlated reaction subsets that comprise network states. Genome Res 14: 1797–1805 [DOI] [PMC free article] [PubMed] [Google Scholar]
- Reed JL, Famili I, Thiele I, Palsson BO (2006) Towards multidimensional genome annotation. Nat Rev Genet 7: 130–141 [DOI] [PubMed] [Google Scholar]
- Rich EA, Torres M, Sada E, Finegan CK, Hamilton BD, Toossi Z (1997) Mycobacterium tuberculosis (MTB)—stimulated production of nitric oxide by human alveolar macrophages and relationship of nitric oxide production to growth inhibition of MTB. Tuber Lung Dis 5–6: 247–255 [DOI] [PubMed] [Google Scholar]
- Rustad TR, Sherrid AM, Minch KJ, Sherman DR (2009) Hypoxia: a window into Mycobacterium tuberculosis latency. Cell Microbiol 11: 1151–1159 [DOI] [PubMed] [Google Scholar]
- Sahu S, Lynn WS (1977) Lipid composition of human alveolar macrophages. Inflammation 2: 83–91 [DOI] [PubMed] [Google Scholar]
- Sassetti CM, Rubin EJ (2003) Genetic requirements for mycobacterial survival during infection. Proc Natl Acad Sci USA 100: 12989–12994 [DOI] [PMC free article] [PubMed] [Google Scholar]
- Sato H, Watanabe H, Ishii T, Bannai S (1987) Neutral amino acid transport in mouse peritoneal macrophages. J Biol Chem 262: 13015–13019 [PubMed] [Google Scholar]
- Schmien R, Seiler KU, Wassermann O (1974) Drug-induced phospholipidosis. I. Lipid composition and chlorphentermine content of rat lung tissue and alveolar macrophages after chronic treatment. Naunyn Schmiedebergs Arch Pharmacol 283: 331–334 [DOI] [PubMed] [Google Scholar]
- Schneemann M, Schoeden G (2007) Macrophage biology and immunology: man is not a mouse. J Leukoc Biol 81: 579. [DOI] [PubMed] [Google Scholar]
- Schnappinger D, Ehrt S, Voskuil MI, Liu Y, Mangan JA, Monahan IM, Dolganov G, Efron B, Butcher PD, Nathan C, Schoolnik GK (2003) Transcriptional adaptation of Mycobacterium tuberculosis within macrophages: insights into the phagosomal environment. J Exp Med 198: 693–704 [DOI] [PMC free article] [PubMed] [Google Scholar]
- Sheikh K, Forster J, Nielsen LK (2005) Modeling hybridoma cell metabolism using a generic genome-scale metabolic model of Mus musculus. Biotechnol Prog 21: 112–121 [DOI] [PubMed] [Google Scholar]
- Shi L, Sohaskey CD, Kana BD, Dawes S, North RJ, Mizrahi V, Gennaro ML (2005) Changes in energy metabolism of Mycobacterium tuberculosis in mouse lung and under in vitro conditions affecting aerobic respiration. Proc Natl Acad Sci USA 102: 15629–15634 [DOI] [PMC free article] [PubMed] [Google Scholar]
- Shlomi T, Cabili MN, Herrgard MJ, Palsson BO, Ruppin E (2008) Network-based prediction of human tissue-specific metabolism. Nat Biotechnol 26: 1003–1010 [DOI] [PubMed] [Google Scholar]
- Sohaskey CD (2008) Nitrate enhances the survival of Mycobacterium tuberculosis during inhibition of respiration. J Bacteriol 190: 2981–2986 [DOI] [PMC free article] [PubMed] [Google Scholar]
- Storey JD, Tibshirani R (2003) Statistical methods for identifying differentially expressed genes in DNA microarrays. Methods Mol Biol 224: 149–157 [DOI] [PubMed] [Google Scholar]
- Talaat AM, Lyons R, Howard ST, Johnston SA (2004) The temporal expression profile of Mycobacterium tuberculosis infection in mice. Proc Natl Acad Sci USA 101: 4602–4607 [DOI] [PMC free article] [PubMed] [Google Scholar]
- Thiele I, Vo TD, Price ND, Palsson B (2005) An expanded metabolic reconstruction of Helicobacter pylori (iIT341 GSM/GPR): an in silico genome-scale characterization of single and double deletion mutants. J Bacteriol 187: 5818–5830 [DOI] [PMC free article] [PubMed] [Google Scholar]
- Thuong NT, Dunstan SJ, Chau TT, Thorsson V, Simmons CP, Quyen NT, Thwaites GE, Thi Ngoc Lan N, Hibberd M, Teo YY, Seielstad M, Aderem A, Farrar JJ, Hawn TR (2008) Identification of tuberculosis susceptibility genes with human macrophage gene expression profiles. PLoS Pathog 4: e1000229. [DOI] [PMC free article] [PubMed] [Google Scholar]
- Varma A, Palsson BO (1994) Metabolic flux balancing: basic concepts, scientific and practical use. Nat Biotechnol 12: 994–998 [Google Scholar]
- Voskuil MI, Visconti KC, Schoolnik GK (2004) Mycobacterium tuberculosis gene expression during adaptation to stationary phase and low-oxygen dormancy. Tuberculosis (Edinb) 84: 218–227 [DOI] [PubMed] [Google Scholar]
- Wagner D, Maser J, Lai B, Cai Z, Barry CE III, Honer Zu Bentrup K, Russell DG, Bermudez LE (2005) Elemental analysis of Mycobacterium avium-, Mycobacterium tuberculosis-, and Mycobacterium smegmatis-containing phagosomes indicates pathogen-induced microenvironments within the host cell′s endosomal system. J Immunol 174: 1491–1500 [DOI] [PubMed] [Google Scholar]
- Warburg O (1956) On the origin of cancer cells. Science 123: 309–314 [DOI] [PubMed] [Google Scholar]
- World Health Organization (2009) Global tuberculosis control: epidemiology, strategy, financing. pp 1–2
- Yan Q, Sadee W (2000) Human membrane transporter database: a web-accessible relational database for drug transport studies and pharmacogenomics. AAPS PharmSci 2: E20. [DOI] [PMC free article] [PubMed] [Google Scholar]
- Yuan Y, Crane DD, Simpson RM, Zhu Y, Hickey MJ, Sherman DR, Barry CE III (1998) The 16-kDa α-crystallin (Acr) protein of Mycobacterium tuberculosis is required for growth in macrophages. Proc Natl Acad Sci USA 95: 9578–9583 [DOI] [PMC free article] [PubMed] [Google Scholar]
Associated Data
This section collects any data citations, data availability statements, or supplementary materials included in this article.
Supplementary Materials
iAB-AMØ-1410 SBML provided in SBML format
iAB-AMØ-1410-Mt-661 SBML
Spreadsheet detailing all 288 metabolic functions and which are functional in the macrophage.
Spreadsheet detailing the up- and down-regulated reactions after integration.
Gene Essentiality tests for the M. tb portion of the networks.
Listing of the active and inactive reactions in the three infectious states of M. tb studied.
Spreadsheet containing reactions and metabolites of the macrophage model. Literature sources for manual curation and confidence levels of reactions are also provided.
Spreadsheet with listing of reactions and metabolites in the final integrated model.
Calculations for building biomass maintenance function for macrophage.
Table containing exchange metabolites of the macrophage model.
Table containing exchange metabolites of the M. tb and integrated host-pathogen models.
Listing of all additional and updated reactions in Recon 1 as discussed in the methods section.
M. tb growth during infection in silico is dependent on oxygen uptake. There is a linear dependence on oxygen until about 13% of the measured in vitro oxygen uptake is reached. Any additional oxygen does not increase the in silico growth rate.