

Abstract
The regulation of gene expression is, in large part, mediated by interplay between the general transcription factors (GTFs) that function to bring about the expression of many genes and site-specific DNA-binding transcription factors (STFs). Here, quantitative genetic profiling using the epistatic miniarray profile (E-MAP) approach allowed us to measure 48 391 pairwise genetic interactions, both negative (aggravating) and positive (alleviating), between and among genes encoding STFs and GTFs in Saccharomyces cerevisiae. This allowed us to both reconstruct regulatory models for specific subsets of transcription factors and identify global epistatic patterns. Overall, there was a much stronger preference for negative relative to positive genetic interactions among STFs than there was among GTFs. Negative genetic interactions, which often identify factors working in non-essential, redundant pathways, were also enriched for pairs of STFs that co-regulate similar sets of genes. Microarray analysis demonstrated that pairs of STFs that display negative genetic interactions regulate gene expression in an independent rather than coordinated manner. Collectively, these data suggest that parallel/compensating relationships between regulators, rather than linear pathways, often characterize transcriptional circuits.
Keywords: genetic interaction, regulatory network, transcription factor, transcription regulation
Introduction
Our current understanding of transcriptional regulation encompasses dozens of proteins cooperating to control gene expression (Komili and Silver, 2008). In eukaryotes, the interaction of the RNA polymerase II machinery with individual genes involves recognition of DNA elements by sequence-specific factors that, in turn, cooperate with the general transcriptional apparatus to facilitate expression of particular transcripts. Because of its importance for biology and disease, considerable effort has been made to characterize the patterns of gene expression in different cells and in different physiological conditions. Analyses of mRNA levels using hybridization to microarrays (DeRisi and Iyer, 1999) and the DNA sequences associated with sequence-specific transcription factors (STFs) using ChIP-chip (Lee et al, 2002; Bulyk, 2006) or ChIP-Seq technologies (Johnson et al, 2007; Robertson et al, 2007) have together provided great insight into gene regulation. Furthermore, there has been systematic effort to characterize transcription factor DNA-binding profiles in vitro (Badis et al, 2008, 2009; Berger and Bulyk, 2009). However, a complete description of how the transcription machinery engages with the genetic material to produce the appropriate repertoire of expressed mRNAs awaits improved knowledge of how individual components of the transcriptional machinery operate together.
In order to gain a better understanding of the functional relationships between components of the general transcriptional machinery and sequence-specific DNA-binding transcription factors, we used synthetic genetic array (SGA) technology (Tong et al, 2001) to generate an epistatic miniarray profile (E-MAP) (Schuldiner et al, 2005; Collins et al, 2007; Roguev et al, 2008; Fiedler et al, 2009) that contains the majority of predicted STFs and a representative collection of the general transcription factors (GTFs) in Saccharomyces cerevisiae. E-MAPs comprehensively describe the genetic interactions between pairs of mutations within a defined subset of genes in a quantitative manner. Our E-MAP approach allows for the identification of both negative (aggravating or synthetic sick/lethal) and positive (alleviating) interactions (Beltrao et al, 2010). Positive genetic interactions generally correspond to situations where the double mutant is healthier (suppression) or no sicker than the more defective single mutant. Previous work has demonstrated that the negative interactions often identify pairs of genes functioning in non-essential, redundant, or compensatory pathways (Guarente, 1993; Kelley and Ideker, 2005), whereas positive ones are enriched for factors that function in the same pathway and are often physically associated (Collins et al, 2007; Roguev et al, 2008; Aguilar et al, 2010). Here, we have used the E-MAP approach to genetically interrogate the set of STFs as well as a large set of GTFs in S. cerevisiae. Analyzing the genetic relationships between and among STFs and GTFs has shed insight on the global organization of the transcriptional machinery as well as provided detailed information on the functional relationships between individual factors.
Results
In this study, we have genetically targeted the STFs, a set of proteins that impinge on virtually all aspects of cellular physiology. By generating double mutants for 151 predicted STFs, as well as 172 components of the general transcriptional machinery (e.g. TFIIF, RNA polymerase II, Mediator) and various chromatin modifiers (e.g. COMPASS, Rpd3C(L), NuA4) and remodelers (e.g. RSC, SWI/SNF) (for a complete list of genes, see Supplementary Table 1), we collected genetic interaction data for 48 391 pairs of genes (Supplementary Dataset 1). Our experimental methodology and subsequent analyses were performed as previously described (Collins et al, 2006; Schuldiner et al, 2006), and all raw and processed data are available online (http://interactome-cmp.ucsf.edu).
Global epistatic relationships within the transcriptional apparatus
An E-MAP produces at least two types of observations. First, a quantitative measure of the strength of the interaction, negative or positive, for each individual pair of genes is obtained and, second, the pattern of these interactions for each of the genes serves as a high-resolution phenotype. We used hierarchical clustering to group genes with similar epistasis patterns, subject to the constraint that the STF and GTF genes were clustered separately (Figure 1A). In this way, global epistasis patterns within and between the STF and GTF could be studied.
Figure 1.

Site-specific and general transcription factors evoke distinct patterns of epistasis. (A) Genes were segregated into site-specific (STF) or general (GTF) transcription factor classes and clustered based on their quantitative epistatic interaction profiles. Quadrants I, II, and III represent the STF–STF, STF–GTF, and GTF–GTF classes, respectively. The intensity of yellow and blue indicates the strength of positive and negative interactions, respectively. Individual interactions between components of the INO80-C and RPD3-C-(L) chromatin remodeling complexes and selected STFs are shown (bottom left). (B) A density plot shows a preference for STFs to display significant genetic interactions with GTFs compared with other STFs. Each point on the plot represents a single STF or groups of STFs with identical interaction frequency. (C) The ratio of negative (S-score⩽−2.5) to positive interactions (S-score ⩾2.5) for the set of genes in quadrant I is significantly greater (P=0.0068) than that for quadrant II and even more significant when compared with the data from E-MAPs focusing on the early secretory pathway (ESP) (Schuldiner et al, 2005) (P<10−10), chromosome biology (Collins et al, 2007) (P<10−8), and signaling (Fiedler et al, 2009) (P<10−20).
Immediately noticeable is the relative lack of genetic interactions among the STFs (Figure 1A, quadrant I) compared with the more abundant interactions among the GTFs (quadrant III) and between STFs and GTFs (quadrant II). It appears that a given STF is more likely to interact genetically with a GTF than with another STF (Figure 1B), even after considering the fact that we included within the E-MAP approximately equal numbers of GTFs and STFs (Supplementary Table 1). Furthermore, the ratio of negative (S-score⩽−2.5) to positive (S-score⩾2.5) genetic interactions (Collins et al, 2006) observed within the set of STFs is significantly higher than that seen in the set containing STF–GTF pairs (Figure 1A and C; see Materials and methods for data processing). As negative genetic interactions can identify genes functioning in separate, parallel pathways and positive interactions often identify factors that function in the same linear pathway or as a complex (Tong et al, 2004; Schuldiner et al, 2005; Kelley and Ideker, 2005; Collins et al, 2007), the majority of STFs would appear to most often act in a redundant manner. In contrast, significantly more positive genetic interactions were observed among gtfΔstfΔ double mutants (Figure 1C), suggesting that STFs often work together with the general transcriptional apparatus. The ratio of positive to negative interactions among STF gene pairs is also significantly lower than observed for genes in previous E-MAPs (Schuldiner et al, 2005; Collins et al, 2007) (Figure 1C), suggesting that the genetic architecture we observe among STFs is unlike those in other biochemical processes. In fact, we have recently demonstrated that there is a significant enrichment of positive interactions within the signaling machinery (kinases and phosphatases (Fiedler et al, 2009)) (Figure 1C; Supplementary Table 2). This suggests that kinases and phosphatases, unlike STFs, often work in linear pathways or in a coordinated manner.
Inspection of quadrant III revealed that components of coherently acting complexes are clustered next to each other, suggesting that, in general, the data set is of high quality (Supplementary Figure 1). As a further assessment of the quality of the data, we used a recently described, independent methodology involving the measurement of relative growth rate using flow cytometry (Breslow et al, 2008) to confirm a subset of interactions derived using colony size as a phenotypic readout. We have randomly chosen a similar number of pairs from those with positive/negative/neutral genetic interactions; most of the genetic interactions that were chosen had not been reported before (see Materials and methods). We find that overall 54% (P-value=0.0007 with Fisher's exact test, 40%/43%/83% if considering only positive/negative/neutral interactions, respectively) of the genetic interactions we identified with the E-MAP approach are consistent with the genetic interaction calculated from the relative growth rates measured with flow cytometry (Supplementary Tables 3 and 4). We argue that many of the interactions that were not confirmed may be related to the growth differences of yeast on agar plates (E-MAP) compared with liquid environment (with flow cytometry). Figure 2 provides network views of the negative and positive genetic interactions among the STFs (A, B) and between STFs and the GTF protein complexes (C, D).
Figure 2.
Network representation of genetic interactions between and among STFs and GTFs. STFs linked to each other by negative (A) or positive (B) interactions, and to GTF complexes by negative (C) or positive (D) interactions are shown. Red, blue, and green shading indicate activating and repressing gene products, or GTF protein complexes, respectively. The sizes of the green nodes corresponding to the GTFs correlate with the number of components of the complex that were genetically analyzed. The thickness of the line corresponds to the strength of the interaction. See http://interactome-cmp.ucsf.edu for a list of all interactions. Source data is available for this figure at www.nature.com/msb.

Epistatic relationships reveal underlying regulatory architectures
In addition to providing an overview of the global relationships among TFs, the fine structure of the E-MAP can be used to address the nature of the regulatory architecture controlling individual genes. A variety of regulatory patterns have been described that serve the differing functional requirements of various biological processes (Istrail and Davidson, 2005). Frequently, one TF represses the function of another, which is normally involved in gene activation (Figure 3A-1). Alternatively, two different TFs may function together in a coordinated manner (Figure 3A-2) or act redundantly to regulate a set of genes (Figure 3A-3). Our E-MAP identified examples of each of these types of relationships.
Figure 3.

Epistatic patterns underlie local regulatory architectures. Three alternative regulatory modules involving a pair of gene products (X and Y) are shown in (A), where X represses the activator Y (1), X and Y cooperate to activate gene expression (2), and X and Y act in parallel/redundantly (3). In the simplified language of Boolean logic, these are indicated by ‘AND’ and ‘OR’ relationships. Examples of these behaviors involving regulation of nitrogen catabolism (B) and galactose metabolism (C) are shown. See text for a detailed interpretation of the individual interactions.
Under nitrogen-rich conditions, the GATA family transcriptional activators, Gln3 and Gat1, are known to form individual complexes with the repressor Ure2, localizing them to the cytoplasm and decreasing nitrogen catabolite repression (NCR)-sensitive gene expression (Cooper, 2002) (Figure 3B, upper panel). Deletion of URE2 allows Gln3 and Gat1 to be recruited to the nucleus, where they activate the NCR genes, an event that is detrimental to overall cell growth in rich media. Therefore, deletion of either Gln3 or Gat1 in a ure2Δ background could overcome the growth defect, resulting in a suppressive genetic relationship. Indeed, these are the exact patterns we observe in the E-MAP (Figure 3B, lower panel), as has been observed previously (Courchesne and Magasanik, 1988; Cunningham et al, 2000). Interestingly, gln3Δgat1Δ results in a significant negative genetic interaction (Soussi-Boudekou and Andre, 1999; Crespo et al, 2001; Schmelzle et al, 2004), even in nitrogen-rich conditions, potentially implying that trace amounts of these factors localize to and are functional in the nucleus. Regardless, this latter interaction represents an ‘independent activation’ relationship between two distinct STFs (Figure 3A-3).
One of the most studied yeast transcriptional regulatory systems involves the GAL genes required for growth when galactose is used as the carbon source (Traven et al, 2006). In the presence of a carbon source other than galactose, Gal80 is known to bind to and inactivate Gal4, an activator required for expression of the GAL genes involved in metabolizing galactose (an example of scenario (1), Figure 3A). It has been shown previously that deletion of GAL4 suppresses the slow-growth phenotype associated with gal80Δ (Ideker et al, 2001), probably by preventing unnecessary, wasteful activation of the galactose genes, and this is a relationship we successfully detected in our E-MAP (Figure 3C). Additional factors that inhibit the function of Gal4 in the presence of glucose could, in theory, display negative genetic interactions with Gal80. The Gal80-dependent repression of Gal4 also requires the histone methyltransferase Set2 (Landry et al, 2003), and we also found a significantly negative genetic interaction between GAL80 and SET2 (S-score=−3.8, see http://interactome-cmp.ucsf.edu). In addition, the histone H2A variant, Htz1, has been shown to be required for the efficient activation of the GAL genes (Adam et al, 2001). HTZ1, along with components of the SWR-C complex, which incorporates Htz1 into chromatin (Korber and Horz, 2004), also displayed positive genetic interactions with GAL80. Therefore, overcoming the deleterious effects of gal80Δ can be achieved by removing either Gal4 or factors required for it to function (i.e. Htz1 and SWR-C). This would represent a situation where Gal4 and SWR-C/Htz1 are acting in a coordinated manner (Figure 3A-2). We did not detect an interaction between GAL4 and HTZ1 (or SWR-C) in the medium we used lacking galactose as Gal4 is not functional in these circumstances, but one would predict that the double mutants would exhibit a positive genetic interaction in the presence of galactose. Similarly, in the presence of galactose, the positive genetic interaction between Gal4 and Gal80 should not be observed, as Gal80 is not functional. However, we did detect positive interactions between SWR-C and Htz1 in the absence of galactose (Figure 3C), arguing that these proteins function in a Gal4-independent manner, consistent with studies showing that Htz1 is recruited to the promoters of many genes (Raisner et al, 2005; Zhang et al, 2005).
Several cases where STFs and GTFs work in a coordinated manner (Figure 3A-2) have been described previously, and these connections often manifest themselves as positive genetic interactions in this E-MAP. For example, it was previously reported that the histone deacetylase (HDAC) Rpd3, and its physical partner Sin3, work together with the STF Hac1 to regulate expression of the early meiotic genes (Schroder et al, 2004). Rpd3 and Sin3 are, in fact, both components of two distinct complexes, large Rpd3C(L) and small Rpd3C(S) (Carrozza et al, 2005; Keogh et al, 2005), but the E-MAP only revealed positive genetic interactions between Hac1 and the larger Rpd3-containing complex, implying that this STF functions only with Rpd3C(L). Bas1 and Arg80, STFs responsible for the regulation of histidine (Pellman et al, 1990) and arginine biosynthesis (Messenguy, 1976), respectively, also shared positive genetic interactions with Rpd3C(L) (Figure 2D), suggesting that they also work together with this HDAC. Although we have emphasized the global epistatic trends within the transcriptional apparatus in this study, there remains a wealth of mechanistic insight that can be mined from the individual interactions for each gene. We have deposited the raw and processed data on a searchable and interactive website (http://interactome-cmp.ucsf.edu), which also allows the data from this study to be integrated and compared with other genetic and protein–protein interaction data sets.
STFs regulating similar sets of genes display negative genetic interactions
We also explored the general regulatory logic in yeast by combining our genetic interaction data with the information about the network connections between STFs and their targets. It has been observed that many promoters have binding sites for several different STFs, suggesting that multiple inputs converge at these promoters to control gene expression (Zhu and Zhang, 1999; Chin et al, 2005). It has also been argued that, based on simple biophysical models, essentially any complex regulatory logic can be achieved by appropriately adjusting the relative positioning and strength of the STF-binding sites (Buchler et al, 2003). Given the complex structures of promoters and the possible types of regulatory logic, what types of logic are used in nature? We examined this issue by focusing on pairs of STFs that share a set of targets (Figure 4A). These pairs were identified by using published genome-wide ChIP-chip data that physically link yeast transcription factors to their cognate genes (Harbison et al, 2004; MacIsaac et al, 2006). A total of 110 STF gene pairs were identified that have statistically significant target overlap with a P-value <0.005, whereas 49 pairs have significant overlap at a more stringent cutoff (P<10−7). Regardless of the cutoff, we found that STF pairs with overlapping targets are enriched for negative genetic interactions compared with random STF–STF gene pairs. Among the 49 STF pairs displaying the more significant overlap, 10 display strongly negative genetic interactions (with an enrichment P<1 × 10⁻⁵) in the one type of growth condition we have used (Figure 4B). None of these overlapping STFs displayed positive genetic interactions. These observations suggest that compensating/redundant regulation by STF pairs is a dominant mode of regulation. As these pairs of STFs directly regulate the same set of targets and are mostly activators, one interpretation is that they act in an independent activation mode (Figure 3A-3) compared with one that involves coordinated regulation (Figure 3A-2).
Figure 4.

STFs that regulate similar sets of genes display negative genetic interactions. The number of occurrences of such architectures (A) are tabulated (B), and specific examples indicated (C). (B) Using previously reported target predictions (MacIsaac et al, 2006) from ChIP-chip data (Harbison et al, 2004), three different P-value thresholds (0.005, 10−5, and 10−7) (based on significant target overlap) were applied for each pair of transcription factors. The number of significantly negative (⩽−2.5) and positive (⩾2.5) genetic interactions, as well as the statistical enrichment for negative interactions, is listed for each set. (C) The 15 pairs of STFs that shared a significant overlap of target genes (0.005) and displayed negative genetic interactions are tabulated.
Examination of various overlapping pairs having negative genetic interactions further supports the idea that they act in a redundant/compensating way. For example, Swi4 and Swi6, the two components of the SBF complex that cooperates with Mbp1 to activate transcription of G1-specific and DNA repair genes, are predicted to regulate 68 genes in common (Harbison et al, 2004; MacIsaac et al, 2006) (Figure 4C). Swi4, which is involved in the expression of 20/23 genes associated with Stb1 (Harbison et al, 2004; MacIsaac et al, 2006), also showed strong negative interactions with stb1Δ. Similarly, the related (46% amino-acid identity) MET31 and MET32 genes, which displayed a significantly negative genetic interaction (Figure 4C), interact individually with the Cbf1p–Met4p–Met28p complex to induce the expression of biosynthetic enzymes for sulfur-containing amino acids (Blaiseau et al, 1997). It is worth noting that the Met31/Met32 pair is the only example in the set of co-regulating STF pairs that result from a gene duplication event. The relative paucity of this type of interaction between STF pairs suggests that the redundancy in regulation is not a trivial consequence of gene duplication, but rather a regulatory organization selected by evolution.
To further test the model that STFs act more often to regulate their common targets in a redundant manner, we carried out gene expression profiling on four sets of double mutants (and corresponding single mutants; Supplementary Table 5), with negative interactions that were confirmed by measuring growth rates in liquid culture (Supplementary Tables 6 and 7). We found that the number of genes changed in double-mutant strains is much larger than the number of genes that changed in corresponding single mutants (Supplementary Figure 2), which is consistent with the fact that these double mutants have more severe growth phenotypes. Two of the four pairs (swi4–skn7 and gcr2–tye7) displayed a pattern of gene expression and growth phenotypes that are suggestive of a specific mode of regulation: one factor acts as a major regulator and the other acts as a minor regulator or serves as a backup. In each case, the growth rate of one of the single-deletion mutants is significantly reduced (i.e. ‘the major regulator’), whereas the growth rate of the other single-deletion mutant is similar to that of the wild type (i.e. ‘the minor regulator’). In the absence of the major regulator, the deletion of the minor regulator leads to a more severe growth defect, resulting in a negative genetic interaction (Figure 5A). Thus, the function of the minor regulator becomes more important in the absence of the major regulator. In accordance with the growth phenotypes, the global gene expression change observed in the double deletion is better correlated with that of the single deletion of the major regulator (Figure 5B). To examine the response of the common targets of the two factors, we used the genome-wide transcription factor occupancy data from Yeast TransfactomeDB (Foat et al, 2008) to define the potential target genes. In each case, we found that genes predicted to be directly regulated by both TFs are enriched in the set of genes that significantly change expression in the double mutant but not in either of the single mutants (Supplementary Table 8). No common targets were found in the set of genes that significantly change expression in all three mutants (Figure 5C). Thus, we found an enrichment of common target genes displaying ‘OR’ but not ‘AND’ behavior, in the simplified language of Boolean logic. Examination of the targets revealed that many of them are induced/repressed more by the double deletion than by each of the single deletions (Figure 5D). These results suggest that frequently TF pairs with negative interactions regulate the transcription of their common genes in a redundant manner. The other two TF pairs displayed weaker growth phenotypes and weaker genetic interactions, and the pattern of gene expression is not as clear. In these two cases, we have not observed enrichment of common targets in gene sets displaying either ‘OR’ or ‘AND’ behavior. This points to the complexity of genetic interaction and suggests that no single mechanism will be able to explain all the observed interactions.
Figure 5.

(A) Relative growth rate measured from liquid growth confirmed the negative interactions of swi4-skn7 and gcr2-tye7. (B) Gene expression of double-deletion strains show better correlations with the single-deletion strains with more severe growth defect (Log2 fold change values compared with wild-type were plotted). (C) The number of genes with expression level changed significantly in double mutants and corresponding single mutants. The numbers in the parenthesis indicated the number of common target genes within the corresponding set of genes. (D) Examples of genes regulated by two transcription factors with an ‘OR’ gate. The left panel shows the promoters with TF-binding sites indicated by the boxes. The right panel shows gene expression change in the single and double mutants. The numbers indicate expression level relative to the wild type. Length of the bar is proportion to the difference between the mutant and wild type. Green bars indicate that the expression levels of the corresponding genes are lower than the wild type, whereas red bars indicate higher gene expression levels.
The mechanism for generating genetic interactions between a pair of TFs can be quite complicated and TF specific, as a pair of TFs may each regulate a number of genes that themselves display strong interactions. To investigate the possibility that the interaction between a pair of TFs is caused indirectly by the interaction(s) between their downstream targets, we have analyzed the genetic interactions of the predicted targets for each pair of TFs using all our E-MAP data. We found that for almost all of the TF pairs with strong genetic interaction, there is no enrichment of genetic interactions between their targets (Supplementary Figure 3). For example, although 47.5% of the TF pairs displaying significant negative genetic interactions have at least one pair of targets that display a stronger negative interaction, this is actually lower than what is observed (58%) when the data are randomized (keeping the number of targets the same for each TF). Collectively, this argues that indirect effects of the downstream targets cannot be the main explanation for the large number of observed interactions between TFs.
Discussion
Previously, genomic approaches to transcriptional regulation have mainly focused on establishing connections between TFs and their targets, for example, by systematic ChIP-chip, TF deletion/overexpression profiling (Harbison et al, 2004; Chua et al, 2006; Hu et al, 2007), or by in vitro characterization of the DNA-binding profile of TFs (Badis et al, 2008, 2009; Berger and Bulyk, 2009). Quantitative genetic data provide complementary information as they describe functional relationships among TFs. A challenging task is to systematically reconstruct the regulatory circuits, inferring both connections and the input/output relationships. Given that the cellular regulatory networks could be quite complex due to possible regulatory cascades, the involvement of both activators and repressors, and the possibilities of various types of input/output relationships with multiple inputs, it is likely that more than one model will be consistent with the observed genetic interaction patterns. Thus, it is important to integrate other sources of information, such as the wiring diagrams and prior knowledge of the functions and regulation of the proteins involved, and to impose physical constraints on what can be implemented at the molecular level. We have demonstrated that this integrated approach enables us to explore the principles of global and local organization of the transcriptional apparatus in budding yeast. In particular, we have illustrated this approach by analyzing pairs of STFs that co-regulate the same sets of genes.
One intriguing observation from this study is that STF pairs sharing regulatory targets predominantly exhibit negative genetic interaction, and gene expression profiling of the TF mutants indicate that quite often such pairs regulate their target genes in a redundant manner. Could this be a general principle of regulatory design? Although we have grown yeast in only one set of conditions, there is no particular reason to believe that additional genetic interactions observed in different environmental conditions would alter the balance of the types of regulatory logic that are observed. Previous studies on the evolution of transcriptional circuits suggest that transition through an intermediate with redundant regulation may be a general mechanism to achieve large-scale rewiring without having to cross huge fitness barriers (Tanay et al, 2005; Tsong et al, 2006). Genome-wide analysis of the binding site patterns in yeast promoters also provides evidence that novel binding sites tend to appear in specific promoters that are already associated with multiple sites (Bilu and Barkai, 2005), consistent with the interpretation that redundant regulation through multiple sites makes the promoter more evolvable.
Although ChIP-chip analyses had been used to infer regulatory hierarchies for the STFs of S. cerevisiae (Lee et al, 2002; Harbison et al, 2004), such cascades appeared to have a relatively minor effect in cell growth under the condition we studied. We have systematically analyzed STF pairs with a regulator-target relationship (STF1 directly regulates STF2, derived from previously reported target predictions (MacIsaac et al, 2006) using ChIP-chip data (Harbison et al, 2004)) and found no enrichment of either positive or negative genetic interactions (see Supplementary Table 9; Supplementary Figure 4). Microarray analyses of gene expression in STF-deletion strains (Hu et al, 2007) also indicated that regulation through extended cascades involving STFs may be relatively rare.
Certain global network features of this transcription factor E-MAP, such as overall interaction density and the ratio of positive-to-negative interactions, are significantly different from those observed in previous E-MAPs (Schuldiner et al, 2005; Collins et al, 2007; Fiedler et al, 2009). For example, we have recently carried out a genetic study of the signaling apparatus (i.e. kinases/phosphatases) and observe the opposite trend we see with the STFs, that is an enrichment of positive over negative genetic interactions (Fiedler et al, 2009). Based on this, we argue that, unlike STFs, enzymes that regulate phosphorylation more often function in linear pathways or in a coordinated manner. Although negative genetic interactions are often observed with factors working in the same pathway when it is essential in nature (Wilmes et al, 2008), the majority of kinases, phosphatases, and TFs are non-essential, suggesting our interpretations are appropriate. It will be of great interest to determine whether the striking difference in the genetic architecture within the signaling apparatus and the transcriptional machinery is evolutionarily conserved and to fully characterize the genetic relationship between these two unique sets of genes. Comparison of different E-MAPs suggests that functionally distinct subnetworks are subject to alternative regulatory arrangements that best serve their purpose in the cell. For example, the cell cycle apparatus is largely responsible for ensuring that conditions are favorable for the cell to progress through successive steps of the cell division cycle. Thus, go/no-go decision points (checkpoints) largely define a linear sequence of events. Such an arrangement would be expected to result in increased occurrence of positive epistatic interactions, because these reflect shared linear pathways or protein complexes operating within the same pathway. Transcriptional responses, in contrast, are more likely to be modified by external environmental conditions, with different STFs driving gene expression in different directions that all contribute to the cell's fitness, a situation expected to result in increased numbers of negative epistatic interactions among STFs, just as we observed in this study.
These observations may be especially apparent among budding yeast STFs, because these organisms need to respond sensitively and rapidly to changing nutritional conditions (e.g. between oxidative and fermentative metabolism) (Johnston, 1999). The map of epistatic interactions we generated should not be static: within a single organism, the nature (magnitude and polarity) of the genetic interactions should be dependent on the particular environmental conditions. Furthermore, other organisms may show different patterns of epistatic interaction among their STFs, as transcription network rewiring is a quite general phenomenon (Tuch et al, 2008). Indeed, our preliminary comparative analysis between S. cerevisiae and an evolutionary distinct yeast species Schizosaccharomyces pombe (Roguev et al, 2008; Beltrao et al, 2009) indicates that GTF–GTF interactions are much more conserved than STF–STF interactions and, despite the changes, the general observation that STF pairs are more likely to interact negatively holds true for both species (unpublished data). Therefore, quantitative genetic profiling has considerable potential for the discovery of conserved/species-specific and environment-dependent interactions between genes and pathways. It will be very interesting and challenging to extend the E-MAP approach to metazoans, where sequence analyses indicate that functional enhancer elements often have clusters of binding sites of different TFs, which lead to the suggestion that cooperative binding of TFs are required for function. There, the pattern of genetic interaction may show a striking difference from what is observed in yeast.
Materials and methods
E-MAP analyses
The genetic interaction map was generated and analyzed as previously described, and an interaction score (S-score) is calculated for each pair of factors (Schuldiner et al, 2005, 2006; Collins et al, 2006, 2007). See Supplementary Table 1 and http://interactome-cmp.ucsf.edu for a complete list of genes analyzed and the raw and the processed data. To generate the network diagrams in Figure 2, we define a score between a STF and a GTF complex as Sc = ∑i = 1Nc Si/Nc, where Si is the S-score between the ith component of the complex and the STF, and Nc is the number of the components of the complex (for the components of different GTF complexes, see Supplementary Table 10).
To link a STF with a GTF complex in Figure 2C, the S-scores between the STF and all the components of the GTF are required to be <−4.0. For positive interaction links in Figure 2D, we require that Sc>2.0 and that at least 60% of the components of the complex have S-scores >1.5 with the STF.
The statistical significance of the enrichment of negative genetic interaction relative to positive interaction in Quadrant I (STF–STF) is calculated by contrasting to Quadrant II (STF–GTF) and previous E-MAP data for the early secretory pathway (Schuldiner et al, 2005), chromosome biology (Collins et al, 2007) and the signaling machinery (Fiedler et al, 2009) (Figure 1; Supplementary Table 2). P-values were computed using binomial distribution.
Identifying STFs with overlapping targets
To identify pairs of STFs with overlapping targets (and define the regulator-target relationship in Supplementary Table 9 and Supplementary Figures 3 and 4), we use the STF-binding sites and target predictions from the analyses by MacIsaac et al (2006) of the genome-wide ChIP-chip data (Lee et al, 2002; Harbison et al, 2004). Given two transcription factors X and Y, the number of genes co-regulated by both transcription factors Nxy is counted. A P-value for the significance of the overlap between the target genes is calculated based on hypergeometric distribution (with Bonferroni correction):
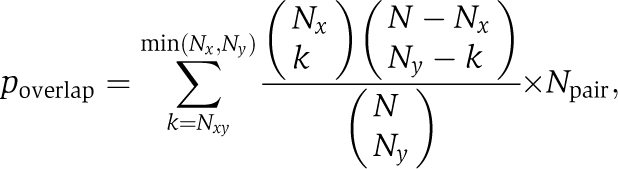 |
where Nx and Ny are the number of target genes for X and Y, N is the total number of ORFs in the yeast genome, and Npair is the total number of STF pairs (for Bonferroni correction). Given a cutoff pcutoff, STF pairs with poverlap⩽pcutoff are selected. We show that negative interactions are further enriched in the STF pairs with overlapping targets compared with general STF pairs. A P-value for the enrichment is calculated based on hypergeometric distribution:
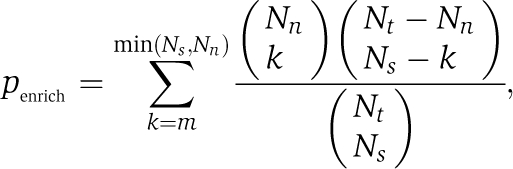 |
where m is the number of negative interactions within the selected pairs Ns, Nt is the total number of STF pairs with a valid S-score, and Nn is the total number of negative interactions within Nt pairs.
Confirmation of genetic interactions by quantitative growth rate measurements using a flow cytometer-based competition growth assay
To confirm the genetic interactions derived from colony growth assay with an independent approach, we quantitatively measure the growth rates of the single and double mutants using a flow cytometer-based competitive growth assay described previously by Breslow et al (2008). To select the pairs for the growth assay, the genetic interactions were first divided into three groups: positive, neutral, and negative. We then randomly chose approximately 30 pairs from each group, with a bias toward genes with more interactions, to reduce the number of single mutants to measure. This way, we picked about 100 double-deletion strains involving about 80 genes that cover a similar number of positive, negative, and neutral interactions. Such selection allowed us to measure the growth rate of single- and double-deletion strains together in a 384-well plate with two replicates for each strain. The RFP-tagged wild-type strain, the wild-type strains bearing the KanR or NATR-GFP markers integrated at the his3Δ1 locus (Breslow et al, 2008) and pFA6a-TEF2Pr-eGFP-ADH1-Primer-NATMX4 plasmid were obtained from the authors. GFP-tagged SGA-compatible MATα single-mutant NATR strains were constructed by replacement of the gene of interest with the NATR-GFP cassette. The resulting strains were then crossed with BY4741-derived MATa single-mutant KanR strains to generate GFP-tagged double-mutant deletion strains. To measure the growth rate of the strains with appropriate single deletions for genetic interactions calculation, isogenic single-mutant strains were generated by crossing the same KanR and NATR-GFP marked single gene deletion strains with appropriate wild-type strains bearing the KanR or NATR-GFP markers integrated at the his3Δ1 locus (Breslow et al, 2008). Each mutant strain has two independent replicates. All strains were arrayed into one 384-well plate for competitive growth with the wild-type strain. Relative growth rates were measured using the method described previously (Breslow et al, 2008) (also see Supplementary Figure 5). Relative variance of the growth rate was calculated from the two replicates
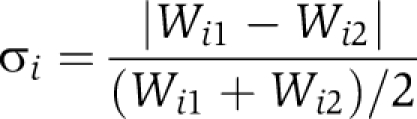 |
(Wi1 and Wi2 are the growth rates of the two replicates of mutant strain i relative to the wild-type strain). Strains with large relative variance (σi⩾0.05) were removed from the analysis. The mean relative growth rates were then calculated for the rest of mutant strains: Wi=(Wi1+Wi2)/2. The genetic interaction is defined as ε=WAB−WA × WB and is compared with the S-score from our EMAP data (see Supplementary Tables 3 and 4). ε⩾0.04 and ε⩽−0.04 were used to define the positive/negative interactions, respectively. Pairs with −0.04<ε<0.04 were regarded as showing neutral interactions. The consistency of EMAP data with the interactions measured by growth rate was defined as the percent of pairs with positive/neutral/negative interactions identified by EMAP that were also classified as the same type of interactions by the growth rate measurements using flow cytometer. For some single gene deletions, the isogenic strains were generated by both of the above crossing methods (Supplementary Table 3). The strains generated from different crossing methods were treated separately when calculating genetic interactions.
Gene expression measurements and analysis
Strains
A list of all mutants strains used in gene expression measurements is available in Supplementary Table 5. Diploid strains were made by crossing one NATR mutant strain with another KanR single-mutant strain. Single- and double-mutant haploid strains (MATα) were selected with tetrad dissection from the diploid strains.
Microarray experiments
Expression profiling of mutant strains was performed using long oligomer arrays as described previously in detail (Margaritis et al, 2009). In brief, each strain was cultured twice and labeled cDNA was hybridized twice in dye-swap replicate against a single-common reference wt cDNA, yielding a total of four estimates of changes in gene expression for each strain versus wt. Normalization was performed using print-tip Loess and statistical analysis was performed by LIMMA (Smyth, 2004). A gene was regarded as significantly changed if the P-value was <0.01 and the fold change >1.5. Some genes in the pathways associated with the autotrophic markers in the wild-type strain were found to change coordinately in multiple mutants bearing different single/double deletions. These genes were removed from the following analysis and the Supplementary Figure 2. The gene expression data reported in this paper have been deposited in the ArrayExpress (http://www.ebi.ac.uk/microarray-as/ae/) with accession no. E-TABM-1030.
Definition of potential target genes with transcription factor occupancy data
Genome-wide occupancy data were downloaded from Yeast TransfactomeDB (Foat et al, 2008). Position-specific affinity matrices (PSAMs) was derived using MatrixReduce (Foat et al, 2006, 2008) from ChIP-chip data (Harbison et al, 2004). The PSAM for a transcription factor was then used to calculate the occupancy (or predicted-binding affinity) of each promoter by the transcription factor (Foat et al, 2008). We used the target genes defined by MacIsaac et al (2006) as a reference set to define a occupancy cutoff that leads to the most significant overlap between the predicted target set (based on occupancy) and the reference set. This allowed us to include those potential target genes that have relatively high ChIP-chip signal but fail to pass the more stringent cutoff used by MacIssac et al. The predicted target set and reference set were then merged as the potential regulatory targets for the transcription factors. These potential targets were used to analyze the enrichment of the common targets of a pair of TFs in the genes changed only in the double mutants.
Supplementary Material
Supplementary Tables 1,2,4,5,6,7,8,10 and Supplementary Figures 1,2,3,4,5 and Supplementary References
EMAP data
Supplementary Table 3
Supplementary Table 9
Acknowledgments
We would like to acknowledge members of the Krogan and Li labs for helpful discussions and comments. We would also like to thank D Breslow, B Andrews and C Boone for reagents. This work is supported by NIH Grants (GM084448, GM084279 and GM081879 (NJK)) and (GM70808, GM90293 and GM081879 (HL)). HL is also supported by the Packard Fellowship in Science and Engineering. NJK is a Searle Scholar and Keck Young Investigator Fellow.
Footnotes
The authors declare that they have no conflict of interest.
References
- Adam M, Robert F, Larochelle M, Gaudreau L (2001) H2A.Z is required for global chromatin integrity and for recruitment of RNA polymerase II under specific conditions. Mol Cell Biol 21: 6270–6279 [DOI] [PMC free article] [PubMed] [Google Scholar]
- Aguilar PS, Frohlich F, Rehman M, Shales M, Ulitsky I, Olivera-Couto A, Braberg H, Shamir R, Walter P, Mann M, Ejsing CS, Krogan NJ, Walther TC (2010) A plasma-membrane E-MAP reveals links of the eisosome with sphingolipid metabolism and endosomal trafficking. Nat Struct Mol Biol 17: 901–908 [DOI] [PMC free article] [PubMed] [Google Scholar]
- Badis G, Berger MF, Philippakis AA, Talukder S, Gehrke AR, Jaeger SA, Chan ET, Metzler G, Vedenko A, Chen X, Kuznetsov H, Wang CF, Coburn D, Newburger DE, Morris Q, Hughes TR, Bulyk ML (2009) Diversity and complexity in DNA recognition by transcription factors. Science 324: 1720–1723 [DOI] [PMC free article] [PubMed] [Google Scholar]
- Badis G, Chan ET, van Bakel H, Pena-Castillo L, Tillo D, Tsui K, Carlson CD, Gossett AJ, Hasinoff MJ, Warren CL, Gebbia M, Talukder S, Yang A, Mnaimneh S, Terterov D, Coburn D, Yeo AL, Yeo ZX, Clarke ND, Lieb JD et al. (2008) A library of yeast transcription factor motifs reveals a widespread function for Rsc3 in targeting nucleosome exclusion at promoters. Mol Cell 32: 878–887 [DOI] [PMC free article] [PubMed] [Google Scholar]
- Beltrao P, Cagney G, Krogan NJ (2010) Quantitative genetic interactions reveal biological modularity. Cell 141: 739–745 [DOI] [PMC free article] [PubMed] [Google Scholar]
- Beltrao P, Trinidad JC, Fiedler D, Roguev A, Lim WA, Shokat KM, Burlingame AL, Krogan NJ (2009) Evolution of phosphoregulation: comparison of phosphorylation patterns across yeast species. PLoS Biol 7: e1000134. [DOI] [PMC free article] [PubMed] [Google Scholar]
- Berger MF, Bulyk ML (2009) Universal protein-binding microarrays for the comprehensive characterization of the DNA-binding specificities of transcription factors. Nat Protoc 4: 393–411 [DOI] [PMC free article] [PubMed] [Google Scholar]
- Bilu Y, Barkai N (2005) The design of transcription-factor binding sites is affected by combinatorial regulation. Genome Biol 6: R103. [DOI] [PMC free article] [PubMed] [Google Scholar]
- Blaiseau PL, Isnard AD, Surdin-Kerjan Y, Thomas D (1997) Met31p and Met32p, two related zinc finger proteins, are involved in transcriptional regulation of yeast sulfur amino acid metabolism. Mol Cell Biol 17: 3640–3648 [DOI] [PMC free article] [PubMed] [Google Scholar]
- Breslow DK, Cameron DM, Collins SR, Schuldiner M, Stewart-Ornstein J, Newman HW, Braun S, Madhani HD, Krogan NJ, Weissman JS (2008) A comprehensive strategy enabling high-resolution functional analysis of the yeast genome. Nat Methods 5: 711–718 [DOI] [PMC free article] [PubMed] [Google Scholar]
- Buchler NE, Gerland U, Hwa T (2003) On schemes of combinatorial transcription logic. Proc Natl Acad Sci USA 100: 5136–5141 [DOI] [PMC free article] [PubMed] [Google Scholar]
- Bulyk ML (2006) DNA microarray technologies for measuring protein-DNA interactions. Curr Opin Biotechnol 17: 422–430 [DOI] [PMC free article] [PubMed] [Google Scholar]
- Carrozza MJ, Li B, Florens L, Suganuma T, Swanson SK, Lee KK, Shia WJ, Anderson S, Yates J, Washburn MP, Workman JL (2005) Histone H3 methylation by Set2 directs deacetylation of coding regions by Rpd3S to suppress spurious intragenic transcription. Cell 123: 581–592 [DOI] [PubMed] [Google Scholar]
- Chin CS, Chuang JH, Li H (2005) Genome-wide regulatory complexity in yeast promoters: separation of functionally conserved and neutral sequence. Genome Res 15: 205–213 [DOI] [PMC free article] [PubMed] [Google Scholar]
- Chua G, Morris QD, Sopko R, Robinson MD, Ryan O, Chan ET, Frey BJ, Andrews BJ, Boone C, Hughes TR (2006) Identifying transcription factor functions and targets by phenotypic activation. Proc Natl Acad Sci USA 103: 12045–12050 [DOI] [PMC free article] [PubMed] [Google Scholar]
- Collins SR, Miller KM, Maas NL, Roguev A, Fillingham J, Chu CS, Schuldiner M, Gebbia M, Recht J, Shales M, Ding H, Xu H, Han J, Ingvarsdottir K, Cheng B, Andrews B, Boone C, Berger SL, Hieter P, Zhang Z et al. (2007) Functional dissection of protein complexes involved in yeast chromosome biology using a genetic interaction map. Nature 446: 806–810 [DOI] [PubMed] [Google Scholar]
- Collins SR, Schuldiner M, Krogan NJ, Weissman JS (2006) A strategy for extracting and analyzing large-scale quantitative epistatic interaction data. Genome Biol 7: R63. [DOI] [PMC free article] [PubMed] [Google Scholar]
- Cooper TG (2002) Transmitting the signal of excess nitrogen in Saccharomyces cerevisiae from the Tor proteins to the GATA factors: connecting the dots. FEMS Microbiol Rev 26: 223–238 [DOI] [PMC free article] [PubMed] [Google Scholar]
- Courchesne WE, Magasanik B (1988) Regulation of nitrogen assimilation in Saccharomyces cerevisiae: roles of the URE2 and GLN3 genes. J Bacteriol 170: 708–713 [DOI] [PMC free article] [PubMed] [Google Scholar]
- Crespo JL, Daicho K, Ushimaru T, Hall MN (2001) The GATA transcription factors GLN3 and GAT1 link TOR to salt stress in Saccharomyces cerevisiae. J Biol Chem 276: 34441–34444 [DOI] [PubMed] [Google Scholar]
- Cunningham TS, Andhare R, Cooper TG (2000) Nitrogen catabolite repression of DAL80 expression depends on the relative levels of Gat1p and Ure2p production in Saccharomyces cerevisiae. J Biol Chem 275: 14408–14414 [DOI] [PMC free article] [PubMed] [Google Scholar]
- DeRisi JL, Iyer VR (1999) Genomics and array technology. Curr Opin Oncol 11: 76–79 [DOI] [PubMed] [Google Scholar]
- Fiedler D, Braberg H, Mehta M, Chechik G, Cagney G, Mukherjee P, Silva AC, Shales M, Collins SR, van Wageningen S, Kemmeren P, Holstege FCP, Weissman JS, Keogh MC, Koller D, Shokat KM, Krogan NJ (2009) Functional organization of the S-cerevisiae phosphorylation network. Cell 136: 952–963 [DOI] [PMC free article] [PubMed] [Google Scholar]
- Foat BC, Morozov AV, Bussemaker HJ (2006) Statistical mechanical modeling of genome-wide transcription factor occupancy data by MatrixREDUCE. Bioinformatics 22: e141–e149 [DOI] [PubMed] [Google Scholar]
- Foat BC, Tepper RG, Bussemaker HJ (2008) TransfactomeDB: a resource for exploring the nucleotide sequence specificity and condition-specific regulatory activity of trans-acting factors. Nucleic Acids Res 36: D125–D131 [DOI] [PMC free article] [PubMed] [Google Scholar]
- Guarente L (1993) Synthetic enhancement in gene interaction: a genetic tool come of age. Trends Genet 9: 362–366 [DOI] [PubMed] [Google Scholar]
- Harbison CT, Gordon DB, Lee TI, Rinaldi NJ, Macisaac KD, Danford TW, Hannett NM, Tagne JB, Reynolds DB, Yoo J, Jennings EG, Zeitlinger J, Pokholok DK, Kellis M, Rolfe PA, Takusagawa KT, Lander ES, Gifford DK, Fraenkel E, Young RA (2004) Transcriptional regulatory code of a eukaryotic genome. Nature 431: 99–104 [DOI] [PMC free article] [PubMed] [Google Scholar]
- Hu Z, Killion PJ, Iyer VR (2007) Genetic reconstruction of a functional transcriptional regulatory network. Nat Genet 39: 683–687 [DOI] [PubMed] [Google Scholar]
- Ideker T, Thorsson V, Ranish JA, Christmas R, Buhler J, Eng JK, Bumgarner R, Goodlett DR, Aebersold R, Hood L (2001) Integrated genomic and proteomic analyses of a systematically perturbed metabolic network. Science 292: 929–934 [DOI] [PubMed] [Google Scholar]
- Istrail S, Davidson EH (2005) Logic functions of the genomic cis-regulatory code. Proc Natl Acad Sci USA 102: 4954–4959 [DOI] [PMC free article] [PubMed] [Google Scholar]
- Johnson DS, Mortazavi A, Myers RM, Wold B (2007) Genome-wide mapping of in vivo protein-DNA interactions. Science 316: 1497–1502 [DOI] [PubMed] [Google Scholar]
- Johnston M (1999) Feasting, fasting and fermenting. Glucose sensing in yeast and other cells. Trends Genet 15: 29–33 [DOI] [PubMed] [Google Scholar]
- Kelley R, Ideker T (2005) Systematic interpretation of genetic interactions using protein networks. Nat Biotechnol 23: 561–566 [DOI] [PMC free article] [PubMed] [Google Scholar]
- Keogh MC, Kurdistani SK, Morris SA, Ahn SH, Podolny V, Collins SR, Schuldiner M, Chin K, Punna T, Thompson NJ, Boone C, Emili A, Weissman JS, Hughes TR, Strahl BD, Grunstein M, Greenblatt JF, Buratowski S, Krogan NJ (2005) Cotranscriptional set2 methylation of histone H3 lysine 36 recruits a repressive Rpd3 complex. Cell 123: 593–605 [DOI] [PubMed] [Google Scholar]
- Komili S, Silver PA (2008) Coupling and coordination in gene expression processes: a systems biology view. Nat Rev Genet 9: 38–48 [DOI] [PubMed] [Google Scholar]
- Korber P, Horz W (2004) SWRred not shaken; mixing the histones. Cell 117: 5–7 [DOI] [PubMed] [Google Scholar]
- Landry J, Sutton A, Hesman T, Min J, Xu RM, Johnston M, Sternglanz R (2003) Set2-catalyzed methylation of histone H3 represses basal expression of GAL4 in Saccharomyces cerevisiae. Mol Cell Biol 23: 5972–5978 [DOI] [PMC free article] [PubMed] [Google Scholar]
- Lee TI, Rinaldi NJ, Robert F, Odom DT, Bar-Joseph Z, Gerber GK, Hannett NM, Harbison CT, Thompson CM, Simon I, Zeitlinger J, Jennings EG, Murray HL, Gordon DB, Ren B, Wyrick JJ, Tagne JB, Volkert TL, Fraenkel E, Gifford DK et al. (2002) Transcriptional regulatory networks in Saccharomyces cerevisiae. Science 298: 799–804 [DOI] [PubMed] [Google Scholar]
- MacIsaac KD, Wang T, Gordon DB, Gifford DK, Stormo GD, Fraenkel E (2006) An improved map of conserved regulatory sites for Saccharomyces cerevisiae. BMC Bioinformatics 7: 113. [DOI] [PMC free article] [PubMed] [Google Scholar]
- Margaritis T, Lijnzaad P, van Leenen D, Bouwmeester D, Kemmeren P, van Hooff SR, Holstege FC (2009) Adaptable gene-specific dye bias correction for two-channel DNA microarrays. Mol Syst Biol 5: 266. [DOI] [PMC free article] [PubMed] [Google Scholar]
- Messenguy F (1976) Regulation of arginine biosynthesis in Saccharomyces cerevisiae: isolation of a cis-dominant, constitutive mutant for ornithine carbamoyltransferase synthesis. J Bacteriol 128: 49–55 [DOI] [PMC free article] [PubMed] [Google Scholar]
- Pellman D, McLaughlin ME, Fink GR (1990) TATA-dependent and TATA-independent transcription at the HIS4 gene of yeast. Nature 348: 82–85 [DOI] [PubMed] [Google Scholar]
- Raisner RM, Hartley PD, Meneghini MD, Bao MZ, Liu CL, Schreiber SL, Rando OJ, Madhani HD (2005) Histone variant H2A.Z marks the % ends of both active and inactive genes in euchromatin. Cell 123: 233–248 [DOI] [PMC free article] [PubMed] [Google Scholar]
- Robertson G, Hirst M, Bainbridge M, Bilenky M, Zhao YJ, Zeng T, Euskirchen G, Bernier B, Varhol R, Delaney A, Thiessen N, Griffith OL, He A, Marra M, Snyder M, Jones S (2007) Genome-wide profiles of STAT1 DNA association using chromatin immunoprecipitation and massively parallel sequencing. Nat Methods 4: 651–657 [DOI] [PubMed] [Google Scholar]
- Roguev A, Bandyopadhyay S, Zofall M, Zhang K, Fischer T, Collins SR, Qu H, Shales M, Park HO, Hayles J, Hoe KL, Kim DU, Ideker T, Grewal SI, Weissman JS, Krogan NJ (2008) Conservation and rewiring of functional modules revealed by an epistasis map in fission yeast. Science 322: 405–410 [DOI] [PMC free article] [PubMed] [Google Scholar]
- Schmelzle T, Beck T, Martin DE, Hall MN (2004) Activation of the RAS/cyclic AMP pathway suppresses a TOR deficiency in yeast. Mol Cell Biol 24: 338–351 [DOI] [PMC free article] [PubMed] [Google Scholar]
- Schroder M, Clark R, Liu CY, Kaufman RJ (2004) The unfolded protein response represses differentiation through the RPD3-SIN3 histone deacetylase. EMBO J 23: 2281–2292 [DOI] [PMC free article] [PubMed] [Google Scholar]
- Schuldiner M, Collins SR, Thompson NJ, Denic V, Bhamidipati A, Punna T, Ihmels J, Andrews B, Boone C, Greenblatt JF, Weissman JS, Krogan NJ (2005) Exploration of the function and organization of the yeast early secretory pathway through an epistatic miniarray profile. Cell 123: 507–519 [DOI] [PubMed] [Google Scholar]
- Schuldiner M, Collins SR, Weissman JS, Krogan NJ (2006) Quantitative genetic analysis in Saccharomyces cerevisiae using epistatic miniarray profiles (E-MAPs) and its application to chromatin functions. Methods 40: 344–352 [DOI] [PubMed] [Google Scholar]
- Smyth GK (2004) Linear models and empirical Bayes methods for assessing differential expression in microarray experiments. Stat Appl Genet Mol Biol 3: Article3. [DOI] [PubMed] [Google Scholar]
- Soussi-Boudekou S, Andre B (1999) A co-activator of nitrogen-regulated transcription in Saccharomyces cerevisiae. Mol Microbiol 31: 753–762 [DOI] [PubMed] [Google Scholar]
- Tanay A, Regev A, Shamir R (2005) Conservation and evolvability in regulatory networks: the evolution of ribosomal regulation in yeast. Proc Natl Acad Sci USA 102: 7203–7208 [DOI] [PMC free article] [PubMed] [Google Scholar]
- Tong AH, Evangelista M, Parsons AB, Xu H, Bader GD, Page N, Robinson M, Raghibizadeh S, Hogue CW, Bussey H, Andrews B, Tyers M, Boone C (2001) Systematic genetic analysis with ordered arrays of yeast deletion mutants. Science 294: 2364–2368 [DOI] [PubMed] [Google Scholar]
- Tong AH, Lesage G, Bader GD, Ding H, Xu H, Xin X, Young J, Berriz GF, Brost RL, Chang M, Chen Y, Cheng X, Chua G, Friesen H, Goldberg DS, Haynes J, Humphries C, He G, Hussein S, Ke L et al. (2004) Global mapping of the yeast genetic interaction network. Science 303: 808–813 [DOI] [PubMed] [Google Scholar]
- Traven A, Jelicic B, Sopta M (2006) Yeast Gal4: a transcriptional paradigm revisited. EMBO Rep 7: 496–499 [DOI] [PMC free article] [PubMed] [Google Scholar]
- Tsong AE, Tuch BB, Li H, Johnson AD (2006) Evolution of alternative transcriptional circuits with identical logic. Nature 443: 415–420 [DOI] [PubMed] [Google Scholar]
- Tuch BB, Li H, Johnson AD (2008) Evolution of eukaryotic transcription circuits. Science 319: 1797–1799 [DOI] [PubMed] [Google Scholar]
- Wilmes GM, Bergkessel M, Bandyopadhyay S, Shales M, Braberg H, Cagney G, Collins SR, Whitworth GB, Kress TL, Weissman JS, Ideker T, Guthrie C, Krogan NJ (2008) A genetic interaction map of RNA-processing factors reveals links between Sem1/Dss1-containing complexes and mRNA export and splicing. Mol Cell 32: 735–746 [DOI] [PMC free article] [PubMed] [Google Scholar]
- Zhang H, Roberts DN, Cairns BR (2005) Genome-wide dynamics of Htz1, a histone H2A variant that poises repressed/basal promoters for activation through histone loss. Cell 123: 219–231 [DOI] [PMC free article] [PubMed] [Google Scholar]
- Zhu J, Zhang MQ (1999) SCPD: a promoter database of the yeast Saccharomyces cerevisiae. Bioinformatics 15: 607–611 [DOI] [PubMed] [Google Scholar]
Associated Data
This section collects any data citations, data availability statements, or supplementary materials included in this article.
Supplementary Materials
Supplementary Tables 1,2,4,5,6,7,8,10 and Supplementary Figures 1,2,3,4,5 and Supplementary References
EMAP data
Supplementary Table 3
Supplementary Table 9