

Abstract
What determines the rate of protein evolution is a fundamental question in biology. Recent genomic studies revealed a surprisingly strong anticorrelation between the expression level of a protein and its rate of sequence evolution. This observation is currently explained by the translational robustness hypothesis in which the toxicity of translational error-induced protein misfolding selects for higher translational robustness of more abundant proteins, which constrains sequence evolution. However, the impact of error-free protein misfolding has not been evaluated. We estimate that a non-negligible fraction of misfolded proteins are error free and demonstrate by a molecular-level evolutionary simulation that selection against protein misfolding results in a greater reduction of error-free misfolding than error-induced misfolding. Thus, an overarching protein-misfolding-avoidance hypothesis that includes both sources of misfolding is superior to the translational robustness hypothesis. We show that misfolding-minimizing amino acids are preferentially used in highly abundant yeast proteins and that these residues are evolutionarily more conserved than other residues of the same proteins. These findings provide unambiguous support to the role of protein-misfolding-avoidance in determining the rate of protein sequence evolution.
Keywords: evolutionary rate, expression level, mistranslation, protein misfolding
Introduction
The rate of protein sequence evolution has long been of central interest to molecular evolutionists (Zukerkandl and Pauling, 1965; Kimura, 1968; Kimura and Ohta, 1974; King and Wilson, 1975; Nei, 1987; Li, 1997; Page and Holmes, 1998; Koonin and Galperin, 2003). Earlier studies of this subject led to the discovery of the molecular clock (Zukerkandl and Pauling, 1965) and prompted the proposal of the paradigm-shifting neutral theory of molecular evolution (Kimura, 1968; King and Jukes, 1969). It is now well known that, the same protein tends to have similar evolutionary rates in different evolutionary lineages (i.e., the molecular clock), whereas different proteins of the same species evolve at vastly different rates (Li, 1997; Nei and Kumar, 2000). In the framework of the neutral theory (Kimura, 1983), this latter phenomenon is explained primarily by a variation in functional constraint among different proteins (Kimura and Ohta, 1974). However, it is unclear how to quantify the functional constraint of a protein from the knowledge of its function. Rather, the usual practice is to gauge the functional constraint of a protein by the inverse of its evolutionary rate. As a result, the molecular underpinning of ‘functional constraint’ remains elusive.
In the past decade, the availability of various types of genomic data from model organisms stimulated an empirical search for the determinants of the rate of protein sequence evolution. Gene properties that have been examined for this purpose include, for example, gene importance measured by the fitness effect of gene deletion, gene expression level, gene expression breadth across tissues, protein subcellular localization, number of protein–protein interactions, and gene structural parameters such as protein and intron lengths (Hurst and Smith, 1999; Hirsh and Fraser, 2001; Pal et al, 2001; Fraser et al, 2002; Jordan et al, 2003; Rocha and Danchin, 2004; Subramanian and Kumar, 2004; Zhang and Li, 2004; Wall et al, 2005; Zhang and He, 2005; Drummond et al, 2006; Liao et al, 2006, 2010; Wolf et al, 2006, 2008; Drummond and Wilke, 2008; Wang and Zhang, 2009). It is found that the evolutionary rate is influenced by multiple mutually correlated factors (Wolf et al, 2006) and that somewhat different rules apply to different organisms (Liao et al, 2010). Owing to the interdependence of various rate determinants, it has been argued that the search for the rate determinants of protein evolution is a typical systems biology question (Koonin, 2005). The most unexpected discovery from the extensive searches for rate determinants is a very strong anticorrelation between the expression level and evolutionary rate of a protein (E–R anticorrelation), observed in bacteria, yeast, and several other model organisms (Pal et al, 2001; Rocha and Danchin, 2004; Drummond and Wilke, 2008). In some of these species, the evolutionary rate correlates with the expression level far better than with any other factor, including potential proxies for functional constraints such as gene importance and the number of protein interactions (Drummond et al, 2006). For example, in yeast, the variance in gene expression level explains 25–30% of the variance in protein evolutionary rate, whereas the variance in gene importance explains only 4–6% (Zhang and He, 2005).
Because the E–R anticorrelation largely alters the classic view of a dominant role of protein function in determining the rate of protein sequence evolution (Kimura and Ohta, 1974; Kimura, 1983; Li, 1997), it is of fundamental importance to uncover the mechanisms underlying the E–R anticorrelation. The prevailing explanation of the E–R anticorrelation is the translational robustness hypothesis proposed by Drummond et al (2005). This hypothesis posits that mistranslation induces protein misfolding, which is toxic to cells. Consequently, highly expressed proteins are under stronger pressures to be translationally robust and thus are more constrained in sequence evolution. In this hypothesis, the central element that imposes the selective pressure on protein evolution is the generic toxicity of misfolded proteins (Drummond et al, 2005; Drummond and Wilke, 2008). While proteins containing translational errors may misfold, error-free proteins may also misfold (Pakula and Sauer, 1989; Dobson, 2003). Although the potential influence of error-free protein misfolding on the E–R anticorrelation has been proposed (Drummond et al, 2005; Drummond and Wilke, 2008, 2009), it has not been evaluated. As a result, the relative importance of selection against error-induced and error-free protein misfolding remains unclear (Drummond and Wilke, 2009).
In this study, we first show by theoretical calculation that a non-negligible fraction of misfolded proteins are error free. We then show by a molecular-level evolutionary simulation that selection against protein misfolding is more effective in reducing error-free misfolding than error-induced misfolding. These results suggest that a protein-misfolding-avoidance hypothesis that includes both sources of misfolding is superior to the translational robustness hypothesis. Finally, using yeast genomic data, we offer the strongest empirical evidence thus far for the role of protein-misfolding-avoidance in generating the E–R anticorrelation.
Results
Fraction of misfolded proteins that are error free: theoretical calculation
All protein molecules, regardless of the presence or absence of translational errors, can misfold (Figure 1). Let ΔG be the unfolding energy of a protein molecule (i.e., larger ΔG corresponds to higher protein stability). Assuming thermodynamic equilibrium (see Discussion for justification), the probability that the protein is folded into its native structure (Pnative) and the probability that it is unfolded (Punfold) follow
Figure 1.

Sources of misfolded proteins. The translational robustness hypothesis considers only translational error-induced misfolding (arrow 6), whereas the overarching protein-misfolding-avoidance hypothesis considers both error-induced misfolding (arrow 6) and error-free misfolding (arrow 4).
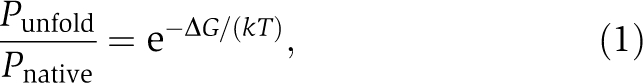 |
where k is the Boltzmann constant of 1.986 cal/mol/K, T is the absolute temperature, and Pnative+Punfold=1 (Pakula and Sauer, 1989). The so-called unfolded state is an ensemble of many non-native structures, including completely disordered structures. It is likely that the toxicity of protein misfolding is largely dependent on the number of molecules that are in non-native states rather than the specific non-native structures that they form (Bucciantini et al, 2002). In fact, cellular responses to unfolded and misfolded proteins, such as the unfolded protein response of the endoplasmic reticulum (Schroder and Kaufman, 2005), are often the same. Thus, for a given protein, Pmisfold is expected to be approximately proportional to Punfold, or Pmisfold≈aPunfold, where a is a protein-specific constant. Without loss of generality, we assume a=1. Then,
 |
When e−ΔG/(kT)≪1, Equation (2) can be simplified as
Most natural proteins have a ΔG of 5–10 kcal/mol when synthesized correctly (Bava et al, 2004; Dill et al, 2008). Assuming ΔG=5 kcal/mol and T=302 K (30°C), the probability that a correctly translated wild-type protein will be misfolded is 2.40 × 10⁻⁴. The translational error rate has been estimated to be ∼5 × 10⁻⁴ per codon (Drummond and Wilke, 2008, 2009). For a protein with L amino acids, the probability that a protein molecule is error free is (1–5 × 10⁻⁴)L, which equals 81% for an average-length yeast protein (L=415) (Drummond et al. 2005). The number of misfolded error-free proteins is then Merror free=N × (1–5 × 10−4)L × 2.40 × 10−4, where N is the total number of protein molecules synthesized from a gene. For example, the number of misfolded error-free molecules for an average-length yeast protein is 1.95 × 10⁻⁴N.
Now, let us consider mistranslation-induced misfolding. We denote the increase in unfolding energy caused by an amino-acid change in a protein by ΔΔG; ΔΔG is usually negative because most errors reduce protein stability. If we assume that the total increase in unfolding energy caused by multiple amino-acid changes is the sum of the increase by individual changes (ΣΔΔG), the unfolding energy of a mistranslated protein is
For each of the 497 yeast proteins whose structures (or homologs’ structures) are available, we estimated the probability of each of the 19 possible mistranslations at each amino-acid residue and its associated ΔΔG, with the use of (i) actual mistranslation patterns (Freeland and Hurst, 1998), (ii) the average mistranslation rate of 5 × 10⁻⁴ per codon, and (iii) the assumption of ΔG=5 kcal/mol (see Materials and methods). We then calculated the probability of occurrence of each possible protein sequence of the gene with one, two, or three errors and its associated Pmisfold. We ignored the scenario of having more than three errors in a molecule, because of its low probability (<7 × 10⁻⁵ for an average-length protein). These probability and Pmisfold values allowed the estimation of the expected probability of mistranslation-induced misfolding for the gene. On the basis of this number and the number of error-free misfolded molecules, we calculated the fraction of misfolded proteins that are error free for each gene. We found that this fraction varies widely, with 95% of the genes falling in the range between 3.3 and 67.8%. The mean and median values are 19.7 and 14.0%, respectively. We also repeated the above analysis by assuming a ΔG of 10 kcal/mol. In this case, the fraction of misfolded proteins that are error free is considerably lower, with 95% of the genes falling in the range between 0.07 and 52.0%. The mean and median values become 4.8 and 0.91%, respectively.
These results showed that when a protein is not very stable, a sizable fraction of misfolded molecules are error free. But, when a protein is very stable, this fraction is much smaller. Nonetheless, because high protein stability is probably a result of natural selection against misfolding (see next section), the finding based on ΔG=5 kcal/mol is more likely to reflect the situation when protein misfolding has not been reduced much by selection, whereas the finding based on ΔG=10 kcal/mol is more likely to reflect the situation when protein misfolding has been substantially reduced by selection. In other words, the low fraction of error-free misfolding for stable proteins is likely a consequence of selection against misfolding (see next section). Our calculations thus suggest the existence of a sizable fraction of error-free misfolding that may be reduced considerably by selection. Therefore, it is important to consider error-free protein misfolding, in addition to error-induced misfolding.
Selection against error-free and error-induced protein misfolding: computer simulation
Can we differentiate between selection against error-free and error-induced protein misfolding? Selection against error-free misfolding will result in an increase of ΔG (see Equation (2)). As a by-product of this increase, ΔG′ also increases (see Equation (4)), which leads to a reduction of error-induced misfolding. Selection against error-induced misfolding can have two consequences. First, the mistranslation rate may be reduced by preferential use of codons with lower mistranslation rates. Second, ΔG may be increased such that ΔG′ becomes larger. As a by-product of the increase of ΔG, error-free misfolding is also reduced. Thus, natural selection against one type of misfolding also results in the reduction of the other type. This property makes it difficult to evaluate the relative contributions of the two sources of misfolding using actual data. However, it is possible to examine the effects of the two types of misfolding separately using computer simulation.
We carried out three molecular-level evolutionary simulations following the general strategy used previously in demonstrating the translational robustness hypothesis (Drummond and Wilke, 2008) (Figure 2A). We used a lattice model (Taverna and Goldstein, 2002a, 2002b) to describe the structure and folding dynamics of proteins of 25 amino acids. We first identified 500 relatively stable protein sequences. For each of them, the most stable conformation was regarded as its native structure. A unique expression level was assigned to each protein such that the number of correctly folded molecules must meet the given expression level. We then created a population of 1000 haploid individuals of a hypothetical unicellular organism for each of these 500 protein-coding genes. The fitness of each individual depended on the number of misfolded proteins (see Equation (6) in Materials and methods), which we determined probabilistically from Equations (2) and (4). This procedure may be more realistic than that used in the previous study (Drummond and Wilke, 2008), which applied an unfolding energy cutoff for misfolding. The populations were subject to evolution with mutation, drift, and selection for 100 000 generations to reach equilibrium (i.e., ΔG stabilizes). Following the previous study (Drummond and Wilke, 2008), we assigned different translational error rates to different codons according to the empirical patterns of mistranslation (Freeland and Hurst, 1998) and assigned the preferred synonymous codons of each amino acid an error rate that is one-fifth that of the unpreferred synonymous codons. The translational error rate was adjusted such that 20% of proteins have at least one error when synonymous codons are equally frequent.
Figure 2.

A molecular-level evolutionary simulation for examining the roles of error-induced and error-free misfolding in generating the anticorrelation between protein expression level and evolutionary rate. (A) The general scheme of the simulation. Simulations are conducted under error-induced misfolding only (B–E), error-free misfolding only (F–I), or both types of misfolding (J–M). In all cases, after 100 000 generations of evolution, protein unfolding energy ΔG is highly positively correlated with the gene expression level (B, F, and J); the probability of protein misfolding is highly negatively correlated with the gene expression level (C, G, and K); and the number of fixed amino acid changes per sequence per 50 000 generations is highly negatively correlated with ΔG (D, H, and L) and gene expression level (E, I, and M). Correlation coefficients and significance levels are determined by Spearman's rank correlation tests. The red lines in panels B–M are estimated using locally weighted scatterplot smoothing.
In the first simulation, only error-induced misfolding was allowed and all error-free proteins were assumed to fold correctly as in the previous study (Drummond and Wilke, 2008). As expected, our results are similar to those from the previous study (Drummond and Wilke, 2008), including a positive correlation between the protein expression level and the ΔG of the error-free protein (Figure 2B), a negative correlation between the expression level and the fraction of protein molecules that misfold after being mistranslated (Figure 2C), a negative correlation between ΔG and the evolutionary rate measured by the number of fixed amino-acid substitutions between the 100 000th and 150 000th generations (Figure 2D), and a negative correlation between the expression level and the evolutionary rate (i.e., the E–R anticorrelation) (Figure 2E).
In the second simulation, we assumed a zero mistranslation rate but allowed misfolding of error-free molecules as described by Equation (2). The results (Figure 2F–I) are similar to those from the first simulation. Apparently, the translational robustness hypothesis is not necessary for explaining the E–R anticorrelation, as we recapitulated the anticorrelation without invoking mistranslation. Interestingly, the resulting E–R anticorrelation from the second simulation (ρ=−0.703) is even stronger than that from the first simulation (−0.578; P<10−6), suggesting that, under the current parameter settings, selection against error-free misfolding is more effective than selection against error-induced misfolding in generating the E–R anticorrelation.
Because both error-free and error-induced misfolding exist, we performed a third, more realistic simulation in which both sources of misfolding were included. We again observed all of the patterns found in the first two simulations (Figure 2J–M). The resulting E–R anticorrelation (−0.719) is even stronger than that from the second simulation (−0.703), although their difference is not statistically significant (P=0.23). We repeated the above three simulations with different parameters of mistranslation rates (Supplementary Figures S1–S2), minimal stability of wild-type proteins (Supplementary Figure S3), and protein length (Supplementary Figure S4), and found the results to be very similar.
In the third simulation, we also separately estimated the probabilities of error-free and error-induced misfolding. Among lowly expressed proteins, the average probability of error-free misfolding (Figure 3A) exceeds that of error-induced misfolding (Figure 3B), and ∼58% of misfolded proteins are error free (Figure 3C). As the expression level increases, the probabilities of both types of misfolding decrease in our simulated proteins (Figure 3A and 3B), but the amount of decrease is larger for error-free misfolding (Figure 3A) than for error-induced misfolding (Figure 3B), such that the fraction of misfolded molecules that are error free is only ∼40% for highly abundant proteins (Figure 3C). If we compare between very lowly and very highly expressed proteins, ∼60% of the difference in their probabilities of misfolding is contributed by a reduction in error-free misfolding, whereas ∼40% is contributed by the reduction in error-induced misfolding. In other words, selection against misfolding of highly expressed proteins results in a greater reduction in error-free misfolding than in error-induced misfolding.
Figure 3.

Amount of error-free and error-induced protein misfolding found in computer simulations when both sources of misfolding are considered. The probabilities of error-free misfolding (A) and error-induced misfolding (B) and the fraction of misfolded molecules that are error-free (C) all decrease with the rise of the gene expression level. (D) The rate of translational error per protein decreases as the gene expression level increases. (E) The destabilizing effect (−ΔΔG) per translational error increases with gene expression level. (F) The total destabilization effect of mistranslation increases with gene expression level. Correlation coefficients and significance levels are determined by Spearman's rank correlation tests. The red lines are estimated using locally weighted scatterplot smoothing.
The above finding can be explained as follows. On the one hand, as the expression level rises, selection favoring the use of more accurately translated codons becomes stronger. Indeed, we observed the mistranslation rate to decrease with the rise of the protein expression level, although the magnitude of this decrease is only ∼25% from the lowest to highest expressions (Figure 3D). On the other hand, the rise in expression level leads to the preferential use of amino acids that maximize ΔG. This usage consequently renders the expected −ΔΔG (which is usually positive) larger when a translational error occurs (i.e., the error is of greater magnitude). Indeed, we observed that −ΔΔG increases by ∼400% from lowly to highly expressed proteins (Figure 3E). Hence, although the translational error rate is slightly reduced in highly expressed proteins, errors are on average much larger. The total effect of mistranslation in destabilizing protein structure, measured by the product of the mistranslation rate and e−ΔΔG/(kT), rises with expression level (Figure 3F). Consequently, error-induced misfolding does not decrease as much as error-free misfolding when the protein expression level increases. Our results also demonstrate that, in the simulation, the translational robustness of abundant proteins is actually realized by increasing the stability of the error-free protein (i.e., ΔG), rather than by reducing the total destabilizing effect of mistranslation (i.e., the product of the mistranslation rate and e−ΔΔG/(kT)). This said, we caution that the fraction of misfolded molecules that are error free appears higher in the simulation than what was calculated for actual yeast proteins. This discrepancy is likely due to the considerably shorter proteins used in the simulation than in reality.
Empirical evidence for the protein-misfolding-avoidance hypothesis
Our theoretical calculation and computer simulation clearly showed that (i) both error-free and error-induced misfolding occur and contribute to the generation of the E–R anticorrelation and (ii) selection against protein misfolding is more effective in reducing error-free misfolding than error-induced misfolding. It is important to note that when the translational robustness hypothesis was proposed, the authors mentioned both sources of protein misfolding, although the focus was quickly turned to error-induced misfolding only (Drummond et al., 2005). We suggest that the overarching protein-misfolding-avoidance hypothesis that considers both error-free and error-induced protein misfolding is more complete and accurate than the translational robustness hypothesis for explaining the E–R anticorrelation.
The protein-misfolding-avoidance hypothesis makes three key predictions. First, it predicts that highly expressed proteins are, on average, more stable than lowly expressed proteins. Second, it predicts that codons minimizing protein misfolding are used more frequently in highly expressed proteins than in lowly expressed ones. Third, it predicts that, within the same protein, amino-acid residues in which a random nonsynonymous mutation is more likely to increase the protein misfolding probability are evolutionarily more conserved. Below, we examine these three predictions using empirical data from the baker's yeast Saccharomyces cerevisiae.
For the first prediction, the most direct support would be a positive correlation between the expression level of a protein and its ΔG. ΔG has been experimentally determined for only a few proteins of any given species, and these ΔG values of different proteins were often measured under different conditions, making any meaningful comparison difficult. Furthermore, computational estimation of ΔG is unreliable, except when the protein is very small and has an experimentally determined structure (Boas and Harbury, 2007; Dill et al, 2008). We searched the ProTherm database (Bava et al, 2004) and found only five non-prion yeast wild-type proteins. We extracted their ΔG values from the condition that is closest to pH 7 and 25°C. Consistent with our prediction, ΔG is positively correlated with the mRNA expression level (Holstege et al, 1998), although the correlation is not significant (ρ=0.80; P<0.13) because of the small sample size. We did not use protein expression data here because the sample size would be further reduced. Another often-used measure of protein stability is the protein melting temperature (Tm). There are 11 wild-type yeast proteins with experimentally measured Tm in ProTherm. After extracting their Tm values from the condition that is closest to pH 7, we found that Tm is also positively correlated with mRNA expression level, but the correlation is again not significant (ρ=0.32; P<0.44).
Protein instability may also be measured by protein aggregation, which is a common form of misfolding and has been reported to correlate negatively with gene expression level in bacteria (de Groot and Ventura, 2010) and human (Tartaglia et al, 2007). We attempted to verify this anticorrelation in yeast using two different computational predictions of aggregation propensity based on protein sequences TANGO and AGGRESCAN (Fernandez-Escamilla et al, 2004; Conchillo-Sole et al, 2007). A significant anticorrelation between mRNA expression level and protein aggregation propensity was observed when TANGO was used (P<10−16, Mann–Whitney test; Supplementary Figure S5A), whereas no significant correlation was observed when AGGRESCAN was used (P=0.182, Mann–Whitney test; Supplementary Figure S5B). Nonetheless, on average, the 5% most expressed genes have significantly lower aggregation propensities than the 5% least expressed genes, no matter which prediction method is used (TANGO: P<10−6, Supplementary Fig S5C; AGGRESCAN: P=0.027, Supplementary Figure S5D). Combined with the comparisons of ΔG and Tm, these results support our first prediction that highly expressed proteins tend to be more stable than lowly expressed ones.
To test the second prediction, we need to calculate the relative probability of protein misfolding (pmisfold, including both error-free and error-induced misfolding) when each of the 61 possible sense codons is used at each codon position of a gene. The difference in ΔG between homologous proteins with only one amino acid difference (i.e., ΔΔG) can be computationally estimated with a reasonably high accuracy, either with or without the use of protein structure information (Capriotti et al, 2005). Based on this computational estimation and the assumptions of mistranslation patterns and rates of each of the 61 sense codons, we calculated pmisfold for each of the 61 possible sense codons at each codon position of a gene (Figure 4A; see Materials and methods). Note that the above pmisfold is relative to the total probability of protein misfolding for the wild-type gene, rather than the absolute probability, which cannot be calculated without knowing ΔG. We identify the codon that minimizes pmisfold for each codon position. When the wild-type codon matches this codon, we call the wild-type codon a matching codon. The protein-misfolding-avoidance hypothesis predicts that the fraction of matching codons in a gene (fmatching codon) is greater for highly expressed genes than for lowly expressed ones. Indeed, we found fmatching codon to be positively correlated with the level of gene expression (ρ=0.43; P<10−166; Figure 4B). Here, we used protein expression levels measured by immunodetection of tagged proteins (Ghaemmaghami et al, 2003). Use of microarray-based mRNA expression levels (Holstege et al, 1998) yielded similar results (ρ=0.36; P<10−153). Although the above analyses used sequence-based estimation of ΔΔG, we repeated them using protein-structure-based estimation of ΔΔG on a subset of yeast proteins whose structures (or homologs’ structures in most cases) have been experimentally determined (see Materials and methods). Although the sample size is reduced, the obtained results are similar (Supplementary Figure S6).
Figure 4.

Codons minimizing the probability of protein misfolding are used more frequently in highly expressed yeast genes than in lowly expressed genes. (A) An example showing the relative protein misfolding probability (pmisfold) of the yeast gene YDR071C (encoding polyamine acetyltransferase) and those of its 60 mutants that each have the 164th codon of the gene replaced by one of the other 60 sense codons. Note that pmisfold is the misfolding probability of a mutant gene relative to that of the wild-type gene. The wild-type codon at this position is marked in blue. Bars are boxed for preferred synonymous codons and unboxed for unpreferred synonymous codons of each amino acid. The inset is an enlarged figure that better shows small differences in pmisfold among some synonymous mutants. (B) The fraction (fmatching codon) of wild-type codons that match the codons with the smallest pmisfold is positively correlated with protein expression level. (C) The fraction (fmatching aa) of wild-type amino acids that match the amino acids encoded by the codons with the smallest pmisfold is positively correlated with protein expression level. In both B and C, genes are separated into 10 equal-size bins. The expression ranges of the 10 bins are [49.2, 358], (358, 688], (688, 1140], (1140, 1630], (1630, 2250], (2250, 3130], (3130, 4870], (4870, 7720], (7720, 18 000], and (18 000, 1 260 000], respectively. Error bars indicate standard errors. Correlations and P-values are estimated from unbinned data, using Spearman's rank correlation tests. (D) Comparison of fmatching codon between paralogous genes in yeast. Red dots show gene pairs with at least a 20-fold expression difference, whereas gray dots show gene pairs with a <20-fold expression difference. There are significantly more red dots above the diagonal line than expected by chance (P=3.72 × 10⁻³, binomial test). (E) Comparison of fmatching aa between paralogous genes in yeast. Colors have the same meanings as in D. There are significantly more red dots over the diagonal line than expected by chance (P=0.0357, binomial test).
In calculating pmisfold, we assumed that the mistranslation rates of preferred synonymous codons are one-fifth that of unpreferred synonymous codons (Figure 4A). Because preferred codons appear more frequently in highly expressed genes than in lowly expressed genes (Hershberg and Petrov, 2008), fmatching codon may be greater in more highly expressed genes even without the selection against protein misfolding. To examine whether factors other than synonymous codon usage bias also contribute to the correlation between fmatching codon and gene expression level, we define amino-acid residues in wild-type proteins as matching residues if they match the amino acids encoded by the codons with the smallest pmisfold. We calculated the fraction of such matching amino-acid residues (fmatching aa) in each wild-type protein. Because different synonymous versions of a gene have the same fmatching aa, it is not influenced by synonymous codon usage bias. We found a significant correlation between fmatching aa and the gene expression level, measured at either the protein (ρ=0.074; P<10−5; Figure 4C) or mRNA (ρ=0.044; P<0.002) level. Thus, compared with lowly expressed proteins, highly expressed ones use not only more preferred codons to reduce mistranslation but also more misfolding-minimizing amino-acid residues. Because gene expression level correlates with fmatching codon much better than with fmatching aa, the majority of the covariance between expression level and fmatching codon is due to codon usage bias. Although biased synonymous codon usage results, at least in part, from the selection against protein misfolding, it may also have other causes (see Discussion). Thus, part of the covariance between expression and fmatching codon may be due to factors unrelated to misfolding avoidance. Consequently, our results do not imply that misfolding avoidance primarily results in the use of preferred synonymous codons rather than preferred amino acids.
It has been reported that amino acids that are more costly to synthesize are used less frequently in highly abundant proteins than in lowly expressed proteins (Akashi and Gojobori, 2002). This biased amino-acid usage potentially affects fmatching aa and thus needs to be controlled. Using previously published amino-acid synthesis cost data (Wagner, 2005), we calculated the mean energy cost per amino-acid residue for each yeast gene. A positive correlation between fmatching aa and the energy cost is found under both respiratory (ρ=0.42; P<10−160) and fermentative (ρ=0.095; P<10−8) conditions, suggesting that the underuse of costly amino acids in highly abundant proteins might have weakened the positive correlation between fmatching aa and expression level. Indeed, a higher correlation between fmatching aa and expression level was found after the energy cost of amino acids was controlled (respiratory condition: ρ=0.114; P<10−11; fermentative condition: ρ=0.0899; P<10−7; partial correlation).
In all of the above analyses, we assumed that proteins of different expression levels are comparable, which may not be true if proteins of different expression levels represent vastly different structures or functional categories. A better comparison would be between paralogous proteins that have different expression levels, because paralogous proteins originate from the same ancestral protein through gene duplication and thus usually belong to the same functional categories and have similar structures (Zhang, 2003). We examined 308 pairs of yeast paralogous genes to test whether the more abundant protein of a duplicate pair tends to have a higher fmatching codon than that of the less abundant protein. We found that this is true for 51.6% of duplicate pairs (all dots in Figure 4D), not significantly greater than 50% (P=0.61; binomial test). However, when a subset of duplicates, in which the expression ratio of the two paralogs exceeds 20, is examined (red dots in Figure 4D), this fraction increases to 78.6%, significantly greater than 50% (P=0.0037). Similarly, when all duplicate pairs are examined, 45.5% show a higher fmatching aa for the more abundant paralog of the pair (P=0.12; all dots in Figure 4E). However, when only those pairs with an expression ratio exceeding 20 are examined, this proportion increases to 71.4% (P=0.036; red dots in Figure 4E). These results are conservative, because the control for amino-acid synthesis cost would improve the correlations. Thus, our findings from duplicates further support the second prediction of the protein-misfolding-avoidance hypothesis that codons and amino acids that minimize protein misfolding are preferentially used in highly expressed genes.
To test the third prediction of our hypothesis, let us first define the mutational sensitivity of a codon by the increase in protein misfolding probability caused by a random nonsynonymous mutation in that codon. The third prediction can be rephrased as a stronger evolutionary conservation of amino-acid residues encoded by more sensitive codons than those encoded by less sensitive ones in the same gene. We measure the mutational sensitivity of a focal codon by averaging pmisfold of all one-nucleotide nonsynonymous neighbors of the focal codon (Figure 5A) and do so for all codons of all yeast genes. By comparing orthologous proteins of S. cerevisiae and its sister species S. paradoxus, we identified conserved amino-acid positions and varied positions in each protein. In each S. cerevisiae protein, we then calculate the mean codon sensitivity at conserved positions (Sconserved) and at varied positions (Svaried). Consistent with our prediction, significantly more proteins show Sconserved>Svaried (60.4%) than the opposite (39.6%) (P<10−42; binomial test) and the proportion of proteins showing Sconserved>Svaried increases with expression level (ρ=0.299; P=0.003; Figure 5B). We also calculated Sconserved/Svaried for each gene and found a positive correlation between the expression level and Sconserved/Svaried (ρ=0.134; P<10−12) (Figure 5C).
Figure 5.

Evolutionary conservation of amino acid residues correlates with the mutational sensitivity to misfolding. Proteins with at least three varied sites are considered. (A) An example (codon no. 58 of YAL001C) showing the measurement of the mutational sensitivity (S) of a codon, which is defined by the mean pmisfold of its one nonsynonymous mutation neighbors indicated by the dotted red line. Here, pmisfold is the protein misfolding probability of a mutant relative to that of the wild-type gene. The nucleotide differences from the wild-type as well as the altered amino acids are colored in red. (B) Fraction of genes with Sconserved>Svaried increases significantly with expression level. Here, Sconserved and Svaried are the mean S-values for codons with conserved and varied amino acids between S. cerevisiae and S. paradoxus orthologs, respectively. The genes are grouped into 100 equal-size bins according to the yeast protein expression level. (C) The ratio of Sconserved and Svaried within a gene is positively correlated with its expression level. In B and C, correlation coefficients and significance levels are determined by Spearman's rank correlation tests.
In the above analyses, we defined the mutational sensitivity of a codon by averaging pmisfold of all one-nucleotide nonsynonymous neighbors of the focal codon (Figure 5A). One may argue that a better measure of sensitivity is the minimal pmisfold of all one-nucleotide nonsynonymous neighbors of the focal codon (Supplementary Figure S7A), because an amino-acid residue does not need to be conserved when the minimal pmisfold is low. Indeed, using this modified definition of sensitivity, we were able to repeat the results of Figure 5, and the new correlations are slightly stronger than those of Figure 5 (Supplementary Figure S7).
Taken together, our tests of the three predictions offer the strongest empirical evidence thus far for the role of protein-misfolding-avoidance in generating the E–R anticorrelation.
Discussion
The strong anticorrelation between the expression level of a protein and its rate of sequence evolution (Pal et al, 2001) is one of the most surprising and puzzling findings of molecular evolution in the postgenomic era. The innovative proposal of the translational robustness hypothesis (Drummond et al, 2005) offers a plausible explanation for this anticorrelation and provides an entirely new perspective on the previously unrecognized impact of protein mistranslation and protein misfolding on protein sequence evolution. In this work, we demonstrated by theoretical calculation and computer simulation that error-free misfolding is a non-negligible source of protein misfolding and that selection against misfolding is more effective in reducing error-free misfolding than error-induced misfolding. We suggest that the overarching protein-misfolding-avoidance hypothesis that considers both sources of protein misfolding is superior to the translational robustness hypothesis for explaining the E–R anticorrelation.
In estimating the percentage of misfolded molecules, we and previous authors (Drummond and Wilke, 2008) both assumed thermodynamic equilibrium of protein unfolding in vivo. In reality, however, some proteins retain their functional conformation through kinetic stability instead of thermodynamic stability (Sanchez-Ruiz, 2010). Nevertheless, thermodynamic stability can often translate directly to kinetic stability (Parsell and Sauer, 1989; Sanchez-Ruiz, 2010), although this fact does not necessarily mean that most proteins are in thermodynamic equilibrium in vivo. A recent proteomic-scale analysis of kinetic stability revealed that only 5.6% of 900 examined proteins are kinetically stable (Xia et al, 2007), but the false-negative rate may be non-negligible. Thus, although the assumption of thermodynamic equilibrium is likely appropriate for most proteins, we do not know accurately the proportion of proteins under thermodynamic equilibrium. When the activation free energy is known for many proteins, kinetic stability can also be included in the consideration of protein misfolding using a formula similar to Equation (3).
In addition to generating the E–R anticorrelation, it was previously shown that the translational robustness hypothesis can also explain the phenomenon of stronger synonymous codon usage biases of highly expressed genes than lowly expressed genes, under the assumption that unpreferred codons have higher mistranslation rates than preferred codons (Drummond and Wilke, 2008). Because the overarching protein-misfolding-avoidance hypothesis includes minimizing mistranslation-induced misfolding, we predicted that this hypothesis can also explain the codon usage bias, and confirmed it in our molecular-level evolutionary simulation (Supplementary Figure S8). Interestingly, however, the correlation between the gene expression level and the fraction of preferred codons (Fop) in the gene is weaker under the overarching hypothesis (ρ=0.63; P<10−56; Supplementary Figure S8B) than under the translational robustness hypothesis (ρ=0.77; P<10−97; Supplementary Figure S8A). Furthermore, Fop in very highly expressed genes is lower under the overarching hypothesis (∼0.55) than under the translational robustness hypothesis (∼0.85) (Supplementary Figure S8). These findings are not unexpected, because the relative importance of using preferred codons to minimize protein misfolding is decreased in the presence of error-free misfolding. Because error-free misfolding exists in reality, our results suggest that the power of misfolding avoidance in explaining codon usage bias was likely slightly overestimated in the previous study (Drummond and Wilke, 2008). It is worth noting that the strongest observed correlation between gene expression level and Fop of any species is between 0.5 and 0.6, in yeast and nematode (Drummond and Wilke, 2008). Thus, the simulation with both sources of misfolding produced results that are more similar to the empirical observation than the simulation with error-induced misfolding only. This said, we caution that owing to many simplifying assumptions made in the simulation, the quantitative results from the simulation may not be directly comparable with empirical observations. In this context, a recent empirical study provided strong evidence for the role of protein-misfolding-avoidance in generating codon usage bias. It was shown that, within a protein, preferred codons tend to be used at residues in which a random amino-acid change would substantially decrease the unfolding energy of the protein (Zhou et al, 2009). Furthermore, the finding that evolutionary conserved amino-acid residues tend to be encoded by preferred codons is also consistent with the hypothesis that preferred codons are used to minimize mistranslation-induced misfolding (Akashi, 1994; Stoletzki and Eyre-Walker, 2007; Drummond and Wilke, 2008). However, it remains possible that protein-misfolding-avoidance is not the sole or even the major cause of codon usage bias (Kudla et al, 2009).
In this work, we provided empirical evidence for three key predictions of the overarching protein-misfolding-avoidance hypothesis of the E–R anticorrelation. Two of our tests rely heavily on the computational prediction of ΔΔG by I-mutant2.0 (Capriotti et al, 2005), a support-vector-machine-based method trained by experimental data (Bava et al, 2004). Although it has been shown that the correlation between the predicted ΔΔG values of this method and experimentally determined values are satisfactorily high (0.62 for sequence-based prediction and 0.71 for structure-based prediction) (Capriotti et al, 2005), prediction errors are inevitable. Nonetheless, random prediction errors cannot generate the patterns observed in Figures 4 and 5. Rather, random prediction errors likely have weakened the signals of protein-misfolding-avoidance. Thus, the true signals of the selection against protein misfolding may be stronger than that presented in Figures 4 and 5.
It is important to emphasize that the predictions of the overarching protein-misfolding-avoidance hypothesis tested here can also be made from the translational robustness hypothesis, because of the similarity in the consequences of selection against the two types of misfolding. Our tests are not intended to differentiate between these two hypotheses, as it is clear that the overarching hypothesis is both more inclusive and more accurate than the translational robustness hypothesis. One of the rationales behind the initial proposal of the translational robustness hypothesis was the observation that the rate of protein sequence evolution negatively correlates with the amount of mRNA (and by inference the amount of translation) slightly better than with the amount of protein (Drummond et al, 2005). Similar to the amount of error-induced misfolding, the amount of error-free misfolding is also expected to be proportional to the number of protein molecules synthesized, which is equivalent to the amount of translation. However, protein concentrations and mRNA concentrations are highly correlated (Ghaemmaghami et al, 2003), and the small difference between their correlations with the rate of protein evolution is probably attributable to a larger measurement error of protein concentrations than that of mRNA concentrations (Lu et al, 2007).
Besides the evidence we provided for protein-misfolding-avoidance, the hypothesis is also supported by several other pieces of evidence from empirical data, although many of them are only circumstantial and are not predicted exclusively by protein-misfolding-avoidance. First, a recent study showed that highly expressed and slowly evolving proteins share compositional properties with thermophilic proteins (Cherry, 2010). Because, at the same temperature, thermophilic proteins tend to be more stable (i.e., having higher ΔG) than mesophilic proteins, this finding is consistent with the first prediction of the protein-misfolding-avoidance hypothesis that highly expressed proteins are more stable than lowly expressed ones. Second, misfolding may be prevented or remedied by chaperoning processes. Consistent with our hypothesis, overexpression of the chaperonin GroEL in Escherichia coli, which enhances chaperoning, leads to faster sequence evolution of target proteins (Tokuriki and Tawfik, 2009). Third, it was recently reported that sporadic targets of the E. coli chaperonin GroEL use preferred synonymous codons more frequently than obligate targets of GroEL (Warnecke and Hurst, 2010). This phenomenon can be explained by decreased pressures for using preferred codons to reduce mistranslation of the obligate targets of GroEL (Warnecke and Hurst, 2010). Fourth, the protein-misfolding-avoidance hypothesis predicts that, within multidomain proteins, different domains, on average, should evolve at substantially closer rates than the same domains in different proteins. Substantial homogenization of evolutionary rates in multidomain proteins was observed in both animals and plants, although highly significant differences between domain-specific rates remained (Wolf et al, 2008). Fifth, a recent study showed that a universal pattern of the evolutionary rate variation among different proteins of the same organism can be explained by the physics of protein folding (Lobkovsky et al, 2010). Despite the existence of substantial circumstantial and direct evidence for the role of selection against protein misfolding in shaping protein evolution, one crucial piece of evidence is still lacking. That is, the quantitative level of the generic toxicity of protein misfolding is unknown. Without such information, it is difficult to quantify precisely the impact of protein-misfolding-avoidance in protein evolution.
It is important to note that, although the gene expression level appears to be the major determinant of protein evolutionary rate in some species such as bacteria and yeast (Rocha and Danchin, 2004; Drummond et al, 2006), it does not seem to be so in some other species. For example, gene expression level is not as important as gene essentiality, gene structure, and protein subcellular localization in determining the mammalian protein evolutionary rate (Liao et al, 2006, 2010). A recent analysis of nematode and fruit fly proteomic data also suggested that translation-independent factors are more important rate determinants than translation-dependent factors (Wolf et al, 2010). The same study also proposed a deleterious effect of error-free protein misfolding caused by the loss of functional molecules, rather than the generic toxicity of protein misfolding, as proposed in the translational robustness hypothesis and in the protein-misfolding-avoidance hypothesis. The consequences of the two types of selection are very different. For example, under the proposal by Wolf et al (2010), fitness is increased when the gene expression level is enhanced. Under our hypothesis, an increase of expression level decreases fitness because of the production of more misfolded molecules. In the future, it will be important to explore the reasons of protein-misfolding-avoidance and study whether and why it is more important to certain organisms than others.
Materials and methods
Genomic data and comparative analysis
Protein and DNA sequences of S. cerevisiae were downloaded from the Saccharomyces Genome Database (Engel et al, 2010). Energy costs for amino-acid biosynthesis in yeast during respiratory and fermentative conditions were previously reported (Wagner, 2005). S. paradoxus orthologs of S. cerevisiae genes, as well as their sequences, were extracted from Fungal Orthogroups Repository (Wapinski et al, 2007). Paralogous S. cerevisiae genes and their alignments were obtained from a previous study (Wang and Zhang, 2009). We used microarray-based measurements of S. cerevisiae mRNA expression levels (Holstege et al, 1998) and immunodetection-based measurements of protein expression levels (Ghaemmaghami et al, 2003). The numbers of nonsynonymous substitutions per nonsynonymous site (dN) between S. cerevisiae and S. paradoxus orthologs were estimated using a maximum-likelihood method implemented in PAML (Yang, 2007). When protein structures were used for ΔΔG prediction, each yeast protein was BLASTed against all PDB entries (Berman et al, 2000) using an E-value cutoff of 10−6. The best-hit PDB entry was used as the native structure if >80% of the yeast protein could be aligned to it and the sequence identity of the aligned region was at least 40%.
Molecular-level evolutionary simulations
Following a recent study (Drummond and Wilke, 2008), we implemented a lattice-based protein structure model (Taverna and Goldstein, 2002a, 2002b). First, a randomly generated 75-nucleotide DNA sequence that has an open reading frame starting with ATG was translated into protein. We then folded the protein sequence following a 5 × 5 lattice model, with each amino acid occupying one point in the lattice. Folding energy of any given structure was the sum of the contact energies of adjacent residues (Miyazawa and Jernigan, 1985). Among all 1081 possible conformations of a protein, the one with the largest unfolding energy was defined as the native structure, and all other 1080 structures were treated as misfolded. The stability of the protein was then calculated by
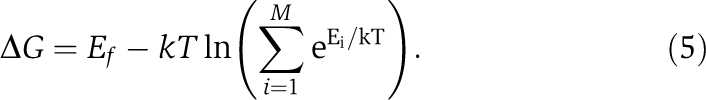 |
Here, k=1.986 cal/mol/K, T=302 K, Ef is the unfolding energy of the native structure, Ei is the unfolding energy of the ith misfolded structure, and M is the total number of misfolded structures (Wilke, 2004). In the simulation, a certain ΔGmin was set, and only wild-type sequences with ΔG>ΔGmin are considered as functional genes. We used ΔGmin=0 and generated 500 random sequences to represent 500 genes. The native protein structure for a gene was fixed during subsequent evolution. For any protein sequence of that gene that appears in evolution or after translation, its misfolding probability was calculated using Equation (1), where ΔG was the unfolding energy of the specific protein sequence in the fixed native protein structure for the gene. Errors were introduced in translation such that on average 20% of protein molecules each contain one error when synonymous codons are equally frequent. In terms of mistranslation patterns, we extrapolated relative probabilities of nine possible single-nucleotide translational errors for each codon, following empirical spectrum of translational errors (Freeland and Hurst, 1998). For each amino acid with multiple synonymous codons, we designated preferred codons and unpreferred codons based on empirical observations in yeast. The translational error rate of a preferred codon was assumed to be one-fifth that of an unpreferred codon. We assigned a per-cell expression level (ranging from 10 to 300 000 protein molecules) to each of these genes. The actual expression levels were adjusted such that the numbers of correctly folded molecules met the above assigned levels. Second, in silico evolution of a population of 1000 haploid unicellular organisms was carried out to study the evolution of each of the 500 genes. Each sequence evolves with a mutation rate of 10−5 per nucleotide site per generation. Genetic drift and natural selection were then simulated. The probability of reproduction was proportional to the fitness of the sequence, which was determined by
where c=0.0001 and m is the number of misfolded molecules (Drummond and Wilke, 2008). The evolutionary process was repeated for 100 000 generations to allow ΔG to reach equilibrium. Third, we further evolve the population for another 50 000 generations to calculate the number of amino-acid substitutions fixed in the entire population per sequence during these 50 000 generations.
To compare the relative contributions of error-free and error-induced misfolding with the anticorrelation between the expression level and evolutionary rate, we conducted three simulations. In the first simulation, we assumed that all error-free molecules fold correctly. In the second simulation, we assumed no mistranslation. In the last simulation, we considered both error-free and error-induced misfolding. To examine the robustness of our simulation results, we repeated the simulations with different parameters. Briefly, we respectively modified the mistranslation rate ratio between preferred and unpreferred codons to either 0.5 or 0.1, used proteins of 16 amino acids (4 × 4 lattice), and increased ΔGmin to 1 kcal/mol in four additional sets of simulations. We were not able to examine proteins longer than 25 amino acids because of the exponential increase in the number of possible protein conformations and thus computational time with protein length.
Experimentally measured ΔG and Tm
Experimentally measured unfolding energy (ΔG) values of yeast wild-type proteins were extracted from ProTherm (Bava et al, 2004). We removed prions and considered only the ΔG values obtained in the absence of denaturants (termed ΔGH2O in ProTherm). From the various conditions under which ΔG was measured, we chose those that are closest to pH 7 (>7 is preferred over <7) and 25°C for each protein. For a protein, if there are multiple ΔG measures under these criteria, they were averaged to obtain a single ΔG value.
Protein aggregation propensity
Aggregation propensities of yeast wild-type proteins were computationally estimated by TANGO (Fernandez-Escamilla et al, 2004) and were compared as in a previous study (Chen and Dokholyan, 2008). We also repeated the above analysis using aggregation propensities predicted by AGGRESCAN (Conchillo-Sole et al, 2007; de Groot and Ventura, 2010).
Misfolding probabilities of wild-type and mutant yeast proteins
The total protein misfolding probability for a wild-type yeast gene, Pmisfold(wt), is the sum of the probability of error-free misfolding, PEF(wt), and that of error-induced misfolding, PEI(wt). According to Equations (3 and 4),
and
 |
Here, q is the probability that a protein molecule contains no translational error, hi is the probability of the ith possible translational error in the protein, ΔG is the unfolding energy of the wild-type error-free protein (which is always positive), and ΔΔGi is the increase in unfolding energy caused by the ith translational error (which is usually negative). Note that in Equation (8), we assumed that the increase in the unfolding energy of a molecule caused by two amino-acid changes equals the sum of the increases caused by each change. Combining Equations (7 and 8), we have
 |
Now, let us consider a mutant gene that differs from the wild-type in one codon and denote the increase in unfolding energy of the protein caused by this single codon replacement by ΔΔGmt. Thus, the total protein misfolding probability for this mutant gene is
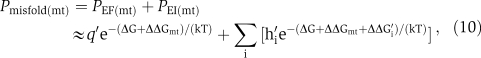 |
where q′ is the probability that a mutant protein molecule contains no translational error, h′i is the probability of the ith possible translational error in the mutant protein, and ΔΔG′i is the increase in unfolding energy caused by the ith translational error in the mutant protein. The approximation sign reflects the fact that the total increase in unfolding energy caused by the codon replacement and a translational error is approximately the sum of the individual increases of the unfolding energy. Now let us define the relative misfolding probability of the mutant gene by
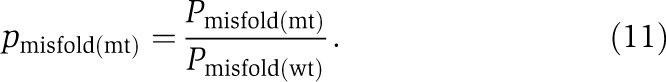 |
It can be shown that
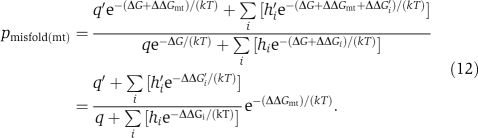 |
Note the disappearance of ΔG, which is usually unknown, from Equation (12). To use Equation (12), we estimated ΔΔGmt, ΔΔGi, and ΔΔG′i by sequence-based I-mutant (Capriotti et al, 2005) predictions and estimated the translational error rates as follows. Based on (i) the actual codon usage patterns in 3790 yeast genes weighted by protein expression levels (Ghaemmaghami et al, 2003), (ii) the empirical mistranslation patterns previously reported (Freeland and Hurst, 1998), (iii) the assumption that a preferred codon has a per-codon mistranslation rate that is one-fifth that of an unpreferred codon (Drummond and Wilke, 2008), and (iv) the average translational error rate of 5 × 10⁻⁴ per codon (Drummond and Wilke, 2008, 2009), we determined the probability that a codon is translated correctly and the probabilities that it is mistranslated into each of the other 19 amino acids. The hi and h′i values in Equation (12) were simply these mistranslation probabilities, and the q and q′ values were the product of the probability of correct translation of every codon for all codons of the wild-type and mutant genes, respectively. The matrix of 61 sense codons × 20 amino acids is presented in Supplementary Table S1. Note that mistranslation of a sense codon to a stop codon was not considered because of the difficulty in calculating the misfolding probabilities of truncated proteins. We thus calculated the pmisfold for all possible single-codon-replacement mutants of each yeast protein using Equation (12) and set the pmisfold of each wild-type gene at 1.
For a subset of yeast proteins with structural information or the structural information of their homologs, we also estimated ΔΔGmt, ΔΔGi, and ΔΔG′i by structure-based I-mutant predictions. Here, if a native residue in the PDB record is different from that in the wild-type yeast sequence, we set the ΔΔG of the yeast wild-type residue as 0 and change the ΔΔG of other mutants at this position accordingly.
Mutational sensitivity of a codon
Mutational sensitivity of a codon in a wild-type yeast gene is calculated by averaging pmisfold of all possible mutants that each contain one nonsynonymous nucleotide mutation in this codon. Because the wild type has a pmisfold of 1, the mutational sensitivity of a codon measures the expected misfolding probability after a random nonsynonymous mutation in the codon, relative to the wild type. For simplicity, we assumed that all single-nucleotide nonsynonymous changes in a codon have equal mutation rates.
Supplementary Material
Supplementary Table S1, Supplementary Fig. S1–8
Acknowledgments
We thank Meg Bakewell, Allan Drummond, Wenfeng Qian, Zhi Wang, Claus Wilke, and three anonymous reviewers for their valuable comments. This work was supported by research grants from US National Institutes of Health to JZ. JRY was supported in part by the 985 Project Fund from Sun Yat-sen University and a grant from the Ministry of Science and Technology of China (2010CB912803) to SMZ.
Footnotes
The authors declare that they have no conflict of interest.
References
- Akashi H (1994) Synonymous codon usage in Drosophila melanogaster: natural selection and translational accuracy. Genetics 136: 927–935 [DOI] [PMC free article] [PubMed] [Google Scholar]
- Akashi H, Gojobori T (2002) Metabolic efficiency and amino acid composition in the proteomes of Escherichia coli and Bacillus subtilis. Proc Natl Acad Sci USA 99: 3695–3700 [DOI] [PMC free article] [PubMed] [Google Scholar]
- Bava KA, Gromiha MM, Uedaira H, Kitajima K, Sarai A (2004) ProTherm, version 4.0: thermodynamic database for proteins and mutants. Nucleic Acids Res 32: D120–D121 [DOI] [PMC free article] [PubMed] [Google Scholar]
- Berman HM, Westbrook J, Feng Z, Gilliland G, Bhat TN, Weissig H, Shindyalov IN, Bourne PE (2000) The protein data bank. Nucleic Acids Res 28: 235–242 [DOI] [PMC free article] [PubMed] [Google Scholar]
- Boas FE, Harbury PB (2007) Potential energy functions for protein design. Curr Opin Struct Biol 17: 199–204 [DOI] [PubMed] [Google Scholar]
- Bucciantini M, Giannoni E, Chiti F, Baroni F, Formigli L, Zurdo J, Taddei N, Ramponi G, Dobson CM, Stefani M (2002) Inherent toxicity of aggregates implies a common mechanism for protein misfolding diseases. Nature 416: 507–511 [DOI] [PubMed] [Google Scholar]
- Capriotti E, Fariselli P, Casadio R (2005) I-Mutant2.0: predicting stability changes upon mutation from the protein sequence or structure. Nucleic Acids Res 33: W306–W310 [DOI] [PMC free article] [PubMed] [Google Scholar]
- Chen Y, Dokholyan NV (2008) Natural selection against protein aggregation on self-interacting and essential proteins in yeast, fly, and worm. Mol Biol Evol 25: 1530–1533 [DOI] [PMC free article] [PubMed] [Google Scholar]
- Cherry JL (2010) Highly expressed and slowly evolving proteins share compositional properties with thermophilic proteins. Mol Biol Evol 27: 735–741 [DOI] [PMC free article] [PubMed] [Google Scholar]
- Conchillo-Sole O, de Groot NS, Aviles FX, Vendrell J, Daura X, Ventura S (2007) AGGRESCAN: a server for the prediction and evaluation of “hot spots” of aggregation in polypeptides. BMC Bioinformatics 8: 65. [DOI] [PMC free article] [PubMed] [Google Scholar]
- de Groot NS, Ventura S (2010) Protein aggregation profile of the bacterial cytosol. PLoS One 5: e9383. [DOI] [PMC free article] [PubMed] [Google Scholar]
- Dill KA, Ozkan SB, Shell MS, Weikl TR (2008) The protein folding problem. Annu Rev Biophys 37: 289–316 [DOI] [PMC free article] [PubMed] [Google Scholar]
- Dobson CM (2003) Protein folding and misfolding. Nature 426: 884–890 [DOI] [PubMed] [Google Scholar]
- Drummond DA, Bloom JD, Adami C, Wilke CO, Arnold FH (2005) Why highly expressed proteins evolve slowly. Proc Natl Acad Sci USA 102: 14338–14343 [DOI] [PMC free article] [PubMed] [Google Scholar]
- Drummond DA, Raval A, Wilke CO (2006) A single determinant dominates the rate of yeast protein evolution. Mol Biol Evol 23: 327–337 [DOI] [PubMed] [Google Scholar]
- Drummond DA, Wilke CO (2008) Mistranslation-induced protein misfolding as a dominant constraint on coding-sequence evolution. Cell 134: 341–352 [DOI] [PMC free article] [PubMed] [Google Scholar]
- Drummond DA, Wilke CO (2009) The evolutionary consequences of erroneous protein synthesis. Nat Rev Genet 10: 715–724 [DOI] [PMC free article] [PubMed] [Google Scholar]
- Engel SR, Balakrishnan R, Binkley G, Christie KR, Costanzo MC, Dwight SS, Fisk DG, Hirschman JE, Hitz BC, Hong EL, Krieger CJ, Livstone MS, Miyasato SR, Nash R, Oughtred R, Park J, Skrzypek MS, Weng S, Wong ED, Dolinski K et al. (2010) Saccharomyces Genome Database provides mutant phenotype data. Nucleic Acids Res 38: D433–D436 [DOI] [PMC free article] [PubMed] [Google Scholar]
- Fernandez-Escamilla AM, Rousseau F, Schymkowitz J, Serrano L (2004) Prediction of sequence-dependent and mutational effects on the aggregation of peptides and proteins. Nat Biotechnol 22: 1302–1306 [DOI] [PubMed] [Google Scholar]
- Fraser HB, Hirsh AE, Steinmetz LM, Scharfe C, Feldman MW (2002) Evolutionary rate in the protein interaction network. Science 296: 750–752 [DOI] [PubMed] [Google Scholar]
- Freeland SJ, Hurst LD (1998) The genetic code is one in a million. J Mol Evol 47: 238–248 [DOI] [PubMed] [Google Scholar]
- Ghaemmaghami S, Huh WK, Bower K, Howson RW, Belle A, Dephoure N, O’Shea EK, Weissman JS (2003) Global analysis of protein expression in yeast. Nature 425: 737–741 [DOI] [PubMed] [Google Scholar]
- Hershberg R, Petrov DA (2008) Selection on codon bias. Annu Rev Genet 42: 287–299 [DOI] [PubMed] [Google Scholar]
- Hirsh AE, Fraser HB (2001) Protein dispensability and rate of evolution. Nature 411: 1046–1049 [DOI] [PubMed] [Google Scholar]
- Holstege FC, Jennings EG, Wyrick JJ, Lee TI, Hengartner CJ, Green MR, Golub TR, Lander ES, Young RA (1998) Dissecting the regulatory circuitry of a eukaryotic genome. Cell 95: 717–728 [DOI] [PubMed] [Google Scholar]
- Hurst LD, Smith NG (1999) Do essential genes evolve slowly? Curr Biol 9: 747–750 [DOI] [PubMed] [Google Scholar]
- Jordan IK, Wolf YI, Koonin EV (2003) No simple dependence between protein evolution rate and the number of protein-protein interactions: only the most prolific interactors tend to evolve slowly. BMC Evol Biol 3: 1. [DOI] [PMC free article] [PubMed] [Google Scholar]
- Kimura M (1968) Evolutionary rate at the molecular level. Nature 217: 624–626 [DOI] [PubMed] [Google Scholar]
- Kimura M (1983) The Neutral Theory of Molecular Evolution. Cambridge: Cambridge University Press [Google Scholar]
- Kimura M, Ohta T (1974) On some principles governing molecular evolution. Proc Natl Acad Sci USA 71: 2848–2852 [DOI] [PMC free article] [PubMed] [Google Scholar]
- King JL, Jukes TH (1969) Non-Darwinian evolution. Science 164: 788–798 [DOI] [PubMed] [Google Scholar]
- King MC, Wilson AC (1975) Evolution at two levels in humans and chimpanzees. Science 188: 107–116 [DOI] [PubMed] [Google Scholar]
- Koonin E, Galperin M (2003) Sequence—Evolution—Function: Computational Approaches in Comparative Genomics. Boston: Kluwer Academic Publishers [PubMed] [Google Scholar]
- Koonin EV (2005) Systemic determinants of gene evolution and function. Mol Syst Biol 1: 2005.0021. [DOI] [PMC free article] [PubMed] [Google Scholar]
- Kudla G, Murray AW, Tollervey D, Plotkin JB (2009) Coding-sequence determinants of gene expression in Escherichia coli. Science 324: 255–258 [DOI] [PMC free article] [PubMed] [Google Scholar]
- Li W (1997) Molecular Evolution. Sunderland, Mass: Sinauer [Google Scholar]
- Liao BY, Scott NM, Zhang J (2006) Impacts of gene essentiality, expression pattern, and gene compactness on the evolutionary rate of mammalian proteins. Mol Biol Evol 23: 2072–2080 [DOI] [PubMed] [Google Scholar]
- Liao BY, Weng MP, Zhang J (2010) Impact of extracellularity on the evolutionary rate of Mammalian proteins. Genome Biol Evol 2010: 39–43 [DOI] [PMC free article] [PubMed] [Google Scholar]
- Lobkovsky AE, Wolf YI, Koonin EV (2010) Universal distribution of protein evolution rates as a consequence of protein folding physics. Proc Natl Acad Sci USA 107: 2983–2988 [DOI] [PMC free article] [PubMed] [Google Scholar]
- Lu P, Vogel C, Wang R, Yao X, Marcotte EM (2007) Absolute protein expression profiling estimates the relative contributions of transcriptional and translational regulation. Nat Biotechnol 25: 117–124 [DOI] [PubMed] [Google Scholar]
- Miyazawa S, Jernigan R (1985) Estimation of effective interresidue contact energies from protein crystal structures: quasi-chemical approximation. Macromolecules 18: 534–552 [Google Scholar]
- Nei M (1987) Molecular Evolutionary Genetics. New York: Columbia University Press [Google Scholar]
- Nei M, Kumar S (2000) Molecular Evolution and Phylogenetics. New York: Oxford University Press [Google Scholar]
- Page R, Holmes E (1998) Molecular Evolution: A Phylogenetic Approach. Oxford, UK: Blackwell Science Ltd [Google Scholar]
- Pakula AA, Sauer RT (1989) Genetic analysis of protein stability and function. Annu Rev Genet 23: 289–310 [DOI] [PubMed] [Google Scholar]
- Pal C, Papp B, Hurst LD (2001) Highly expressed genes in yeast evolve slowly. Genetics 158: 927–931 [DOI] [PMC free article] [PubMed] [Google Scholar]
- Parsell DA, Sauer RT (1989) The structural stability of a protein is an important determinant of its proteolytic susceptibility in Escherichia coli. J Biol Chem 264: 7590–7595 [PubMed] [Google Scholar]
- Rocha EP, Danchin A (2004) An analysis of determinants of amino acids substitution rates in bacterial proteins. Mol Biol Evol 21: 108–116 [DOI] [PubMed] [Google Scholar]
- Sanchez-Ruiz JM (2010) Protein kinetic stability. Biophys Chem 148: 1–15 [DOI] [PubMed] [Google Scholar]
- Schroder M, Kaufman RJ (2005) The mammalian unfolded protein response. Annu Rev Biochem 74: 739–789 [DOI] [PubMed] [Google Scholar]
- Stoletzki N, Eyre-Walker A (2007) Synonymous codon usage in Escherichia coli: selection for translational accuracy. Mol Biol Evol 24: 374–381 [DOI] [PubMed] [Google Scholar]
- Subramanian S, Kumar S (2004) Gene expression intensity shapes evolutionary rates of the proteins encoded by the vertebrate genome. Genetics 168: 373–381 [DOI] [PMC free article] [PubMed] [Google Scholar]
- Tartaglia GG, Pechmann S, Dobson CM, Vendruscolo M (2007) Life on the edge: a link between gene expression levels and aggregation rates of human proteins. Trends Biochem Sci 32: 204–206 [DOI] [PubMed] [Google Scholar]
- Taverna DM, Goldstein RA (2002a) Why are proteins marginally stable? Proteins 46: 105–109 [DOI] [PubMed] [Google Scholar]
- Taverna DM, Goldstein RA (2002b) Why are proteins so robust to site mutations? J Mol Biol 315: 479–484 [DOI] [PubMed] [Google Scholar]
- Tokuriki N, Tawfik DS (2009) Chaperonin overexpression promotes genetic variation and enzyme evolution. Nature 459: 668–673 [DOI] [PubMed] [Google Scholar]
- Wagner A (2005) Energy constraints on the evolution of gene expression. Mol Biol Evol 22: 1365–1374 [DOI] [PubMed] [Google Scholar]
- Wall DP, Hirsh AE, Fraser HB, Kumm J, Giaever G, Eisen MB, Feldman MW (2005) Functional genomic analysis of the rates of protein evolution. Proc Natl Acad Sci USA 102: 5483–5488 [DOI] [PMC free article] [PubMed] [Google Scholar]
- Wang Z, Zhang J (2009) Why is the correlation between gene importance and gene evolutionary rate so weak? PLoS Genet 5: e1000329. [DOI] [PMC free article] [PubMed] [Google Scholar]
- Wapinski I, Pfeffer A, Friedman N, Regev A (2007) Natural history and evolutionary principles of gene duplication in fungi. Nature 449: 54–61 [DOI] [PubMed] [Google Scholar]
- Warnecke T, Hurst LD (2010) GroEL dependency affects codon usage--support for a critical role of misfolding in gene evolution. Mol Syst Biol 6: 340. [DOI] [PMC free article] [PubMed] [Google Scholar]
- Wilke CO (2004) Molecular clock in neutral protein evolution. BMC Genet 5: 25. [DOI] [PMC free article] [PubMed] [Google Scholar]
- Wolf MY, Wolf YI, Koonin EV (2008) Comparable contributions of structural-functional constraints and expression level to the rate of protein sequence evolution. Biol Direct 3: 40. [DOI] [PMC free article] [PubMed] [Google Scholar]
- Wolf YI, Carmel L, Koonin EV (2006) Unifying measures of gene function and evolution. Proc Biol Sci 273: 1507–1515 [DOI] [PMC free article] [PubMed] [Google Scholar]
- Wolf YI, Gopich IV, Lipman DJ, Koonin EV (2010) Relative contributions of intrinsic structural-functional constraints and translation rate to the evolution of protein-coding genes. Genome Biol Evol 2: 190–199 [DOI] [PMC free article] [PubMed] [Google Scholar]
- Xia K, Manning M, Hesham H, Lin Q, Bystroff C, Colon W (2007) Identifying the subproteome of kinetically stable proteins via diagonal 2D SDS/PAGE. Proc Natl Acad Sci USA 104: 17329–17334 [DOI] [PMC free article] [PubMed] [Google Scholar]
- Yang Z (2007) PAML 4: phylogenetic analysis by maximum likelihood. Mol Biol Evol 24: 1586–1591 [DOI] [PubMed] [Google Scholar]
- Zhang J (2003) Evolution by gene duplication: an update. Trends Ecol Evol 18: 292–298 [Google Scholar]
- Zhang J, He X (2005) Significant impact of protein dispensability on the instantaneous rate of protein evolution. Mol Biol Evol 22: 1147–1155 [DOI] [PubMed] [Google Scholar]
- Zhang L, Li WH (2004) Mammalian housekeeping genes evolve more slowly than tissue-specific genes. Mol Biol Evol 21: 236–239 [DOI] [PubMed] [Google Scholar]
- Zhou T, Weems M, Wilke CO (2009) Translationally optimal codons associate with structurally sensitive sites in proteins. Mol Biol Evol 26: 1571–1580 [DOI] [PMC free article] [PubMed] [Google Scholar]
- Zukerkandl E, Pauling L (1965) Evolutionary divergence and convergence in proteins. In Evolving Genes and Proteins, Bryson V, Vogel HJ (eds), pp 97–166. New York: Academic Press [Google Scholar]
Associated Data
This section collects any data citations, data availability statements, or supplementary materials included in this article.
Supplementary Materials
Supplementary Table S1, Supplementary Fig. S1–8