Abstract
New paradigms in translational research are focused on deep understanding of all aspects of the human immune system in response to diseases or perturbations such as vaccination or therapy. To obtain this knowledge, coordinated, comprehensive assessments by genomics, proteomics, and cytomics are necessary. One component of this assessment is comprehensive leukocyte immunophenotyping (CLIP) that not only provides a deep and broad description of the entire immune system at any given moment, but also encompasses all leukocyte lineages, including activation states, functional markers, and signaling molecules. As envisioned, a CLIP panel could study nearly 400 antigens utilizing 17-parameter flow cytometry. The CLIP panel is structured in a manner that tubes are grouped by lineage and, within lineage each of the tubes, while having some redundant markers, characterize distinct populations. To date, a preliminary 10 tube CLIP panel has been developed with the following 17 parameter tubes: Treg, Th17, Th1/2, Bgeneral, Bnaive/memory, Bintracellular, NK1, NK2, Myeloid/Monocyte, and Dendritic cells (DC). Together these tubes have the potential to identify over 28,000 subsets of leukocytes. The feasibility of developing these tubes has been demonstrated, as well as their utility in describing complex alterations of the immune system in the context of disease and vaccination. The plethora of data accrued in the preliminary CLIP panel highlights the need for novel data analysis and reduction strategies, while at the same time illustrates the power of CLIP.
Keywords: Leukocytes, immunophenotyping, polychromatic, cytometry, immunome
Introduction
The human immune system is a highly complex, tightly regulated component of the body that is a key player in protection from infectious diseases and foreign antigens. It has a role in virtually every disease of man and dysregulation of this system can have severe consequences not only in terms of infection, but also in the forms of autoimmune disease or cancer. While this system is widely accepted as being highly complex, approaches for its study have historically been very simplistic. Quite often a specific cell type e.g. dendritic cells, B cells, or T regulatory cells) is studied in great detail in the context of one disease or a limited number of diseases, or a very cursory examination is performed of multiple cell types in a similar setting. Studies of the immune system in mice, while at times more comprehensive, have limitations in their applicability to human immunology (Davis, 2008). Thus a new paradigm is beginning to emerge in which a comprehensive, more systems-based approach is used to study human immunology in both its basal state and upon perturbation by disease, therapy, or vaccination.
Comprehensive assessment of the immune system utilizes a multitude of technologies to examine as many facets as possible. Assays for these studies may include gene expression arrays, SNP genotyping, proteomics, ELISPOT assays, serologic studies, a vast assortment of functional assessments, serum cytokine analyses and flow cytometric analysis of a large number of cell surface markers, as well as intracellular antigens. In order to truly provide a comprehensive, detailed view of the immune system in toto, the flow cytometry assays must be far more in depth and comprehensive than any previously attempted, spanning all lineages but at the same time providing detailed information regarding all known leukocyte subsets. Previous approaches to immunophenotyping have selected either depth (detailed immunophenotyping of a single lineage or subset) or breadth (immunophenotyping of multiple lineages without significant depth), whereas the current approach seeks both depth and breadth. We term this comprehensive leukocyte immunophenotyping (CLIP). This comprehensive approach for immunophenotyping, in addition to all known leukocyte subsets, should also include activation markers, intracellular cytokines, phosphorylated signaling proteins, and in certain instances, tetramer analysis. In many aspects, this approach more closely resembles gene profiling studies than it does immunophenotyping of the past.
For such a panel to be developed in a meaningful manner necessitates the use of high dimensional immunophenotyping where as many of these markers as possible are studied concomitantly. To this end, our laboratory is developing an in-depth and comprehensive panel to immunophenotype as many components of the immune system as possible, with the end goal of better defining immune perturbations in both health and disease. This panel utilizes 15-color, 17-parameter flow cytometry to study known lineages and subsets within these lineages as well as permitting ‘data mining’ to characterize previously undiscovered subsets. The construction of the panel is centered on developing individual tubes within lineages that, when combined, will yield a comprehensive phenotype of all lineages.
Optimally, this panel possesses recurring markers within the tubes of a given lineage in order to permit a deep level of inter-tube concatenation of immunophenotypes. Currently in its infancy, this panel consists of ten 15-color, 17-parameter tubes, but could well reach sixty or more in the next several years. Herein we present details concerning the development of this comprehensive panel and the progress to date in this effort.
Materials and Methods
Specimens
This panel is created to study the immune subsets in peripheral blood. While many, if not all of the markers studied will be relevant in other specimens such as bone marrow, lymph nodes, synovial or ascites fluid, and so forth, the utility of each marker, and tube, ultimately must be validated for each type of specimen. Peripheral blood is collected in sodium heparin and processed within 2 hours of collection. For these studies, the plasma is removed by centrifugation and the resulting cell pellet is lysed using ACK Lysing buffer (Quality Biological Inc, Gaithersburg, MD). Cells are subsequently washed in isotonic PBS and counted. For development of this panel, peripheral blood from healthy donors was used (IRB approved protocol 0-H-0229). In some experiments, fresh peripheral blood mononuclear cells (PBMCs) were compared to cryopreserved PBMCs from the same draw of the same donor. Further, this approach is preferentially designed for use on fresh blood, rather than cryopreserved. While this panel can be utilized on cryopreserved mononuclear cells (as will be shown later), there are many differences between the intensities of various markers in fresh versus frozen material, and extreme caution should be taken in comparing samples handled differently (Macey et al., 1998; Costantini et al., 2003; Weinberg et al., 2009). Furthermore, certain cell types such as myeloid cells and activated NK subsets may not be present in density gradient, prepared, cryopreserved specimens, and thus the entire immunophenome cannot be studied.
Sample staining
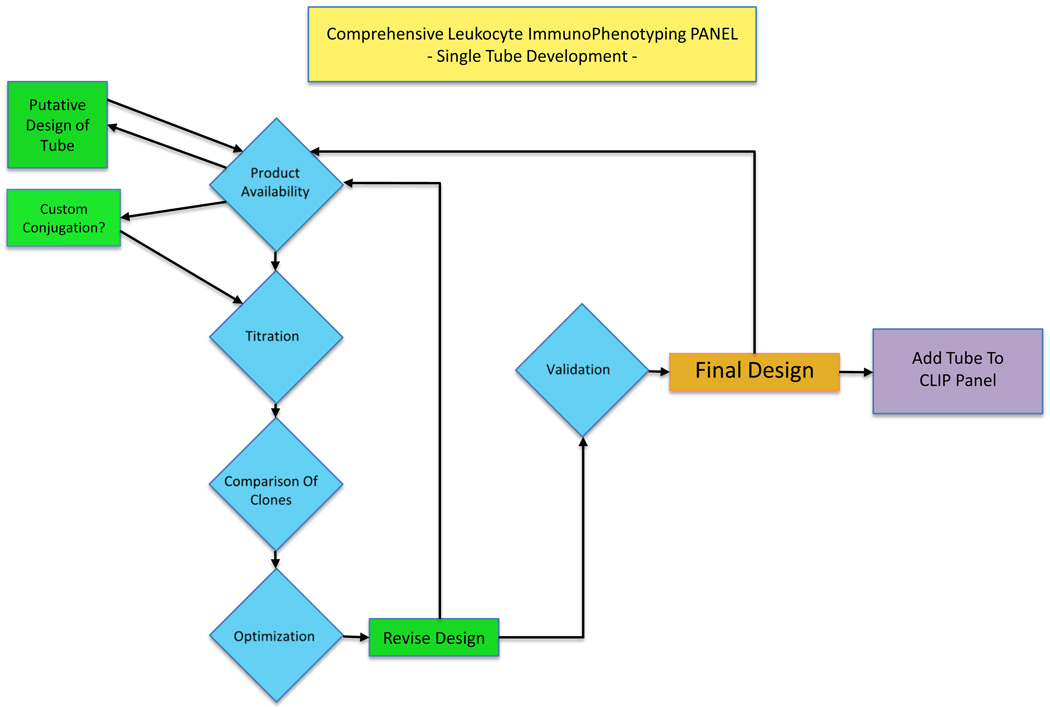
Antibodies used in these stainings were purchased from numerous manufacturers including Becton Dickinson (San Jose, CA), Beckman Coulter (Miami, FL), Life Sciences (Carlsbad, CA), Miltenyi Biotec (Bergisch Gladbach, Germany), R&D (Minneapolis, MN), BioLegend (San Diego, CA) and Ebioscience (San Diego, CA). Design of each tube included procedures recommended by Manhke et al (Mahnke and Roederer, 2007). All antibodies were titered prior to use. Figure 1 shows an overview of the process of a tube development. Table 1 shows a matrix of the antibodies and fluorochromes used for the initial 10 tubes. Cells were lysed using ACK Lysing buffer, except where comparative studies were conducted with density gradient-prepared cells. After lysis of the RBCs, cells were washed twice with isotonic PBS and counted. In general, viability staining was performed for 30 minutes in presence of LIVE/DEAD Aqua fixable viability dye (Life Sciences) followed by a wash in FACS staining buffer (PBS 2% Normal Mouse serum (Gemini Bioproducts, West Sacramento CA)). Surface marker staining followed and was performed for 30 min in FACS staining buffer. Some tubes had intracellular staining. In these cases intracellular staining followed surface marker staining, and cells were permeabilized with either Ebioperm buffer (Ebioscience) or Cytofix/Cytoperm buffer (BD), and the buffer usage was dictated by the antigen being stained. Between one and two million cells were used for staining within each tube, and in the case of dendritic cell staining, up to 5 million cells per tube were used if sufficient blood was available.
Figure 1. Schematic overview of tube development in CLIP.
TABLE 1.
Markers and fluorochromes used in preliminary panel
| T lineage | B lineage | NK lineage | Dendritic lineage | Mono lineage | ||||||
|---|---|---|---|---|---|---|---|---|---|---|
| Fluorochrom | Treg | Th17 | Th1/h2 | Bgeneral | Bnaive/memory | Bintracellular | NK1 | NK2 | DC1 | M1 |
| V450 | CD4 | CD4 | CD4 | Lambda | CD80 | CD80 | CD56 | CD56 | CD123 | HLA-DR |
| Aquablue | Viability | Viability | Viability | Viability | Viability | Viability | Viability | Viability | Viability | Viability |
| Qdot 605 | CD8 | CD8 | CD8 | CD10 | CD27 | CD27 | CD8 | CD8 | CD86 | CD163 |
| Qdot 655 | CD27 | CD27 | CD27 | CD19 | CD19 | CD19 | CD30 | NKp46 | CD4 | CD14 |
| Qdot 800 | CD45 | CD45 | CD45 | CD45 | CD45 | CD45 | CD45 | CD45 | CD45 | CD45 |
| FITC | CD39 | IL-23R | CD69 | CD40 | IgA | IgA | CD57 | CD57 | IFNa | CD77 |
| PcP-Cy5.5 | CD38 | CD196 | IL-4 | CD138 | CD86 | CD86 | CD161 | IFNg | TNFa | CD192 |
| PE | FOxp3 | IL-22 | Perforin | Kappa | CD21 | IgE | CD337 | Perforin | CD40 | CD64 |
| PE-TR | CD45-RA | CD45-RA | CD45-RA | CD38 | CD38 | CD38 | CD94 | CD25 | HLA-DR | CD16 |
| PE-Cy5 | CD103 | CD161 | CD40L | CD103 | IgG | IgG | CD16 | CD16 | CD83 | CD15 |
| PE-Cy5.5 /PE-A700 | HLA-DR | TNFa | TNFa | CD20 | CD20 | CD20 | CD244 | CD69 | CD11c | CD4 |
| PE-Cy7 | CD25 | IL-17A | IFNg | CD5 | CD23 | CD23 | CD5 | CD5 | Lineage* | CD13 |
| APC/AF647 | CD127 | IL-21 | IL-2 | CD22 | IgD | IgD | CD336 | CD127 | BDCA-2 | CD33 |
| AF700 | CCR7 | CCR7 | CCR7 | CD11c | IgM | IgM | CD158e1 | CD158e1 | CD33 | CD36 |
| APC-Cy7/AF750 | CD3 | CD3 | CD3 | CD25 | CD10 | CD10 | CD3 | CD3 | TLR-9 | CD206 |
Bold text indicates markers recurring throughout all tubes within a lineage; Italic text indicates intracellular markers requiring permeabilization of the cells.
Lineage: CD3, CD19, CD20, CD14, CD16, CD56
Cytometry and Data Analysis
Samples were acquired on a Becton Dickinson LSR II equipped with four lasers (407nm, 488nm, 532nm, and 633nm wavelengths) with 18 PMT detectors, optimized as described by Perfetto et al (Perfetto et al., 2006). Between 500,000 and 5 million events were collected per FCS file for each tube, depending on the number of cells available, in order to have sufficient events for statistical analysis of rare subsets defined by multiple markers. Data were acquired using DIVA 6.1.2 software (BD, San Jose, CA) and the analysis was performed using Flowjo (Treestar Inc, San Carlos, CA) and Gemstone (Verity Software House, Topsham, ME) software programs (Bagwell, 2010b).
Theory/calculation
Construction of a CLIP panel using high dimensional flow cytometry presents a myriad of technical challenges (Muirhead et al., 1986; Appay et al., 2008). A fifteen color tube offers the possibility of 215 (32,767) subsets, assuming all combinations of markers are possible and, if so, without regard to relative brightness of staining (i.e only positive or negative staining is considered) and would require 105 two-dimensional dotplots to display all combinations of these data in each tube. In the current approach, viability and CD45 are used for gating in all tubes, reducing the number of theoretically possible subsets to 213 (8,192). In the T lineage tubes, if one considers CD3 as an additional gating tool, this number is further reduced to 212 (4,096). Redundancy of markers in different tubes for a given lineage reduces the overall number of identifiable subsets within the panel, but increases the depth of phenotyping obtained on selected subsets via the redundant markers. Given these considerations, the preliminary panel constructed as shown in Table 1 can identify, in theory, approximately 28,000 leukocyte subsets. Conventional methods of analyzing flow cytometry data are not capable of analyzing these data in a complete, timely manner, and newer methods such as clustering approaches (Scheuermann et al., 2009) currently cannot handle the size of such data files, nor the number of parameters collected. Thus analysis of these data is segregated into two compartments: i) directed analysis in which known discrete subsets are measured, and ii) data mining in which minor or undescribed subsets or biomarkers are identified. The direct analysis can be accomplished using traditional analytical methods and is performed immediately, while the data mining will require software improvements, which are not yet available and will be performed at a later date.
Results
Staining of healthy blood with CLIP preliminary panel
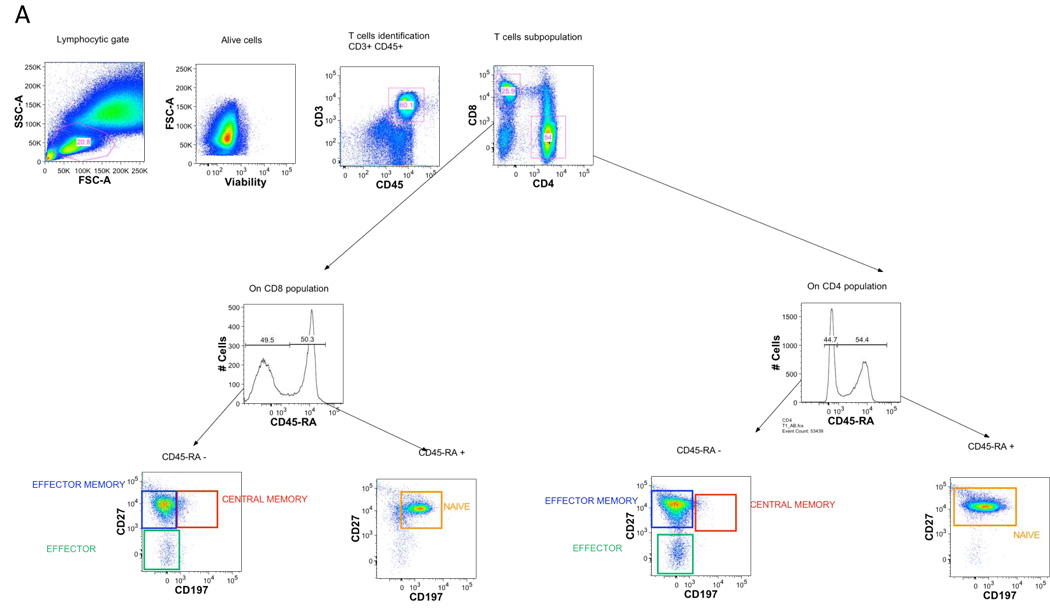
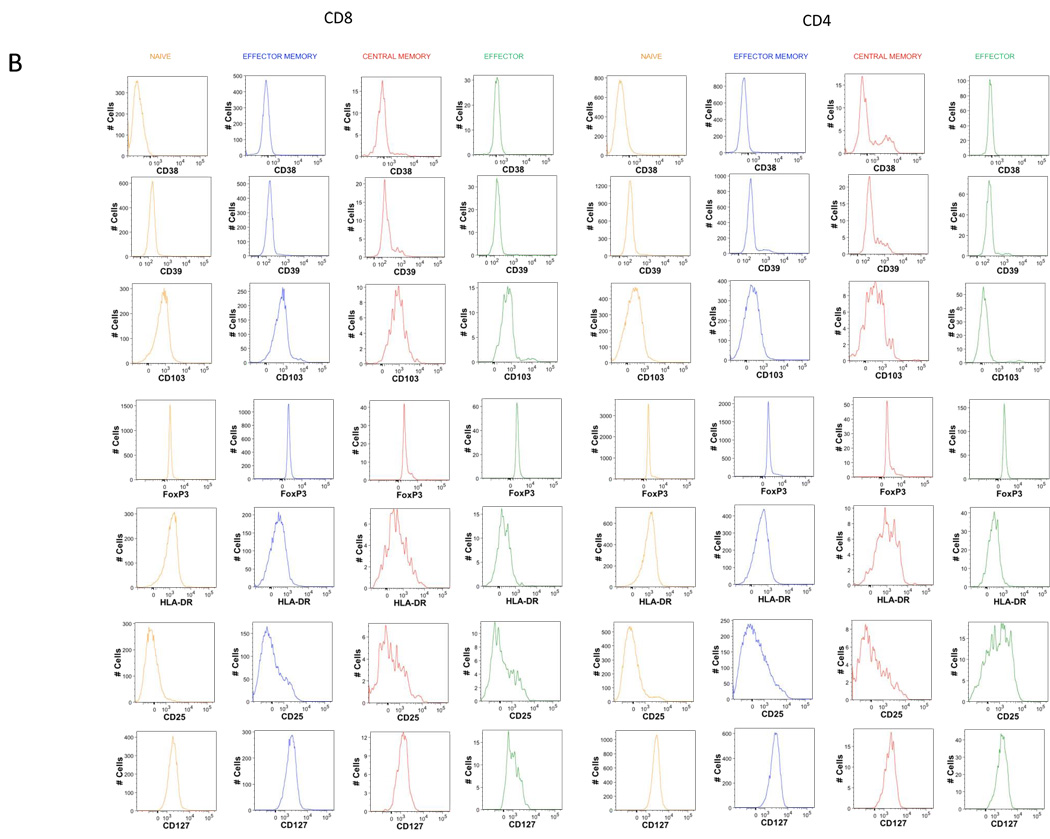
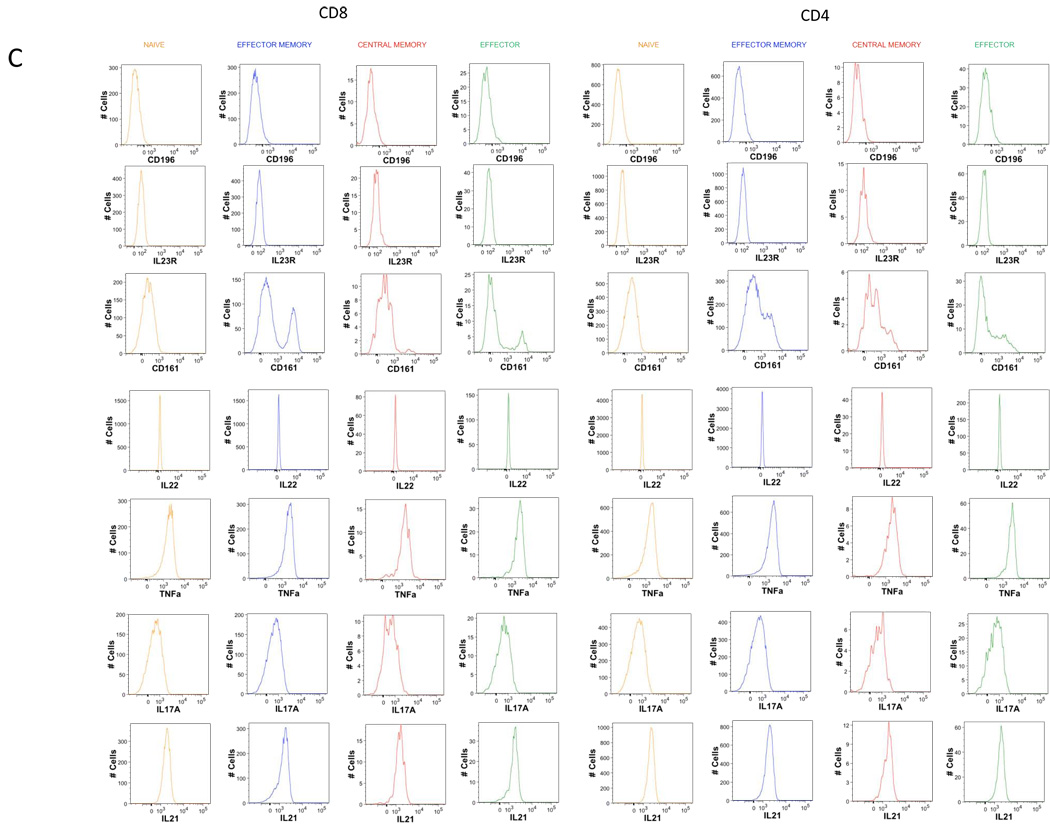
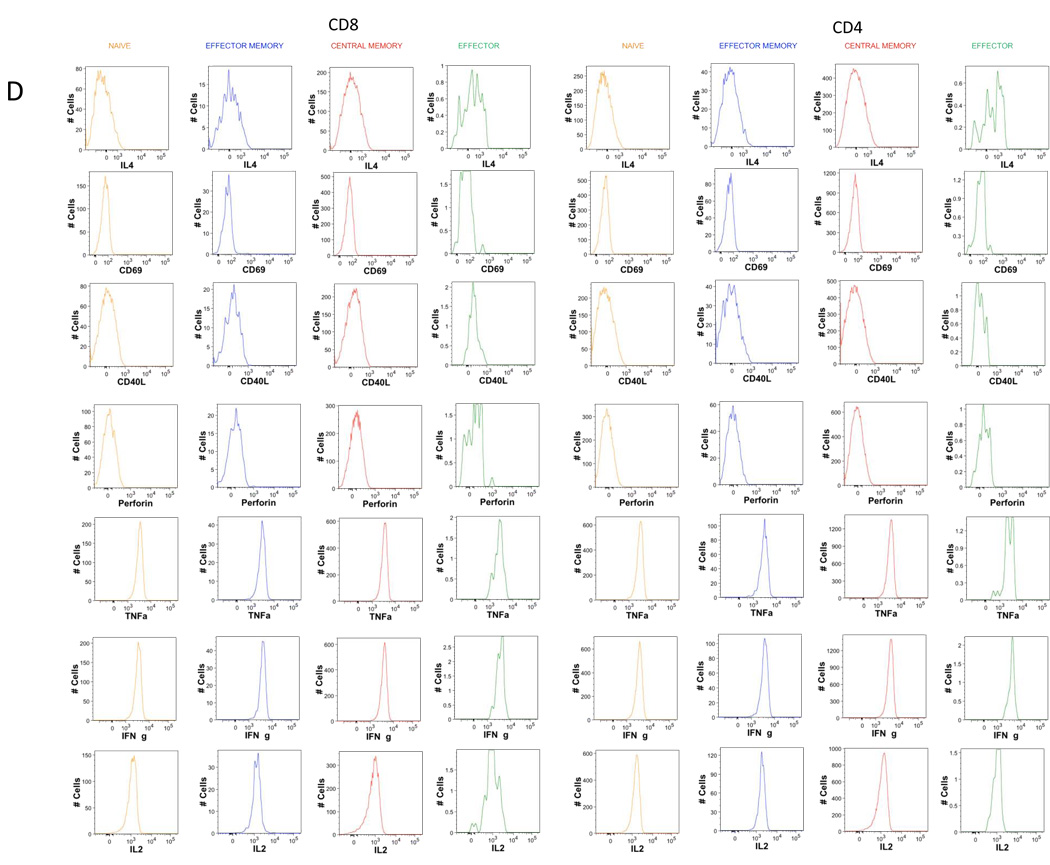
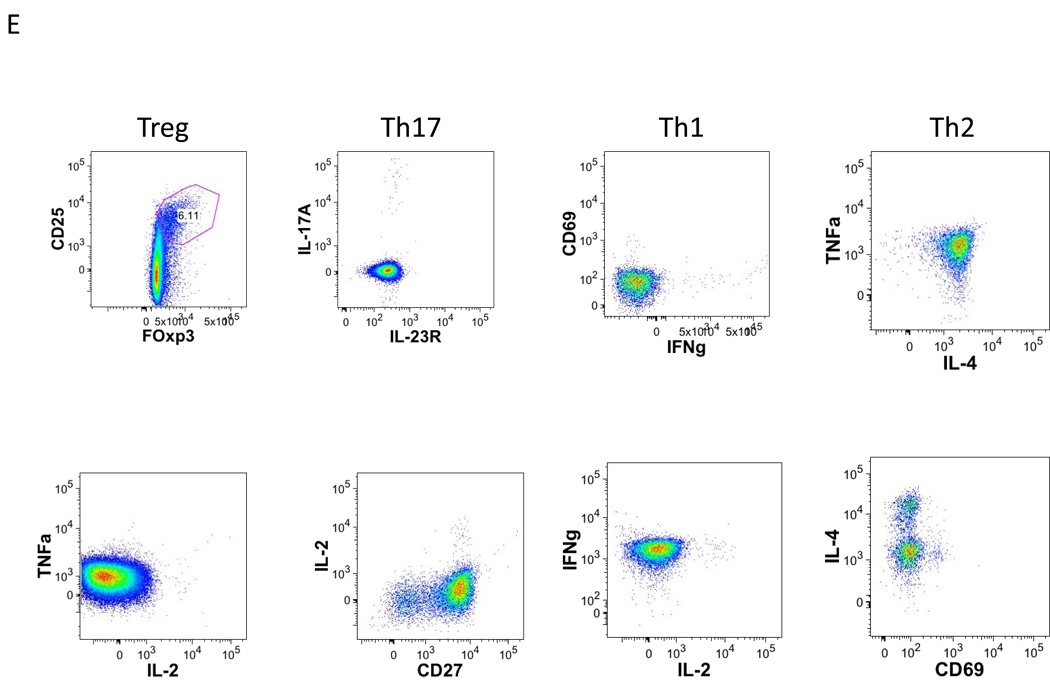
Examples of using the CLIP panel to stain peripheral blood from a healthy donor are shown in figures 2 (T lineage tubes), 3 (B lineage tubes), 4 (NK lineage tubes), 5 (monocyte tube) and 6 (dendritic cell tube). Shown here are simple analyses of each of these tubes illustrating the utility of each, and not a complete assessment of all potential data that could be mined from these studies. The redundancy of eight markers in every T lineage tube permits for in depth characterization of not only CD3, CD4, and CD8 subsets, but also of the naïve, effector, and memory subsets within both CD4 and CD8 populations, as shown in figure 2A. Further, tube-specific data are also obtained, such as the number of T regulatory cells from the Treg tube and the number of Th17 cells from the Th17 tube (Fig. 2B). The same discrimination can be applied to CD8 T cells as well to identify Tc17.
Figure 2. Gating strategy in T lineage tubes.
Single-cell suspensions from healthy donors were stained with a combination of 14 antibodies and viable dye as described in table 1. Lymphocytes were identified based on their forward and side scatter properties. Subsequently, dead cells were excluded through the use of a viability dye. CD45 and CD3 were used to identify T cells (CD45+CD3+) among the previously selected living lymphocytes. CD4 T cells and CD8 T cells were identified with the expression of CD4 or CD8 antigens.
A. Among CD4 and CD8 T cells, CD45-RA+ cells were separated by gating from CD45-RA−, and the expression of CCR7 and CD27 inside these 2 sub-populations was determined. Four sub-populations could be defined as follows; naïve (CD45-RA+) effector (CD45-RA−CD27−CCR7−), central memory (CD45-RA−CD27+CCR7+) and effector memory (CD45-RA−CD27+ CCR7−).
B. Histograms of the expression of the 7 markers remaining in T1 tube after memory naïve separation.
C. Histograms of the expression of the 7 markers remaining in T2 tube after memory naïve separation.
D. Histograms of the expression of the 7 markers remaining in T3 tube after memory naïve separation.
E. Representative dot plot of T cell specific population definition. Conventional Treg were defined as CD4 T cells co-expressing CD25 and transcription factor FOxp3. Th17 cells were defined as IL-17A expressing cells. Th1 defined s IFNg expressing cells, Th2 as IL-4 expressing cells. Also, IL-2 secreting cells can be identified.
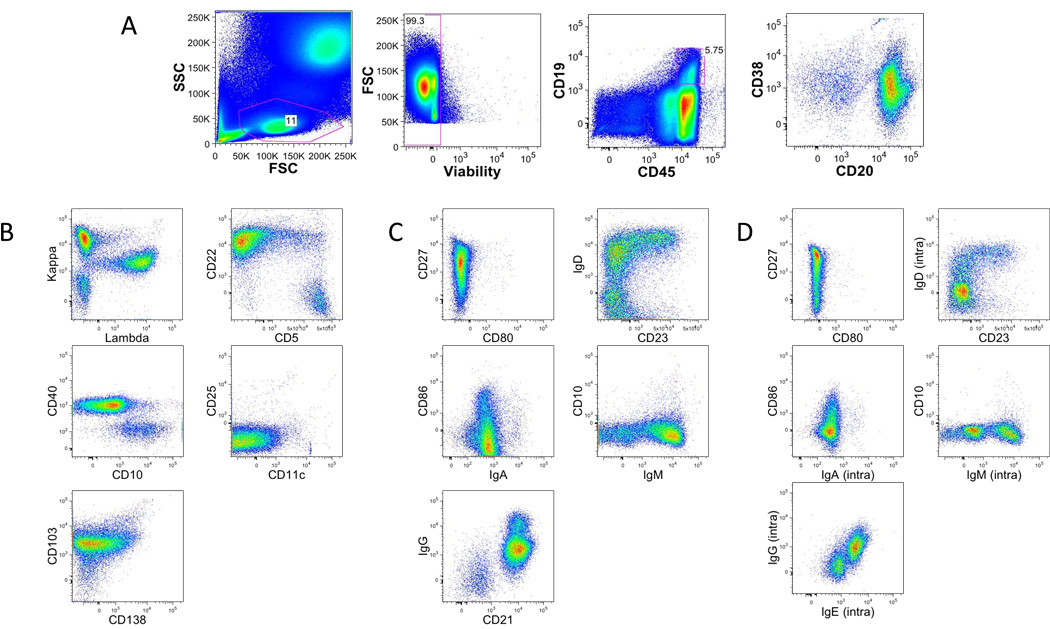
The B cell tubes are structured somewhat differently from the T lineage tubes (Fig. 3). The redundancy of 5 markers is shown in figure 3A. The first B cell tube (Fig. 3B) is constructed more as seen in leukemia/lymphoma immunophenotyping, and can be used to identify various normal B cell populations ranging from hematogones to plasma cells, as well as possible abnormalities such as chronic lymphocytic leukemia. The second B cell tube is constructed from more of an immunologist’s viewpoint and can discern naïve and memory B cells populations using markers such as immunoglobulin class switching (Fig. 3C). The third B cell tube uses logic similar to the second tube except here the immunoglobulin expression is examined intracellular, rather than extracellular as in the previous tube (Fig. 3C).
Figure 3. Gating strategy in B lineage tubes.
A. Single-cell suspensions from healthy donors were stained with a combination of 14 antibodies and viability dye as described in the material and methods and table 1 (B1, B2 and B3). Lymphocytes were identified based on their forward and side scatter properties. Subsequently, dead cells were excluded through the use of a viability dye. CD45 and CD19 were used to identify B cells (CD45+CD19+) among the previously selected living lymphocytes.
B. Representative dot plot of the markers specific of Staining B1.
C. Representative dot plot of the markers specific of Staining B2.
D. Representative dot plot of the markers specific of Staining B3.
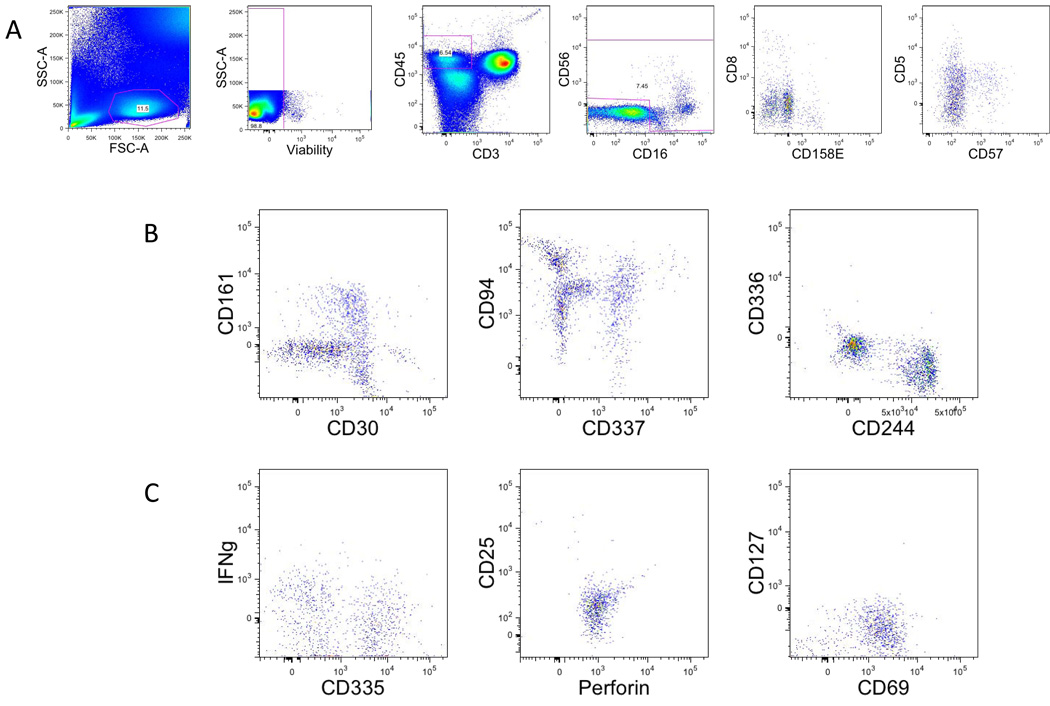
The NK lineage tubes (Fig. 4) revert to a structure more similar to the T lineage tubes in which 9 redundant markers are used to gate and subclassify NK cells in each tube (viability, CD45, CD56, CD8, CD57, CD16, CD5, CD3, CD158e1) and then additional markers can be used in each tube to characterize these subsets.
Figure 4. Gating strategy in NK lineage tubes.
A. Single-cell suspensions from healthy donors were stained with a combination of 14 antibodies and viability dye as described in the material and methods and table 1. Natural killer cells were identified based on their forward and side scatter properties. Subsequently, dead cells were excluded through the use of a viability dye. CD45 and CD3 were used to identify NK cells (CD45+CD3−) among the previously selected living lymphocytes. CD16 and CD56 were used to identify NK among the prior populations CD16+ and/or CD56+.
B. Representative dot plot of the markers specific of Staining NK1.
C. Representative dot plot of the markers specific of Staining NK2
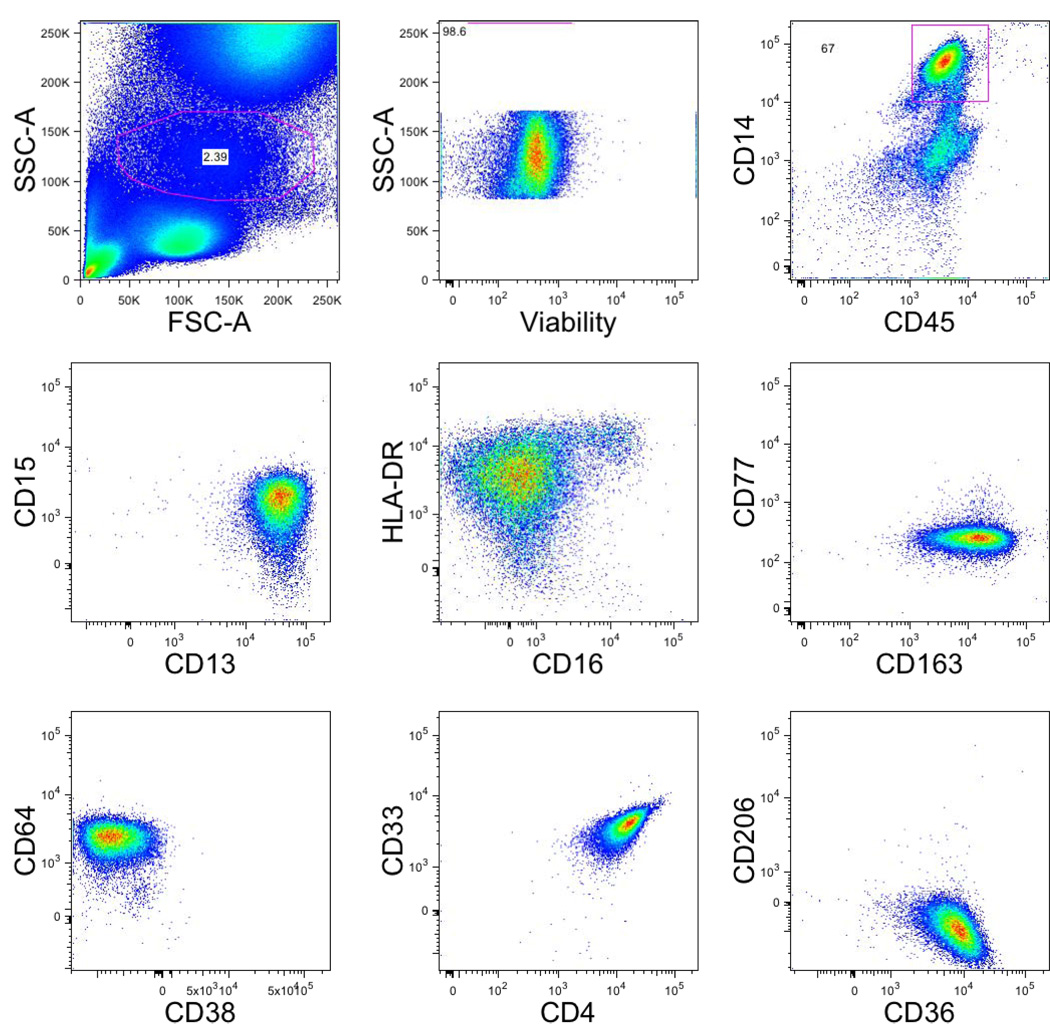
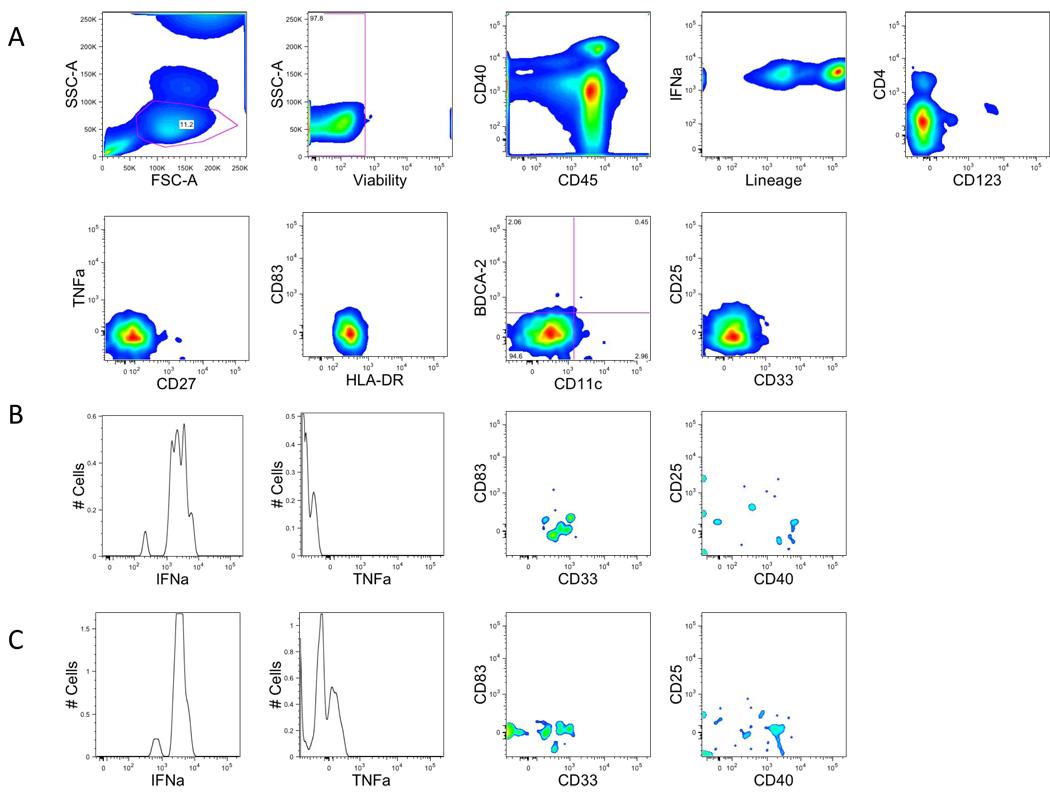
The monocyte/myeloid tube and dendritic cell tube, both represent the initial tubes in a series for these lineages. It is planned that the former will have 8 redundant markers among the subsequent lineage tubes (viability, CD45, CD13, CD14, CD15, CD33, CD64, CD36) (Fig. 5) while the latter will have 7 redundant markers (viability, CD45, lineage dump, CD123 (plasmacytoid DC), CD11c (myeloid DC), CD4 and HLA-DR) (Fig. 6).
Figure 5. Gating strategy in myeloid/monocytic lineage tubes.
Single-cell suspensions from healthy donors were stained with a combination of 14 antibodies and viability dye as described in the material and methods and table 1. Monocytes were identified based on their forward and side scatter properties. Subsequently, dead cells were excluded through the use of a viability dye. CD45 and CD14 were used to identify monocytes (CD45+CD14+) among the previously selected living monocytic gate.
Figure 6. Gating strategy in dendritic cell lineage tubes.
A. Single-cell suspensions from healthy donors were stained with a combination of 14 antibodies and viability dye as described in the material and methods and Table 1. Dendritic cells were identified based on their forward and side scatter properties (same as lymphocyte). Subsequently, dead cells were excluded through the use of a viability dye. CD45 and lineage were used to identify DC cells (CD45−Lineage−). Expression of HLA-DR was required, and we identified myeloid dendritic cells (CD11c+) from plasmacytoid dendritic cells (CD123+) with the expression of CD11c and CD123.
B. Myeloid dendritic cells (CD11c+) were analyzed for the expression of cytokines such as IFNa, TNFa or activation markers CD83, CD25, CD40, CD33
C. Plasmacytoid dendritic cells (CD123+) were analyzed for the expression of cytokines such as IFNa, TNFa or activation markers CD83, CD25, CD40.
Due to low number of cells, all figures are smoothed histograms.
Technical considerations on tube and panel development
Intracellular staining
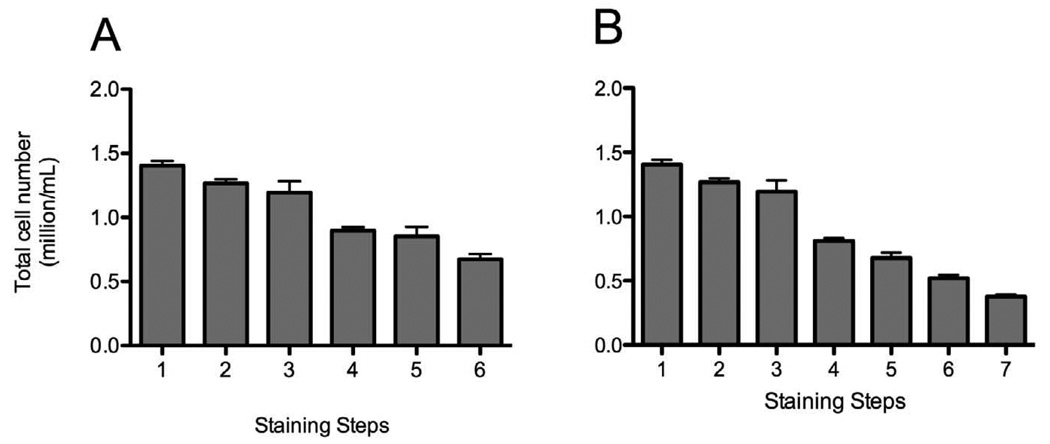
To develop a comprehensive panel capable of identifying many of the leukocyte populations of widespread interest, such as Th17, Th1, Th2, and Treg cells, it was necessary to include intracellular staining in many of the tubes. Such staining methods have been widely described previously (Maecker et al., 2005a; Maecker et al., 2005b), although never in the context of a panel of the magnitude describe in the current report. Intracellular staining brings with it two major technical problems: i) compatibility of the fix/perm method with the staining of all markers in a particular tube, and ii) the loss of cells associated with this procedure. Resolution of the former problem is accomplished by empirical testing of fix/perm reagents for changing intensity of staining of surface markers compared to staining of fresh unfixed cells, while at the same time permitting optimal staining of the intracellular antigen. In terms of cell loss associated with the fix/perm and stain procedure, Figure 7 shows the losses associated with each step of these methods using two different permeabilization reagents. From beginning to end, roughly 50–65% of the cells are lost in such procedures. Thus the number of cells initially placed into each tube must be proportionally higher than the number placed into tubes not requiring intracellular staining in order for equivalent large numbers of cells to be collected on the cytometer.
Figure 7. Cell loss during staining procedure.
Single-cell suspensions from healthy donors were stained with Treg (A) and Th17 (B), and we counted cell numbers at each steps of the staining prior to the centrifugation. The graphs represent the total cell number at each step of the staining procedure.
A. 1: wash after ACK lysis, 2: wash after ACK lysis, 3:wash after viability staining, 4:wash after extracellular staining, 5: wash after fix and permeabilization, 6: wash after intracellular staining.
B. 1: wash after ACK lysis, 2: wash after ACK lysis, 3:wash after viability staining, 4:wash after extracellular staining, 5: wash after fix and permeabilization, 6: wash after intracellular staining, 7:wash after streptavidin binding.
Comparative studies of fresh and cryopreserved specimens
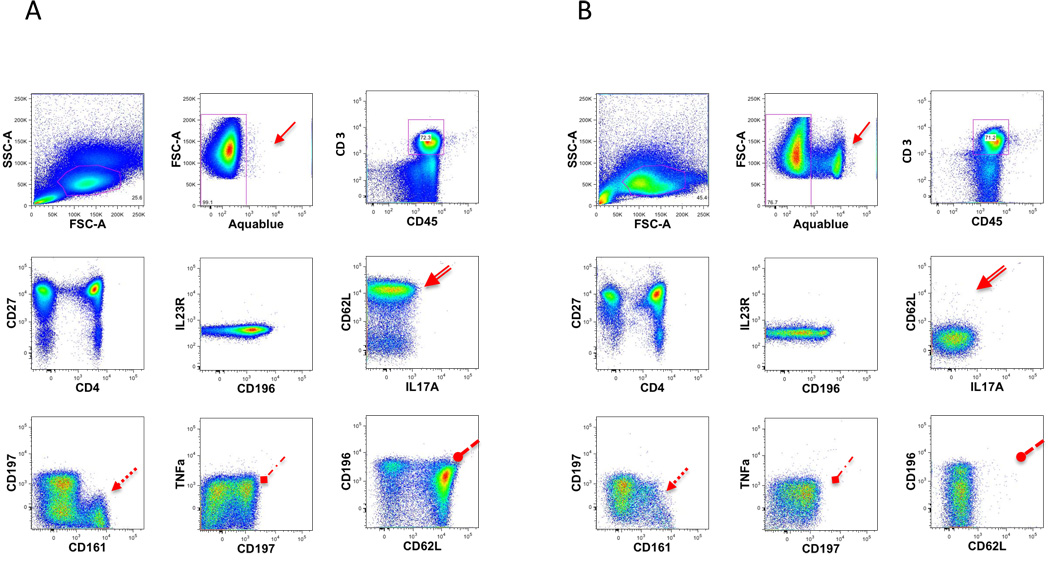
For large translational studies of human subjects there are arguments favoring the use of either freshly obtained or alternatively cryopreserved specimens for immunophenotyping studies. Fresh specimens permit the examination of labile antigens, transient markers of activation, myeloid cells, and subsets, such as activated NK cells, potentially upon density gradient separation. However, the use of fresh specimens may necessitate additional laboratory staffing and possibly more stringent laboratory procedures to minimize batch effects. The use of cryopreserved specimens necessitates the use of density gradient separation, and precludes the analysis of certain cell types including myeloid cells. However, it does offer ease of collecting and shipping specimens at various sites, as well as allowing multiple specimens e.g. several time points from a single patient) to be analyzed at the same time. The possibility of using both fresh and cryopreserved specimens in the same study is contraindicated by data suggesting that some markers have different staining characteristics depending on whether fresh or cryopreserved cells are analyzed (Maecker et al., 2005a; Maecker et al., 2005b; Disis et al., 2006). The current CLIP panel has been designed for fresh specimens, but can also be run on cryopreserved samples. However differences are observed between the two types of specimens (Fig. 8). Therefore within a given study either fresh or cryopreserved specimens may be used, but never a mixture of the two.
Figure 8. Fresh vs Frozen.
Freshly isolated single-cell suspensions from healthy donors or frozen cells from the same donor were stained with T2 staining. A comparison was made between the percentages of cells expressing the cell surface markers. Fresh lymphocytes (A) are compared to frozen lymphocytes (B). Presented are some of the dot plot combinations for the T2 staining.
The arrows point out the main differences observed.
Stability of cocktails
Due to the large number of antibodies used in each tube, the potential for pipetting error is high. As a temporary solution to this problem, the use of premixed ‘cocktail’ of reagents has been explored. In this approach all reagents other than the viability stain and intracellular stains are premixed, thus permitting minimal pipetting moves when setting up individual samples. This approach does not change any of the staining characteristics for any marker tested if the cocktails are used soon after preparation. The performance of the cocktails begins to degrade after 3 days (Fig. 9), and therefore must be used within this time frame. Degradation of the cocktail occurred primarily as the result of 3 antibodies: QD605 CD8, QD655 CD27, and PE-Cy5 CD103. At present this observation cannot be definitively explained.
Figure 9. Antibodies mixture stability.
Single-cell suspensions from healthy donors were stained with T1 staining every day with a fresh mix along with a mix that was prepared at day 0. The graphs represent dot plots for CD4 and CD8 T cells stained with the premixed ‘cocktail’ of reagents from day 0 to day 4.
Stability (reproducibility) with time
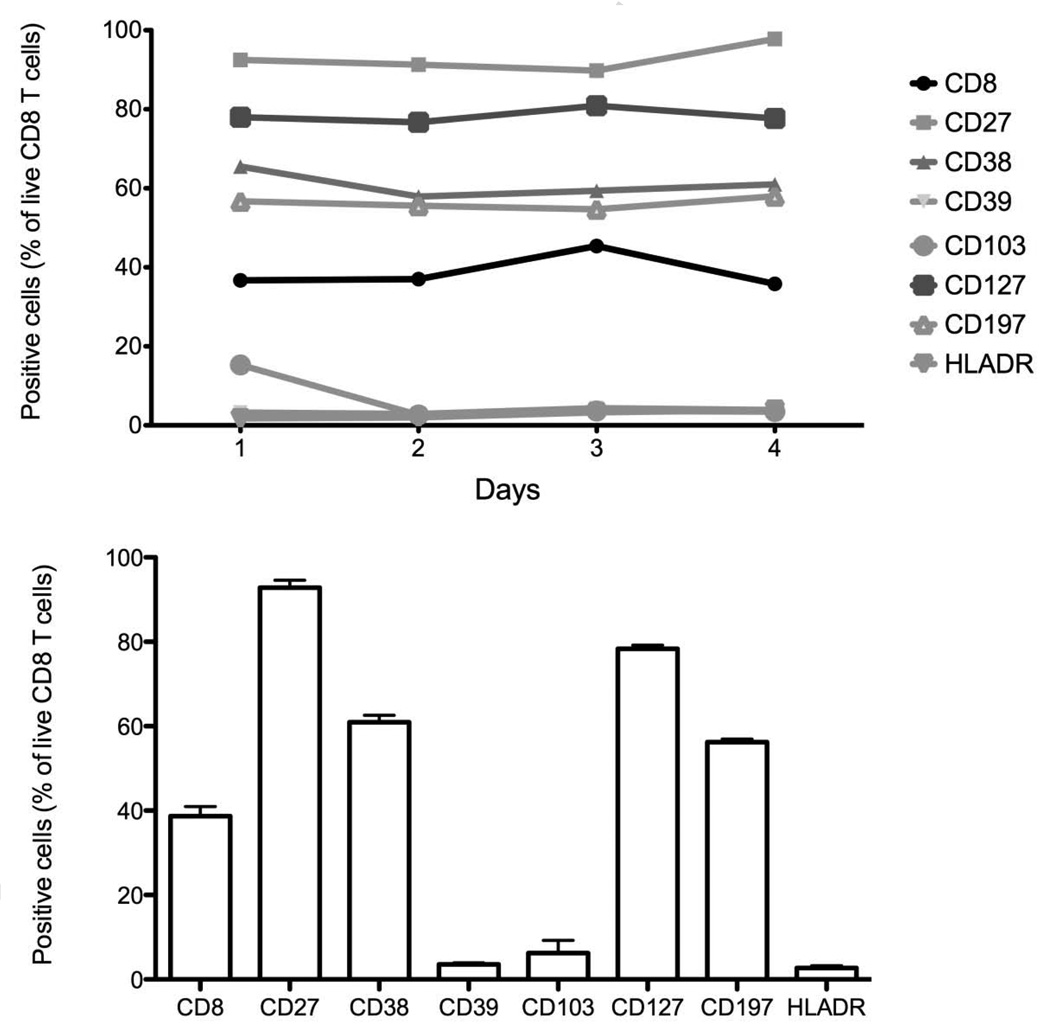
A potential concern with high dimensional immunophenotyping, or any immunophenotyping used for clinical or translational studies, is the reproducibility of the staining over time. In many protocols, several samples from the same patient are run at multiple time points, and it is crucial to be able to determine differences in the data that truly arise from the sample rather than from assay variability. To address this, and to determine the variability of fifteen color immunophenotyping, staining for one of the tubes (Treg) was performed on aliquots of the same specimen. This specimen from a single donor at a single time point had been cryopreserved into multiple aliquots. These aliquots were thawed at various intervals and stained and analyzed in a consistent manner. Figure 10 shows the variability observed among these samples for CD8 T cells expressing CD27, CD38, CD39, CD103, CD127, CD197, HLA-DR (from staining T1) (n = 4). The coefficient of variation (CV) of the percentage of CD8 expressing cells was the lowest for CD127 (2.3%) and CD197 (2.5%). The highest CV was observed for CD103 (96%) and another activation marker HLA-DR (36.8%).
Figure 10. Staining variability.
Single-cell suspensions from healthy donors were stained with T1 staining (n = 4). CD8 T cells were identified as described previously. The graphs represent the percentage of each marker of positive CD8 T cells at 4 different time points. (A) Each time point is represented and (B) is the mean and standard error of the mean of 6 time points.
Probability state models (PSMs) for data reduction
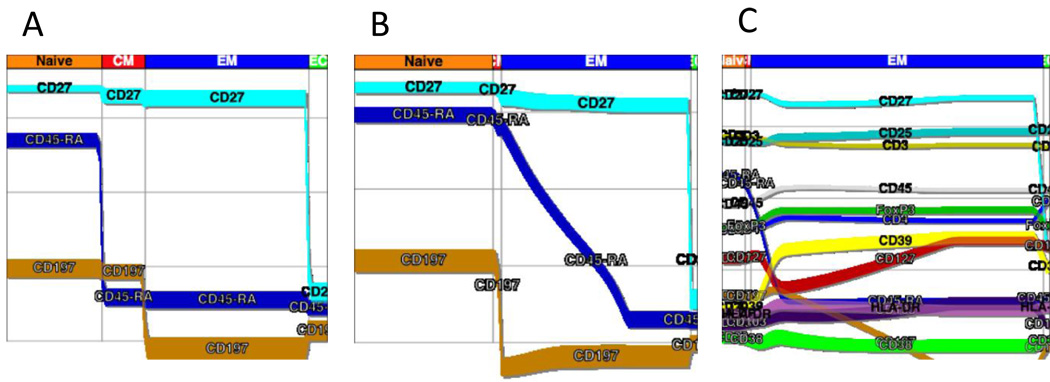
The vast amount of data acquired in this 10 tube preliminary CLIP panel resulted in far more information than can be readily analyzed using conventional flow cytometric analysis approaches. Automated clustering programs such as FLOCK and FLAME may ultimately prove to be of use, but at present neither can handle the number of parameters nor number of events collected in this CLIP panel. Recently a commercial software package was introduced that creates probability state models from flow cytometric data (Bagwell, 2009; Bagwell, 2010a). This approach uses known relationships of specific markers to a cell state. For example, the expressions of CD45RA and CCR7 (CD197) have been well defined for CD4+ naïve, effector and memory populations. Using as many of these known relationships as possible, models can be constructed for the expression of these markers as cells transition from naïve to effector and memory populations. As all 15 markers in each tube are acquired for every single cell in a correlated manner, once state models are created for known relationships, models for the remaining markers can be constructed. Figure 11 displays a PSM created for the Treg tube. Here the relationship of all markers expressed on CD4 cells (A) or CD8 cells (B) can be viewed simultaneously as a function of the cells being naïve, effector, effector memory, or memory populations. Additionally, PSMs can be created for conventional Tregs (Fig. 11).
Figure 11. Probability State Modeling (PSM).
A probability state model was constructed with Gemstone Verity Software House and was applied to CD4 T cells and CD8 T cells. For these displays, the data were gated on light scatter, viability, and expression of CD45, CD3, and either CD4 or CD8 as described earlier. The y-axis is fluorescence intensity while the x-axis displays transitions from naïve to memory and effector populations. Here it is possible to visualize relative intensity of marker expression along with putative transitions among these populations.
A. The graph reveals the proportions of memory and naïve subsets as in the previous figure 2A, for CD4+ T cells.
B. The graph reveals the proportions of memory and naïve subsets as in the previous figure 2A, for CD8+ T cells.
C. For this model, the data were gated on light scatter, viability, and expression of CD45, CD3, CD4, CD25high, and FoxP3 as described earlier. The y-axis is fluorescence intensity while the x-axis displays transitions from naïve to memory and effector populations. This graphs reveals the coordinate expression patterns of memory and naïve markers as well as activation markers through the transitions.
Discussion
Historically, immunophenotyping in clinical trials and translational studies has been performed in a very directed and limited manner. Relatively few markers have been preselected for study, and as a result, only portions of the entire immune system have been investigated in any one study. Advances over the past several decades have resulted in technology and methods being developed for high dimensional immunophenotyping, production of monoclonal antibodies to hundreds of leukocyte differentiation antigens, and an increasing awareness of the complex interaction among cells of various lineages in the immune system. The logical culmination of these efforts is comprehensive leukocyte immunophenotyping (CLIP) in which a simultaneously broad and in depth assessment of the immune system is performed. The current 10 tube CLIP panel, while preliminary for truly comprehensive assessment, demonstrates the feasibility of this approach, and the obstacles that remain for full implementation of this assay. Clearly the largest constraint in performing these assays is the ability to fully analyze the data in a timely manner. Current approaches for analysis permit enumeration of only a defined, limited number of subsets. Probability state modeling offers one potential approach for data reduction, but it is likely that additional approaches will be necessary for thoroughly mining these data, particularly for relatively rare novel populations. Efforts are currently underway in conjunction with bioinformaticians to devise methods to facilitate more complete and rapid analyses of CLIP panels. Given the potential to identify 28,000 leukocyte subsets in this preliminary panel, it is likely that genomic-style approaches for data analysis and presentation will need to be adapted for these assays.
In a previous report (Biancotto et al., Submitted), the utility of one of the tubes from this panel has been demonstrated in elucidating multiple, complex alterations among T regulatory cells associated with chronic lymphocytic leukemia. Currently several studies are ongoing using all, or parts, of this CLIP panel to evaluate immune changes associated with disease or with perturbations to the immune system such as vaccination or administration of growth factors.
Conclusions
It is evident that the complexities of the human immune system cannot be thoroughly understood through the use of simplistic measurements or assays. While these may yield great amount of information concerning a particular cell type or functional molecule, little knowledge is gained about the system per se. To facilitate understanding of the immune system, a CLIP panel is being developed as just one component of a comprehensive approach to studying the immune system. The preliminary data from this 10 tube prototype CLIP panel demonstrates the feasibility of this approach, as well as aspects that require more development.
The CLIP panel developed to date will continue to grow and become more comprehensive. Additions, such as detection of T cell clonality through the use of selective Vβ and Vα region reagents, KIR usage by NK cells and so forth, should be easily implemented. Additional expansion of this panel will include the study of more cytokines, activation markers, and functional markers of leukocyte subsets. Finally, it is hoped that signaling pathways, as pioneered by Nolan et al (Hale and Nolan, 2006), could be added through the use of phospho-specific reagents. Together, as components of a larger CLIP panel, these could provide a thorough, meaningful immunophenotypic description of the immune system.
Acknowledgements
This research was supported by the Intramural Research Program of the NHLBI, NIH, Bethesda, MD and by the CHI (Center for Human Immunology, Autoimmunity and Inflammation), NIH, Bethesda, MD. We thank the following for helpful comments and suggestions: Mario Roederer, Pratip Chattopadhyay, Giorgio Trinchieri, Kristen Tarbell, Franco Marincola, Ron Germain, Pam Schwartzberg, Bruce Bagwell, Don Herbert, Dan Kastner, Robert Nussenblatt, Rick Childs, Andreas Lundqvist, Adrian Wiestner, Matthew Olnes and Neal Young.
Footnotes
Publisher's Disclaimer: This is a PDF file of an unedited manuscript that has been accepted for publication. As a service to our customers we are providing this early version of the manuscript. The manuscript will undergo copyediting, typesetting, and review of the resulting proof before it is published in its final citable form. Please note that during the production process errors may be discovered which could affect the content, and all legal disclaimers that apply to the journal pertain.
References
- Appay V, van Lier RA, Sallusto F, Roederer M. Phenotype and function of human T lymphocyte subsets: consensus and issues. Cytometry A. 2008;73:975–983. doi: 10.1002/cyto.a.20643. [DOI] [PubMed] [Google Scholar]
- Bagwell BC. Probability State Modeling - A new paradigm for cytometric analysis. In: Marter VLaP., editor. Flow cytometry in Drug discovery and Development. John Wiley & Sons; 2009. [Google Scholar]
- Bagwell BC. Breaking the Dimensionality Barrier. In: Davis KK-MaB., editor. Laboratory Hematology Practise. Wiley-Blackwell; 2010a. [Google Scholar]
- Bagwell BC. "Probability State Models". Vol. 7653509. USA: 2010b. [Google Scholar]
- Biancotto A, Dagur PK, Fuchs JC, Wiestner A, Bagwell CB, McCoy JP. High Dimensional Flow Cytometry Reveals Complex Immunophenotypic Alterations Among T Regulatory Cells in Patients with Chronic Lymphocytic Leukemia. Blood. (Submitted) [Google Scholar]
- Costantini A, Mancini S, Giuliodoro S, Butini L, Regnery CM, Silvestri G, Montroni M. Effects of cryopreservation on lymphocyte immunophenotype and function. J Immunol Methods. 2003;278:145–155. doi: 10.1016/s0022-1759(03)00202-3. [DOI] [PubMed] [Google Scholar]
- Davis MM. A prescription for human immunology. Immunity. 2008;29:835–838. doi: 10.1016/j.immuni.2008.12.003. [DOI] [PMC free article] [PubMed] [Google Scholar]
- Disis ML, dela Rosa C, Goodell V, Kuan LY, Chang JC, Kuus-Reichel K, Clay TM, Kim Lyerly H, Bhatia S, Ghanekar SA, Maino VC, Maecker HT. Maximizing the retention of antigen specific lymphocyte function after cryopreservation. J Immunol Methods. 2006;308:13–18. doi: 10.1016/j.jim.2005.09.011. [DOI] [PubMed] [Google Scholar]
- Hale MB, Nolan GP. Phospho-specific flow cytometry: intersection of immunology and biochemistry at the single-cell level. Curr Opin Mol Ther. 2006;8:215–224. [PubMed] [Google Scholar]
- Macey MG, McCarthy DA, Howells GL, Curtis MA, King G, Newland AC. Multiparameter flow cytometric analysis of polymorphonuclear leucocytes in whole blood from patients with adult rapidly progressive periodontitis reveals low expression of the adhesion molecule L-selectin (Cd62L) Cytometry. 1998;34:152–158. doi: 10.1002/(sici)1097-0320(19980615)34:3<152::aid-cyto5>3.0.co;2-j. [DOI] [PubMed] [Google Scholar]
- Maecker HT, Moon J, Bhatia S, Ghanekar SA, Maino VC, Payne JK, Kuus-Reichel K, Chang JC, Summers A, Clay TM, Morse MA, Lyerly HK, DeLaRosa C, Ankerst DP, Disis ML. Impact of cryopreservation on tetramer, cytokine flow cytometry, and ELISPOT. BMC Immunol. 2005a;6:17. doi: 10.1186/1471-2172-6-17. [DOI] [PMC free article] [PubMed] [Google Scholar]
- Maecker HT, Rinfret A, D'Souza P, Darden J, Roig E, Landry C, Hayes P, Birungi J, Anzala O, Garcia M, Harari A, Frank I, Baydo R, Baker M, Holbrook J, Ottinger J, Lamoreaux L, Epling CL, Sinclair E, Suni MA, Punt K, Calarota S, El-Bahi S, Alter G, Maila H, Kuta E, Cox J, Gray C, Altfeld M, Nougarede N, Boyer J, Tussey L, Tobery T, Bredt B, Roederer M, Koup R, Maino VC, Weinhold K, Pantaleo G, Gilmour J, Horton H, Sekaly RP. Standardization of cytokine flow cytometry assays. BMC Immunol. 2005b;6:13. doi: 10.1186/1471-2172-6-13. [DOI] [PMC free article] [PubMed] [Google Scholar]
- Mahnke YD, Roederer M. Optimizing a multicolor immunophenotyping assay. Clin Lab Med. 2007;27:469–485. doi: 10.1016/j.cll.2007.05.002. v. [DOI] [PMC free article] [PubMed] [Google Scholar]
- Muirhead KA, Wallace PK, Schmitt TC, Frescatore RL, Franco JA, Horan PK. Methodological considerations for implementation of lymphocyte subset analysis in a clinical reference laboratory. Ann N Y Acad Sci. 1986;468:113–127. doi: 10.1111/j.1749-6632.1986.tb42034.x. [DOI] [PubMed] [Google Scholar]
- Perfetto SP, Ambrozak D, Nguyen R, Chattopadhyay P, Roederer M. Quality assurance for polychromatic flow cytometry. Nat Protoc. 2006;1:1522–1530. doi: 10.1038/nprot.2006.250. [DOI] [PubMed] [Google Scholar]
- Scheuermann RH, Qian Y, Wei Cand Sanz I. ImmPort FLOCK: Automated cell population identification in high dimensional flow cytometry data. Journal of Immunology. 2009;182 [Google Scholar]
- Weinberg A, Song LY, Wilkening C, Sevin A, Blais B, Louzao R, Stein D, Defechereux P, Durand D, Riedel E, Raftery N, Jesser R, Brown B, Keller MF, Dickover R, McFarland E, Fenton T. Optimization and limitations of use of cryopreserved peripheral blood mononuclear cells for functional and phenotypic T-cell characterization. Clin Vaccine Immunol. 2009;16:1176–1186. doi: 10.1128/CVI.00342-08. [DOI] [PMC free article] [PubMed] [Google Scholar]


