Abstract
Background
High levels of proinflammatory cytokines are linked to pathogenesis of diarrhea in inflammatory bowel diseases (IBD). Na+ absorption is compromised in IBD. The studies were designed to determine the effect of tumor necrosis factor-α (TNF-α) on the expression and activity of NHE2, a Na+/H+ exchanger (NHE) that is involved in trans-epithelial Na+ absorption in intestinal epithelial cells.
Methods
NHE2 regulation was examined in TNF-α treated C2BBe1 cells by RT-PCR, reporter gene assays and Western blot analysis. NHE isoform activities were measured as ethyl-isopropyl-amiloride- and HOE694-sensitive 22Na-uptake. In vitro and in vivo protein-DNA interactions were assessed by gel mobility shift assays and chromatin immunoprecipitation studies.
Results
TNF-α treatment of C2BBe1 cells led to repression of NHE2 promoter activity, mRNA and protein levels; and inhibited both NHE2 and NHE3 mediated 22Na-uptake. 5′-deletion analysis of the NHE2 promoter-reporter constructs identified bp −621 to −471 as TNF-α responsive region (TNF-RE). TNF-α activated NF-κB subunits, p50 and p65, and their DNA-binding to a putative NF-κB motif within TNF-RE. Mutations in the NF-κB motif abolished NF-κB-DNA interactions and abrogated TNF-α-induced repression. Ectopic over-expression of NF-κB resulted in repression of NHE2 expression. Two functionally distinct inhibitors of NF-κB blocked the inhibitory effect of TNF-α.
Conclusions
The human NHE2 isoform is a direct target of transcription factor NF-κB. TNF-α-mediated activation of NF-κB decreases the expression and activity of NHE2 in intestinal epithelial cell line, C2BBe1. These findings implicate NF-κB in the modulation of Na+ absorption during intestinal inflammatory conditions such as IBD where high level of TNF-α is detected.
Keywords: Na+/H+ exchanger, Na+-uptake, transcriptional regulation, IBD, inflammation, C2BBe1
INTRODUCTION
Na+/H+ exchangers (NHEs) comprise a family of membrane proteins that catalyze the electroneutral exchange of an extracellular Na+ for an intracellular H+. To date, nine members have been identified in NHE gene family. NHEs play important role in the regulation of intracellular pH, cell volume, and neutral sodium absorption in the human intestine. These proteins display different tissue and subcellular distributions. NHE1, NHE2, NHE3, and NHE8 have been identified and characterized in the human intestinal tract. NHE1 is localized to the basolateral membrane of intestinal epithelial cells and is thought to serve a housekeeping function. NHE2 and NHE3 are localized to the apical membrane and play potentially similar roles in intestinal Na+ absorption with differential activities in various segments of the GI tract. NHE3 is predominantly expressed in the ileum while NHE2 is prevalent in the colon. Na+/H+ exchange system is present along the gut and represents the predominant Na+ absorptive mechanism in the ileum and proximal colon (for review see).1, 2
The human NHE2 gene is located on chromosome 2q11.2 and is composed of 12 exons and 11 introns. The promoter that governs the NHE2 gene expression is highly GC-rich, lacks both TATA and CCAAT boxes and contains multiple Sp1 sites.3 Recently, we have reported that Sp1 and Sp3 transcription factors are involved in the basal transcriptional regulation of the human NHE2 gene.4 We have also shown that the stimulatory effect of phorbol 12-myristate 13-acetate (PMA) on the NHE2 expression is mediated through an overlapping Egr-1/Sp1 binding site in C2BBe1 cells.5 NHE2 promoter also contains other potential transcription factor binding sites that may be involved in stimuli-induced modulation of NHE2 expression, including AP2 (activator protein 2), Oct1 (ocatmer binding protein 1), Cdx-1 and Cdx-2 (caudal homeodomain proteins) and NF-κB (nuclear factor κB).
NF-κB/Rel protein family consists of five members that include p50 and p65. These proteins form homo- and hetero-dimers, of which p50/p65 heterodimers are the predominant NF-κB complexes in most cells. In the absence of stimuli, inactive NF-κB is sequestered in the cytoplasm through interaction with inhibitory protein I-κB. Signals activating NF-κB, phosphorylate IκB;6 as a consequence it is ubiquitinated and degraded by proteasome freeing NF-κB to translocate to the nucleus where it drives the expression of target genes.7 Activation of NF-κB by external stimuli such as proinflammatory cytokines, infectious agents and oxidative stress plays a critical role in regulating the expression of a wide variety of genes linked to cell proliferation, cell survival, immune response and inflammation.8, 9
High levels of proinflammatory cytokines, such as interferon-γ (IFN-γ), tumor necrosis factor-α (TNF-α), interleukin-1 beta (IL-1β) and interleukin-6 (IL-6) are present in the gut of IBD patients.10 These cytokines are involved in the pathogenesis of chronic intestinal inflammation causing diarrhea due to intestinal barrier dysfunction and electrolyte malabsorption. The importance of TNF-α and IFN-γ in modulation of NHE3 transport activity and expression has been reported.11–13
In the current study, we have investigated the molecular mechanisms regulating the effects of TNF-α on the expression and activity of the human NHE2 in the intestinal epithelial cell line, C2BBe1. We demonstrated that TNF-α represses the NHE2 promoter activity, mRNA and protein levels. Similar repressive effect of TNF-α was also observed on the transport activities of NHE2 and NHE3. Further, we showed that the repressive effect of TNF-α is mediated through activation and DNA-binding activity of transcription factor NF-κB. Our findings, for the first time, established that NHE2 is a target of transcription factor NF-κB and demonstrate a functional association between proinflammatory cytokine TNF-α and Na+/H+ exchanger isoform, NHE2.
MATERIALS AND METHODS
Reagents and Antibodies
Tissue culture reagents including Dulbecco’s Modified Eagle’s Medium (DMEM), fetal bovine serum (FBS), and LipoFectamine™2000 obtained from Invitrogen life Technologies Inc., (Carlsbad, CA). Transferrin, G418, actinomycin D, and actin antibody (# A2066) were purchased from Sigma-Aldrich Inc., (St. Louis, MO). Gel shift assay core system, NF-κB consensus oligonucleotide, GoTag®gPCR Master Mix and rhTNF-α were from Promega (Madison, WI). HOE-694 was kindly provided by Dr. Jurgen Punter (Aventis, Frankfurt, Germany). The following antibodies were obtained from Santa Cruz Biotechnology, Inc. (Santa Cruz, CA): anti-NF-κB P65 (# sc-8008 and sc-7151X), anti-NF-κB P50 (#sc-8414 and sc-7178X), anti-αTubulin (# sc-5286) and anti-NHE2 (# sc-22928); or Cell Signaling Technology Inc. (Danvers, MA): anti-I-κBα (# 9242). NF-κB inhibitors, Caffeic Acid Phenethyl Ester (CAPE) and Lactacystin (LC) were obtained from Calbiochem (San Diego, CA) and BioMol International (Plymouth Meeting, PA), respectively.
Construction of Promoter-Reporter Plasmids
All wild-type and mutant NHE2 promoter-luciferase reporter constructs used in this study were generated based on the previously described NHE2 promoter construct, p−1051/+150.4 To generate p−890/+150, the NHE2 promoter sequences between −890 and +150 were removed from p−1051/+150 as a BstyI-HindIII fragment and cloned in pGL2-Basic digested with restriction enzymes BglII and HindIII. BstyI cuts the NHE2 promoter at bp −890 and HindIII is within the polylinker of pGl2-Basic, which is located immediately downstream from position +150. Some of the plasmids containing 5′-deletions in the NHE2 promoter were generated by polymerase chain reaction (PCR) using p−890/+150 as a template. The NHE2 proximal promoter region is highly GC-rich and as such interferes with accurate PCR amplification; therefore to overcome this problem we constructed these plasmids in two steps. First, the intended 5′-truncated fragments were amplified using the same reverse primer spanning bp −117 to −96 of the NHE2 promoter (5′-CCCGAGCCCGCGGGGAACGCGG-3′) and differing forward primers as follows: (bp −761, 5′-AGCACTCGAGACATGTACACCTCTAAGCCTAAAAGC-3′); (bp −680, 5′-AGCACTCGAGGCAGCGACAGTGTAGCAAATGGG-3′); (bp −541, AGCACTCGAGATAACTCGGAAAGGAAACAAA-3′); (bp −470, 5′-AGCACTCGAGTCTTGGCCTCCGCAGCGCCAGGC-3′). The numbers in the parenthesis represent the 5′-end of NHE2 promoter with respect to the NHE2 transcription initiation site. A XhoI restriction enzyme recognition site (shown in boldface letters) was introduced to the 5′-end of the forward primers for cloning purposes. Next, the PCR amplicons were digested with XhoI and ApaI, gel purified, and inserted in p−890/+150 that was cut with the same enzymes. ApaI cuts the NHE2 promoter at bp −118. With this cloning strategy, we replaced the promoter sequences upstream from the ApaI site in p−890/+150 with consecutively truncated fragments. To generate p−415/+150, nucleotide sequences between bp −890 to −415 were deleted from p−890/+150 by SmaI digestion and ligated using T4 DNA ligase. p−270/+150, and p−117/+150, were generated by digesting p−890/+150 with AatII, or ApaI, respectively, ends were blunted by T4 DNA polymerase and then digested again with SmaI (upstream from bp −890, within the polylinker of pGL2-Basic) and ligated using T4 DNA ligase. Site-specific mutations in the NF-κB binding site of NHE2 promoter construct p−890/+150, were generated using Quick-Change XL Site-directed Mutagenesis kit from Stratagene (La Jolla, CA), as described previously.5 NF-κB expression vectors, pRSV-RelA (p65) and pRSV-NF-κB1 (p50), were provided by Drs. G. Nabel and N. Perkins and have been described.14 pGL4−890/+150-neo was generated by sub-cloning XhoI-HindIII fragment from p−890/+150 into similarly digested pGL4.17[luc2-neo] (Promega).
Cell Culture, Transfections and Reporter Assays
C2BBe1 cells, obtained from the American Type Culture Collection (Manassas, VA) and maintained in culture as previously described.3 This cell line is a sub-clone derived from a heterogeneous population of the Caco-2 cells and has been shown to undergo spontaneous differentiation as determined by the appearance of domes the characteristics of micovilli and the presence of the markers of differentiation.15 Cells were used between the passage numbers 5 to 20 and seeded at 5×10⁴ cells/cm2 onto collagen coated plates; at this density cells reach confluency 3–4 days post-plating. Transient transfection in differentiated C2BBe1 cells is not as efficient as the proliferating cells. Therefore, proliferating cells were used for these studies. RT-PCR analyses were done in both proliferating cells (to recapitulate transient transfection conditions) and differentiated cells (data not shown) with similar results. Before TNF-α treatments, C2BBe1 cells were incubated in serum reduced media (0.5% FBS) overnight. Cells were treated with TNF-α at a concentration of 10 ng/ml for 24 h, unless otherwise indicated. Transient transfection studies were performed using LipoFectamine™2000 (Invitrogen) as previously described.13 Transfected cells were incubated for 4 h with the DNA/transfection mixture then cells were placed in serum-reduced media overnight followed by TNF-α treatment. Forty-eight hours post-transfection, cells were harvested and luciferase activity was determined as described previously.13 All transfection studies were performed in triplicates and repeated at least three times. In experiments involving treatment with inhibitors, cells were exposed to the inhibitors for 1 h prior to addition of TNF-α and subsequently treated with TNF-α for 24 h. After incubation cells were collected and processed for luciferase assays as described above. Stable transfections were performed by using the Nucleofector™ (Amaxa Biosystems) apparatus for electroporation and plasmid DNA pGL4−890/+150-neo or pGL4.17[luc2-neo] according to the manufacturer’s instructions. Briefly, C2BBe1 cells were harvested at 80–90% cell confluence; 2×10⁶ cells were centrifuged at 90×g for 5 min. at 4 °C, resuspended in 200 μl of Cell Line Nucleofector Solution T (Amaxa), and mixed with 5μg of plasmid DNA. Cells were electroporated using program B-24. After incubation of DNA-cell mixture for 5 min at 37 °C cells were incubated in complete C2BBe1 media in 100 mm collagen coated culture plates. Twenty-four hours post-plating, cells were incubated in complete media containing 800 μg/ml G418 and selection continued for two weeks at which point resistant colonies were pooled and expanded for further studies. To investigate the combined effects of TNF-α and EGF, stably transfected C2BBe1 cells were seeded onto collagen coated transwell plates and incubated in complete media containing G418 (500 units/ml) for 12 days. Before treatments, cells were incubated in serum-reduced media overnight and then treated with TNF-α in the presence and/or absence of EGF (100 ng/ml) from the basolateral sides of transwell plates for 24h. Subsequently, cells were collected and luciferase activities were determined.
RNA extraction, Semi-quantitative RT-PCR and Quantitative Real-Time RT-PCR (QRT-PCR)
For RT- PCR studies proliferating C2BBe1 (~95% confluent) were serum starved in DMEM containing 0.5% FBS overnight and treated with TNF-α. Total RNA isolation, cDNA synthesis, and semi-quantitative RT-PCR were performed as previously described.13 The following gene-specific primers were used for PCR amplifications: for NHE2, forward primer 5′-ACTATTCGACCACTGGTGGAG-3′ and reverse primer 5′-ACTTATCATCCCAGTCTCTGCC-3′; for GAPDH, forward primer 5′-ATGGCACCGTCAAGGCTGAGG-3′ and reverse primer 5′-GGCATGGACTGTGGTCATGAG-3′. For quantitative real-time RT-PCR (QRT-PCR), total RNA was extracted using RNeasy Mini Kit (Qiagen, Valencia, CA) and cDNA was synthesized using AffinityScript Multiple Temperature Reverse Transcriptase Kit (Stratagene). NHE2 and GAPDH were amplified using gene-specific primers indicated above and GoTag®gPCR Master Mix or Brilliant SYBR Green QPCR Master Mix in MX3000P (Stratagene). The level of gene expression was quantified as a ratio of 2ΔCt(NHE2)/2ΔCt(GAPDH), where ΔCt(NHE2) and ΔCt(GAPDH) represent the differences between the threshold cycle (Ct) values of the TNF-α treated and untreated RNA samples for NHE2 and GAPDH, respectively.
Western Blot Analysis
To detect NHE2 protein expression, C2BBe1 cells were seeded at a density of 2×10⁵ cells/Transwell of 12-well plates. Twelve days post-plating cells were serum starved and exposed to TNF-α from the basolateral side for 6 or 16 h. Cells were washed with cold 1x PBS and lysed in RIPA buffer (Sigma) containing protease inhibitor cocktail. Protein contents were determined using the Bradford Protein Assay kit (Bio-Rad Laboratories, Hercules, CA) with BSA as the standard. Fifty-μg whole cell lysate from each sample was fractionated by 8% sodium dodecyl sulfate-polyacrylamide gel electrophoresis (SDS-PAGE) and transferred to polyvinylidene difluoride (PVDF) membrane and then probed with a goat polyclonal NHE2 antibody 16 (Santa Cruz, Biotech # sc-22928) as previously described.13 IκB-α and NF-κB subunits, p50 and p65, were detected in cytoplasmic or nuclear extracts, respectively, from TNF-α treated cells using antibodies specific for each protein. The complexes were detected using peroxidase-linked secondary antibodies and enhanced Chemiluminescence system (ECL plus, Amersham Pharmacia Biotech, Chicago, IL). As loading control, the blots were re-probed for actin or tubulin using mouse monoclonal antibodies.
Gel Mobility Shift Assay (GMSA), Supershift Analysis and Chromatin Immunoprecipitation Assay (ChIP)
GMSAs were performed as described previously.17 All oligonucleotides were synthesized by Invitrogen life Technologies. Double-stranded probes were end-labeled with T4-polynucleotide kinase and [γ-32P] ATP (Amersham, Arlington Heights, IL). In competition assays, 100-fold excess unlabelled probes were added to the reaction for 10 minutes before adding the labeled probe. For supershift analysis, anti-p50 and anti-p65 antibodies were incubated with the binding reaction mixtures for an additional 30 minutes at room temperature before electrophoresis on a 5% native polyacrylamide gel in 0.25X TBE running buffer. Gels were dried and visualized by autoradiography.
Chromatin immunoprecipitation assays were performed using ChIP-IT kit (ACTIVE MOTIF, Carlsbad, CA) with minor modifications. Briefly, prior to formaldehyde cross-linking cells were treated with TNF-α as noted above, formaldehyde (1%) cross-linked for 10 min, and then formaldehyde was quenched by the addition of glycine to a final concentration of 0.125 M. After washing, cells were collected, suspended in lysis buffer, homogenized by a dounce homogenizer, and nuclei were pelleted by centrifugation. The resulting chromatin was subjected to enzymatic shearing to generate fragments of ~0.4 to 1 kb and centrifuged to remove cell debris. The supernatant was pre-cleared with protein G beads and aliquots were removed for immunoprecipitation of cross-linked chromatin using specific antibodies to p50 and p65. Immunoprecipitated material was washed and DNA-protein cross-links were reversed by incubating samples for 4 h at 65°C. Recovered material was treated with proteinase K, and co-precipitated DNA was purified by mini-columns. Semi-quantitative PCR analyses were performed with the use of NHE2 promoter-specific primers (forward primer, 5′-GAGAAAAGTGGCAGCGACAGTGTAGC-3′ and reverse primer, 5′-GAGAGTTATCAACTCGCGCACAAGG-3′). DNA collected after enzymatic shearing (Input DNA) was used as a control for PCR amplifications.
22Na-uptake Assay
C2BBe1 cells were seeded on Transwell inserts (Costar, Corning, NY) at a density of 5×10⁴ cells/Transwell of 24-well plates and Na+/H+ exchange activity was determined 14 days post-plating. For 22Na+-uptake studies, after overnight incubation in serum-reduced media, cells were exposed to TNF-α (10 ng/ml) from the basolateral side for 6 h. The cells were washed with 1xPBS and acidified by incubation in Na+-free acid load solution consisting of (in mM) 50 NH4Cl, 70 choline chloride, 5 KCl, 1 MgCl2, 2 CaCl2, 5 glucose, and 15 MOPS (pH 7.0) at room temperature for 30 minutes. The cells were then subjected to two rapid washes with a solution containing 120 mM choline chloride and 15 mM Tris-HEPES (pH 7.5). The wash solution was removed and replaced with uptake buffer containing (in mM) 10 NaCl, 110 choline chloride, 1 MgCl2, 2 CaCl2, and 20 HEPES (pH 7.4) and 1 μCi/ml of 22Na (New England Nuclear Life Science Products, Boston, MA), with or without 50 μM ethylisopropylamiloride (EIPA) or HOE-694 (NHE2-specific inhibitor at 50 μM). After 7 min, the 22Na-containing uptake solution was aspirated and the cells were washed twice rapidly with ice-cold PBS. The filters were cut from the Transwell and cells were solubilized by incubation with 0.5 N NaOH for at least 4 hours. The protein content of cell lysates was determined by the Bradford assay and incorporated radioactivity was determined with a PACKARD Liquid Scintillation Analyzer. The NHE-specific 22Na+-uptake was determined as EIPA-sensitive 22Na-uptake by subtracting the EIPA-inhibited values from uninhibited values and expressed as nmol/mg protein/7 min. NHE2 activity was defined as NHE activity sensitive to 50 μM HOE-694 and NHE3 activity was calculated by subtracting 50 μM HOE-694-sensitive NHE activity from total NHE activity (50 μM EIPA-sensitive NHE activity).
Statistical analyses
Difference between two groups was evaluated using Student’s t-test. P < 0.05 was used to indicate statistical significance.
RESULTS
TNF-α Represses the NHE2 Expression by Transcriptional Inhibition
To examine effect of TNF-α on the endogenous NHE2 mRNA expression, C2BBe1 cells were treated with 5-, 10- and 20-ng/ml of TNF-α for 6 h and NHE2 mRNA levels were examined by quantitative real-time RT-PCR. A significant repression of NHE2 mRNA abundance was observed with all TNF-α doses tested compared to the untreated cells (Fig. 1A). Therefore, in all subsequent studies TNF-α at a concentration of 10 ng/ml was utilized, unless otherwise indicated. Further studies showed that repression by TNF-α was time–dependent and maximal reduction was observed 8 h after treatment (Fig. 1B, inset). Scanning densitometric analysis of the results showed a 60% reduction in mRNA levels at 8 h, which differed significantly from the mRNA levels at 4- and 16 h (Fig. 1B). This suggested that TNF-α might affect NHE2 mRNA transcription efficiency, stability or both.
Figure 1. Effect of TNF-α on the expression and transport activity of NHE2 in C2BBe1 cells.
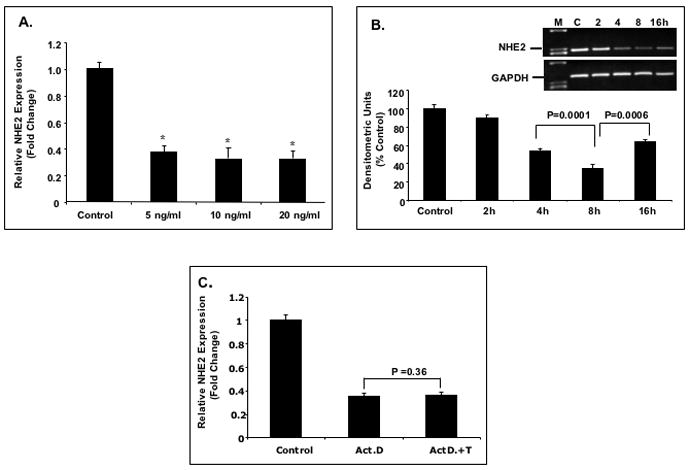
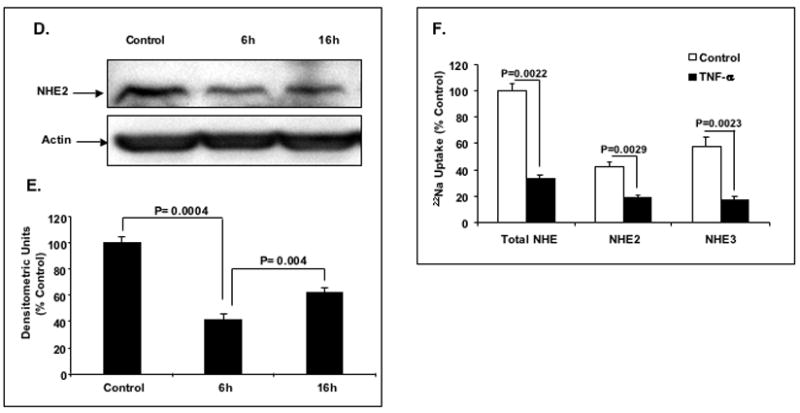
A: Quantitative real-time RT-PCR. Cells were serum-starved in DMEM containing 0.5% FBS for 24 h and treated with different concentrations of TNF-α for 6 h and total RNA was extracted. 5 μg of RNA from each treatment was reverse transcribed to cDNA and equal amounts of cDNA from each sample were subjected to amplification by real-time PCR. The data were normalized to GAPDH as control and changes in NHE2 expression was calculated. The NHE2 mRNA level in untreated cells was considered 100%. Values are means ± SE of three separate experiments performed in triplicates. * P< 0.05 compare to control. B: Time-course of TNF-α effect on the expression of the NHE2 mRNA. C2BBe1 cells were treated with TNF-α (10 ng/ml) for 0, 2, 4, 8, and 16 h and total RNA was extracted subjected to semi-quantitative PCR. The effects of TNF-α on the NHE2 mRNA levels at indicated time intervals were detected by gel electrophoresis (inset) and analyzed by densitometry scanning of the gels. C: Effects of actinomycin D (Act D) and TNF-α on the expression of the NHE2 mRNA in proliferating cells. C2BBe1 Cells were serum-starved in DMEM containing 0.5% FBS for 24 h and then pre-incubated with Act D (5μg/ml) for 30 min. Subsequently, TNF-α (10 ng/ml) was added and incubation continued for 8 h. Five μg of RNA from each treatment was reverse transcribed to cDNA and equal amounts of cDNA from each sample were subjected to amplification by real-time PCR. D: Whole cell lysates prepared from CeBBe1 cells treated with TNF-α for 6 and 16 h were subjected to Western blot analyses using an antibody specific for NHE2. E: Densitometric analysis of NHE2 protein levels is shown. Data are presented as intensity of the NHE2 protein relative to the actin intensity in the corresponding sample. The activity in the control was set at 100. F: TNF-α decreases the Na+/H+ exchange activity of NHE2 and NHE3. NHE activity was determined in the presence of 50 μM EIPA or 50 μM HOE-694 as described in Materials and Methods. Data are presented as percent of the control that is arbitrarily set to 100. Values are means ± SE of three separate experiments performed in triplicates. P values are indicated.
To determine whether TNF-α influences NHE2 mRNA expression at the transcriptional level, C2BBe1 cells were treated with transcriptional inhibitor, actinomycin D (5μg/ml) alone or in the presence of TNF-α. QRT-PCR analysis revealed a 60% reduction in mRNA expression in actinomycin treated cells compared to control (Fig. 1C). Simultaneous treatment with both actinomycin and TNF-α did not generate further decrease in NHE2 mRNA level, indicating that TNF-α impacts NHE2 transcription efficiency rather than mRNA stability. Similar results were obtained for proliferating (Fig. 1C) and differentiating cells (data not shown).
TNF-α Represses the NHE2 protein expression and transport activity
To examine whether the decrease in the NHE2 mRNA level is reflected in NHE2 protein level, cell lysates from TNF-α treated and untreated cells were subjected to Western blot analysis using a NHE2 specific antibody. As shown in Figure 1D, NHE2 protein abundance was significantly decreased in cells treated with the cytokine for 6 and 16 h. Quantification by densitometry scanning (Fig. 1E) showed ~ 50% reduction in NHE2 protein level at 6 h after TNF-α exposure.
To investigate the effect of TNF-α on the NHE2-mediated Na+ absorption, C2BBe1 cells were treated with TNF-α for 6 h and NHE2 activity was determined utilizing differential inhibitions by EIPA and HOE-694. The NHE2-specific activity was determined as NHE activity sensitive to 50 μM HOE-694 and calculated by subtraction of NHE activity in the presence of HOE-694 from the total (50 μM EIPA-inhibitable) NHE activity. NHE3 activity was calculated by subtraction of NHE2-specific activity from the total NHE activity. As shown in Figure 1F, the activities of both NHE2 and NHE3 were decreased ~55% and 70%, respectively in response to TNF-α. Thus, these data demonstrate an association between diminished NHE2 transport activity and reduced protein expression subsequent to TNF-α exposure.
TNF-α Down-regulates the NHE2 Promoter Activity
To investigate the mechanism of TNF-α regulation on NHE2 expression, we tested its impact on the C2BBe1 cells transiently transfected with NHE2 promoter constructs p−1051/+150 and p−415/+150. As shown in Figure 2A, TNF-α treatment resulted in a significant reduction in the reporter gene activity driven by the full-length NHE2 promoter construct, whereas, plasmid p−415/+150, which contains a truncation of promoter sequences upstream from bp −415 (with respect to the transcription initiation site) showed only a minor repression in response to TNF-α treatment (Fig. 2A). These data suggested that TNF-α impacts transcriptional activity of the NHE2 gene and that cis-element(s) responsible for this effect is present upstream from bp −415.
Figure 2. Functional analysis of the NHE2 promoter in C2BBe1 cells and identification of TNF-α-responsive region.
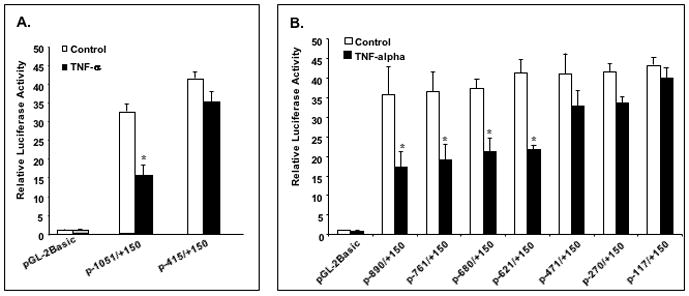
A: NHE2 promoter activity is decreased in response to TNF-α. C2BBe1 cells were transiently transfected with the NHE2 promoter-luciferase constructs p−1051/+150 and p−415/+150 followed by incubation without or with TNF-α for 24 h. Luciferase activity was determined as described in Materials and Methods and is presented relative to the normalized activity of the promoter-less pGL2-basic construct. B: Identification of TNF-α responsive region. A series of the 5′-deletion NHE2 promoter reporter constructs were transiently transfected in C2BBe1 cells, treated with or without TNF-α and processed as described above. Values shown are means ± S.E. from three separate experiments performed in triplicates. Significant differences from the control values are shown (*, P < 0.05).
To identify the exact TNF-α-responsive element(s) within the human NHE2 promoter, we generated a series of 5′-deletion constructs in p−1051/+150 plasmid. The functional importance of the deleted sequences was examined by transient transfection in C2BBe1 cells in the presence or absence of TNF-α. As shown in Figure 2B, constructs containing sequences up to bp −621 were still responsive to TNF-α, whereas deletion of the sequences from −621 to −471 abolished the repressive effect of TNF-α. Further deletions up to bp −117 did not show TNF-α response. These data narrowed down the location of the TNF-α response element(s) to sequences between bp −621 to −471. Within this region, we have previously identified a number of potential transcription factor binding sites including, PEA3, Cdx-2, and NF-κB.3
Exposure to TNF-α results in degradation of IκB-α and Activation of p50 and p65 Proteins in C2BBe1
Previous reports have shown that one of the major signaling pathways used by TNF-α to impact gene expression is that of transcription factor NF-κB.18 The nucleotide sequence of the putative NF-κB binding site of the NHE2 promoter (bp −578 to −568, 5′-GGGAGTTTCC-3′) conforms very well to the canonical NF-κB consensus sequence, 5′-GGG A/G NN T/C T/C CC-3′. Therefore, we focused on this motif to examine the ability of TNF-α to regulate the NHE2 expression. To investigate the effects of TNF-α on the IκB-α and NF-κB subunits in C2BBe1 cells, Western blot experiments were performed with cytoplasmic and nuclear extracts prepared from cells treated with TNF-α for various time intervals. As shown in Figure 3A, the abundance of IκB-α protein in the cytoplasmic fraction was diminished after TNF-α treatment in a time-dependent manner, whereby the nuclear contents of both p50 and p65 proteins were enhanced (Fig. 3B). These data are consistent with the degradation of IκB by TNF-α and subsequent activation and translocation of NF-κB subunits to the nucleus. Tubulin and actin expression are shown as a loading controls.
Figure 3. The effects of TNF-α on the IκB-α, p50 and p65 proteins in C2BBe1 cells.
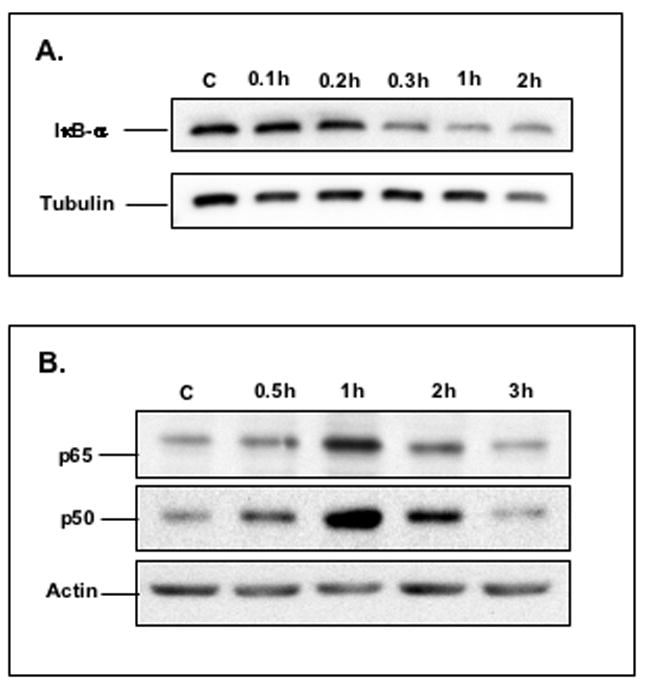
Cytoplasmic and nuclear proteins were prepared from untreated cells or cells treated with TNF-α for indicated time intervals. Twenty μg protein per sample was subjected to 10% SDS-PAGE and transferred onto PVDF membrane. IκB-α in cytoplasmic fraction (Figure A), and p50 and p65 in nuclear fraction (Figure B) were detected using anti-IκB-α, or anti-p50 and anti-65 antibodies, respectively. As a loading control, the blots were re-probed for tubulin or actin using mouse monoclonal antibodies.
NF-κB subunits p50 and p65 Interact with NF-κB Binding Site of the hNHE2 Promoter
The results of functional analysis of the 5′-deletion constructs (Fig. 2B) suggested that the putative NF-κB motif located at bp −578 to −568, might play a role in NHE2 promoter activity in response to TNF-α. To identify the specific nuclear proteins that may interact with this motif in response to TNF-α, we performed gel mobility shift assays (GMSA) with a double-stranded oligonucleotide spanning bp −578/−568 (NHE2-NF-κB) and nuclear extracts from untreated and TNF-α treated cells (Fig. 4). The data revealed that TNF-α activates formation of two prominent DNA-protein complexes with the NHE2-NF-κB probe (Figure 4B, lane 2). In contrast, no binding activities were observed with untreated nuclear proteins (Fig. 4B, lane 1). The binding specificity of these complexes was examined by competition assays where excess unlabelled probes (Fig. 4A), containing NF-κB consensus sequence or base substitutions in NHE2-NF-κB binding site (M1–M3), and a non-specific oligonucleotide harboring the Sp1 consensus sequence were utilized. Unlabelled NF-κB probe completely competed out DNA-protein complexes (Figure 4B, lane 3) indicating that protein components of these nucleoprotein were NF-κB related, whereas mutant oligonucleotides M1 and M3 were ineffective and M2 only partially removed protein interactions with the wild-type probe (Fig. 4B, lanes 4, 5 and 6, respectively). The non-specific probe also did not affect DNA-protein complex formation (Figure 4B, lane 7). These data showed that both nucleoproteins form specific interactions with the NHE2-NF-κB motif at bp −578/−568 and nucleotide sequences at both the 5′- and 3′-ends of the NF-κB binding site are essential for interactions. To identify the proteins present in these complexes, supershift assays were performed with anti-p50 and anti-p65 antibodies. Both complexes were supershifted with antibodies against p50 (Fig. 4C, lane 3) or p65 (Fig. 4C, lane 4) and a combination of p50/p65 antibodies (Fig. 4C, lane 5), indicating that both p50 and p65 are present in these complexes. Both complexes were competed out with cold NHE2-NF-κB oligonucleotide while cold Sp1 probe was ineffective. A control GMSA was performed to examine binding of nuclear proteins to the oligonucleotide containing the consensus NF-κB sequence. As expected, two TNF-α-induced nucleoproteins similar to complexes formed with the NHE2-NF-κB probe were detected with nuclear proteins from TNF-α treated cells (Fig. 4D, lane 2). These complexes were eliminated by competition with cold NF-κB oligo (Fig. 4D, lane 3) and NHE2-NF-κB probe (data not shown).
Figure 4. TNF-α promotes binding of NF-κB subunits p50 and p65 to the NHE2 promoter region.
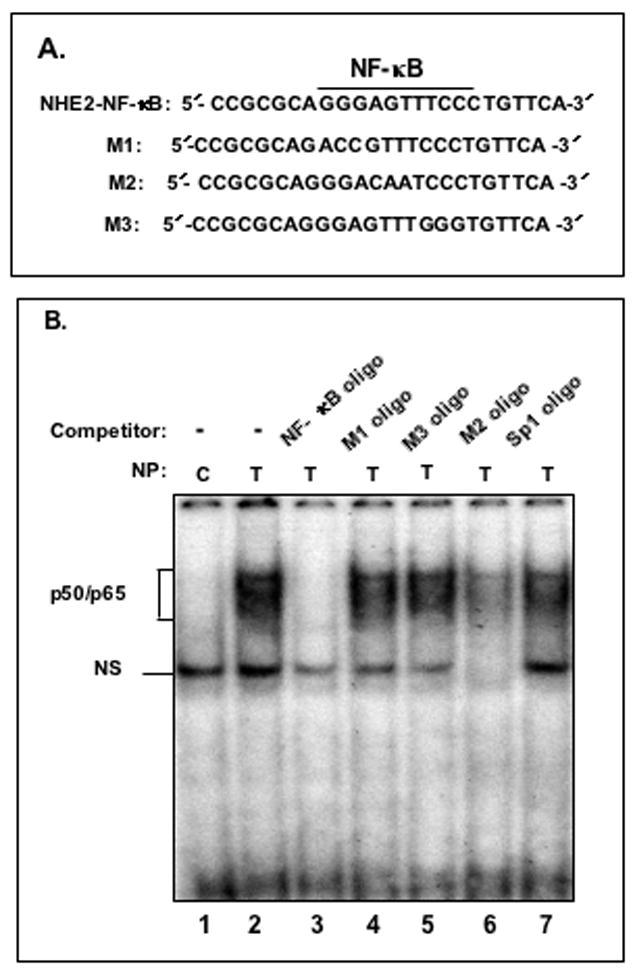
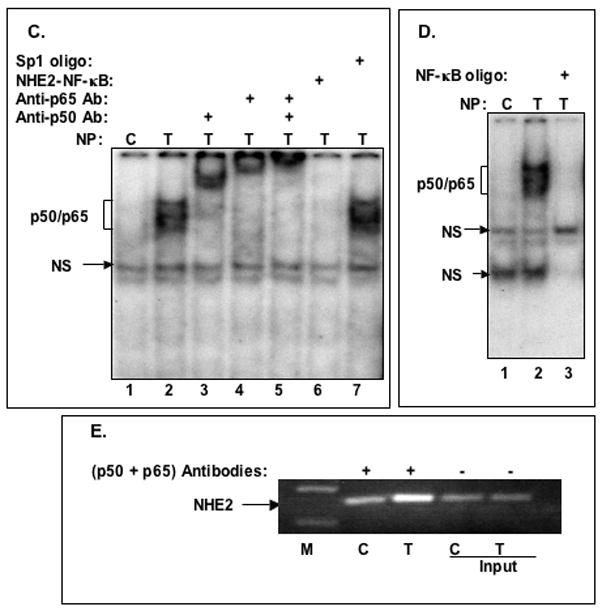
A: Oligonucleotides used in GMSA. B: Binding of nuclear proteins in TNF-α treated cells to 32P-labeled NHE2-NF-κB probe. Nuclear proteins (5 μg) from untreated (lane 1) or TNF-α treated cells (lanes 2–7) were allowed to interact with the probe in the presence of molar excess of cold competitor oligonucleotides NF-κB consensus sequence, M1, M3, M2 and Sp1 consensus sequence (lanes 3–7, respectively). The unlabeled competitor probes were incubated with the nuclear proteins for 10 minutes prior to addition of radiolabeled NHE2-NFκB probe (50,000 cpm). C: p50 and p65 interact with the NHE2 promoter. NF-κB activation by TNF-α was determined in nuclear proteins from untreated (control) and cells treated with TNF-α for 1. The identities of the proteins present in these complexes were established by supershift assays. Incubation of anti-p50 and anti-p65 antibodies individually (lanes 3 and 4, respectively) or simultaneously (lane 5) resulted in the formation of slow migrating supershifted bands (SS), suggesting the presence of both proteins in the DNA-protein complexes. A 100-molar excess of unlabeled NHE2-NF-κB probe and Sp1 oligonucleotide were used in competition assays (lanes 6 and 7). D: GMSA with NF-κB consensus oligonucleotide used as a positive control. E: ChIP Assay. ChIP assay was performed as described in Materials and Methods. Immunoprecipitated DNA was analyzed by PCR using NHE2 promoter-specific primers. To verify that an equivalent amount of chromatin was used in the immuno-precipitations, an input chromatin was amplified with the same primers as control. C and T, indicate the nuclear proteins from control or TNF-α treated C2BBe1 cells, respectively. NS indicates non-specific binding. M, DNA marker.
The results presented above demonstrated that TNF-α induces the activation and DNA-binding of transcription factor NF-κB to the NHE2 promoter. To confirm the in vivo relevance of the in vitro DNA-binding data, we examined the interactions of p50/p65 with the NHE2 promoter region in vivo in C2BBe1 cells. Figure 4E shows the results of a ChIP assay, where chromatin-protein complexes from the control and TNF-α treated cells were immunoprecipitated with p50/p65 antibodies and co-immunoprecipitated NHE2 promoter DNA was amplified by PCR. The in vivo binding of p50 and p65 transcription factors to the NHE2 promoter region increased significantly, as shown by enrichment of co-immunoprecipitated NHE2-specific DNA after treatment with TNF-α compared with untreated cells.
TNF-α-induced Repression of NHE2 requires NF-κB Interaction with the Promoter
To show an association between NF-κB binding to the NHE2 promoter and TNF-α-induced reduction in NHE2 promoter activity, we introduced the nucleotide substitutions of the oligonucleotides M1 and M3 (Fig. 4A) into the NHE2 promoter construct, p−890/+150. Wild type and mutated constructs were transiently transfected into C2BBe1 cells, and reporter gene activity was analyzed. As shown in Figure 5, the basal NHE2 promoter activity was not affected by mutations in p−890/+150M1 and p−890/+150M3. However, in contrast to the wild-type construct, both mutant constructs blocked the negative effect of TNF-α on NHE2 promoter activity. These data show that mutations of NHE2-NF-κB motif that render it incapable of binding to NF-κB, are also incapable of mediating a TNF-α response in transfection assays. Furthermore, these findings demonstrate that while NF-κB binding site does not play a role in basal NHE2 promoter activity, it is absolutely essential for the TNF-α-induced repression of NHE2 expression.
Figure 5. NF-κB site is essential for TNF-α-induced repressor effect on hNHE2 promoter.
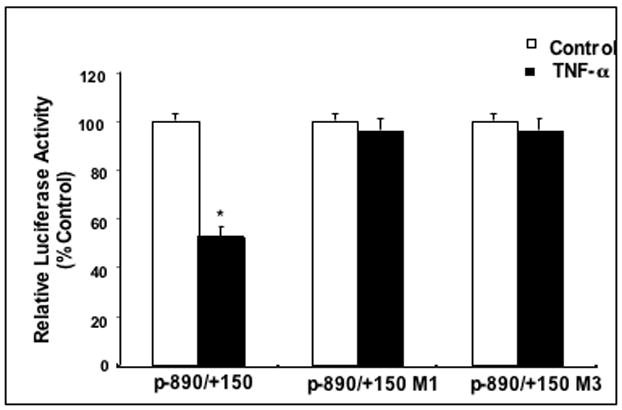
The nucleotide substitutions of the M1 and M2 mutants were introduced into the wild-type NHE2 promoter construct, p−890/+150. Wild-type and mutated constructs were transiently transfected into C2BBe1 cells, and reporter gene activity was measured and analyzed as described in Materials and Methods. The data shown are representative of at least three separate experiments performed in triplicates. *, P < 0.05.
NF-κB is a transcriptional repressor of NHE2
To investigate whether over-expression of NF-κB subunits per se could mimic the effect of TNF-α on the expression of NHE2, C2BBe1 cells were co-transfected with the NHE2 promoter construct p−1051/+150 along with p50 and p65 expression vectors. Ectopically expressed p50 and p65 inhibited NHE2 promoter activity by ~40% and 60% individually and by 65% simultaneously (Fig. 6A). Interestingly, TNF-α treatment did not show a significant repressive effect on the cells over-expressing p50/p65 when compared with untreated transfected cells (Figure 6B).
Figure 6. Overexpression of p50 and p65 attenuate NHE2 promoter activity in C2BBe1 cells.
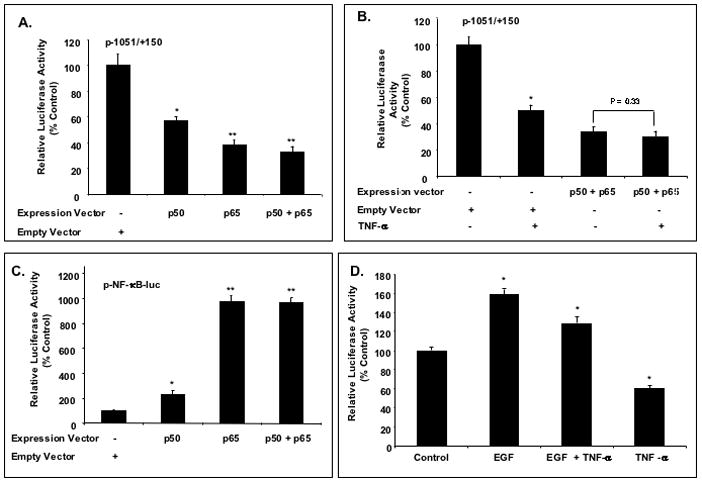
A: Proliferating C2BBe1 cells were co-transfected with p50 and p65 expression vectors (0.5 μg) individually or simultaneously along with p−1051/+150 NHE2 promoter reporter construct and treated with TNF-α. Overexpression of p50 and p65 inhibited the NHE2 promoter activity ~ 40% and 60% individually and ~ 65% in combination. B: Effect of TNF-α on NHE2 promoter activity in cells over-expressing p50 and p65. C: p50 and p65 stimulate p-NF-κB-luc reporter activity. C2BBe1 cells were co-transfected with p50 and p65 expression vectors individually or simultaneously along with p-NF-κB-luc construct. D: TNF-α and EGF regulate NHE2 promoter activity via discrete pathways. C2BBe1 cells were stably transfected with NHE2 promoter construct, p−890/+150 and then allowed to grown for 12 days before serum starvation and treatment with TNF-α (20 ng/ml), EGF (100 ng/ml) or both. Luciferase activities were determined after 24 h and analyzed in comparison to untreated cells. The data shown are representative of at least three separate experiments performed in triplicates. *, P < 0.05; **, P < 0.001.
To show the specificity of the repressive effects of p50 and p65 on the NHE2 promoter, a commercially available NF-κB reporter construct, pNF-κB-luc, was co-transfected with p50 and p65 individually or combined and reporter activities were determined. The results showed that whereas p50 and p65 repressed the activity of NHE2 promoter (Fig. 6A) they stimulated p-NF-κB-luc activity in C2BBe1 cells (Fig. 6C). These results confirm the specificity of negative effect of NF-κB on the NHE2 promoter activity.
To further analyze the negative effects of TNF-α on NHE2 promoter activity, combined effects of epidermal growth factor (EGF) and TNF-α were examined. EGF is known to enhance NHE2 Na+ absorption, mRNA and promoter activity in the rat intestinal epithelial cells, however the mechanisms involved are unknown.19 C2BBe1 cells were stably transfected with NHE2 promoter construct p−890/+150, and 14 days post-plating the cells were exposed individually or simultaneously to TNF-α and/or EGF (100 ng/ml) and promoter activities were determined. Similar to previous findings19 EGF exposure led to ~ 1.7 fold increase in NHE2 promoter activity; as expected TNF-α treatment resulted in a decrease in NHE2 promoter activity; while their combined effect appeared to be the mean between the two responses (Fig. 6D). Thus, these data suggest that TNF-α and EGF may act to regulate NHE2 promoter activity through discrete pathways.
Inhibition of NF-κB blocks the TNF-α-induced repression of NHE2 promoter
To further substantiate the involvement of NF-κB signaling pathway in the TNF-α induced repression of NHE2 expression, we used specific NF-κB inhibitors in transient transfection studies. C2BBe1 cells were transiently transfected with the p−1051/+150 promoter reporter construct, then treated with TNF-α in the presence and absence of NF-κB inhibitors, caffeic acid phenethyl ester (25 μM) and Lactacystin (5 μM). Cells were incubated with the inhibitors for 1 h prior to addition of TNF-α (24 h). Both CAPE, an inhibitor of IκB phosphorylation, and Lactacystin, a selective inhibitor of proteasome activity (Fig. 7A and B), completely blocked the inhibitory effect of TNF-α on the NHE2 promoter. These inhibitors through different mechanisms act to prevent I-κB degradation and hence inhibit NF-κB activation, therefore, leading to the lack of NHE2 response to TNF-α.
Figure 7. TNF-α-induced repression of NHE2 promoter is mediated via NF-κB signaling pathway.
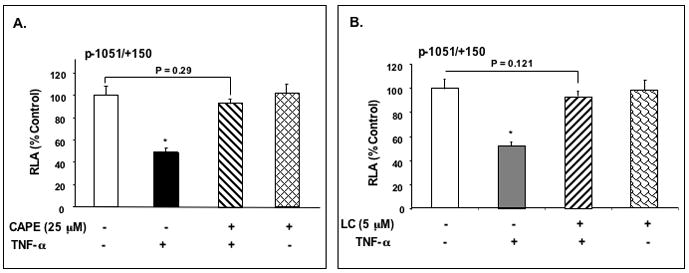
C2BBe1 cells were transiently transfected with the p−1051/+150 NHE2 promoter reporter constructs and serum-starved in DMEM containing 0.5% FBS overnight. Cells were incubated with CAPE (25 μM) (A), and LC (5 μM) (B) for 1 h prior to addition of TNF-α then TNF-α was added and incubation continued for 24 h. 48 h post-transfection, cells were harvested and luciferase and β-galactosidase activities were determined. Data shown are mean± S.E. of least three separate experiments performed in triplicates. *, P <0.05.
DISCUSSION
Cytokines play a critical role in pathogenesis of inflammatory bowel disease (IBD) where their expression is highly elevated. Diarrhea is a prevalent symptom in patients with IBD. Previous investigations have shown a strong reduction in Na+ absorption in the gut of IBD patients.20–22 It is known that alterations in intestinal ion transport processes may result in diarrhea. Na+/H+ exchange coupled with Cl−/HCO3− exchange is the predominant pathway for NaCl absorption in the distal small intestine and proximal colon. Collectively, these data have implicated Na+/H+ exchangers in the pathogenesis of inflammation-associated diarrhea. In agreement with this notion, NHE3 transport activity and expression have been shown to be downregulated by cytokines TNF-α and IFN-γ.11–13 Further, Rocha et al.,12 have shown that in both the rat and C2BBe1 cells the expression and activity of NHE2 is downregulated by IFN-γ. Based on these data we hypothesized that cytokine-mediated regulation of Na+ absorption may involve a modulatory effect on NHE2 expression.
In the present study, we evaluated the effect of TNF-α on the expression and NHE activity of NHE2. We show that proinflammatory cytokine TNF-α represses the NHE2 promoter activity, mRNA, and protein levels as well as its transport activity. Further, we demonstrate that transcriptional repression of NHE2 by TNF-α is achieved through TNF-α-induced activation of transcription factor NF-κB. This signaling pathway has been shown to be responsible for modulation of a variety of TNF-α-responsive genes involved in intestinal inflammation.23, 24
Through functional analyses of a series of 5′-deletion constructs, we localized the TNF-α responsive region to bp −621 to −471 upstream from the NHE2 transcription initiation site. In this region, we have previously identified a putative NF-κB binding site at bp −578 to −568.3 By DNA-binding assays we demonstrated that TNF-α-induced NF-κB subunits, p50 and p65, interact with this motif. TNF-α stimulates nuclear accumulation of both p50 and p65 in a time-dependent manner. Furthermore, the increase in nuclear content of NF-κB subunits was transient, reached a maximum level by 1 h post TNF-α exposure, and diminished there after with low levels persisting up to 16 h. These findings showed that kinetically, the maximal induction of NF-κB protein in response to TNF-α occurs earlier than the repression of NHE2 mRNA, suggesting a link between NF-κB activation and reduction in NHE2 expression.
One of the major signaling pathways used by TNF-α to impact gene expression is that of transcription factor NF-κB.18 NF-κB activation plays an important role in expression of genes involved in inflammation of gastrointestinal tract.25, 26 Our studies showed that disruption of the NHE2-NF-κB motif by targeted base substitution eliminates binding of TNF-α-induced NF-κB to the mutated probes (Fig. 4); and the negative effect of TNF-α on the NHE2 promoter activity is abrogated in reporter constructs carrying these mutations. These data demonstrated that NF-κB specifically binds to the NHE2 promoter at bp −578/−568 and plays a key role in the repression of NHE2 by TNF-α, however, the mechanism of down-regulation of NHE2 transcriptional activity by NF-κB is not clear.
The quintessential biological property of NF-κB has been ascribed to its role as a transcriptional activator. Albeit, a number of studies have shown that NF-κB may also act as a transcriptional repressor.27 As a negative regulator, NF-κB may function as a competitor for binding of a stimulatory factor such as Sp1 to a composite regulatory element, as reported for repression of Bone Morphogenetic Protein-4 or it may impair gene expression via recruitment of repressor proteins such as histone deacetylases.27, 28 Functional interference between Sp1 and NF-κB results in down-regulation of p-selectin gene expression in Hela cells, where p50 homodimers interact with the Sp1 binding site and inhibit Sp1-driven gene expression.29 Transcription factor Egr-1 has also been implicated in mediating the effects of TNF-α on different genes and cell systems.30, 31 TNF-α represses the eNOS expression through a mechanism that depends on activation of NF-κB and down-regulation of Sp1/Sp3 binding to the eNOS promoter.32
Our previous studies showed that transcription factors Sp1/Sp3 through interactions with the cis-elements overlapping the transcription initiation site (TIS) and sequences immediately upstream from TIS regulate basal NHE2 expression.4 Site directed mutation in either site dramatically reduces NHE2 transcriptional activity. Our current findings demonstrated that NF-κB does not interact with the NHE2 promoter at basal conditions and TNF-α-activated NF-κB binds away from the core promoter region (bp −578/−568). This rules out a direct competition between NF-κB and factors binding to the cis-elements in the core promoter region. Albeit, it is possible that through a DNA looping mechanism and protein-protein interactions, DNA-bound NF-κB still be capable of interfering with the function of other transcriptional regulatory factors. NHE2 core promoter region harbors multiple Sp1/Sp3 binding motifs; 4, 5 theoretically, any of these Sp1/Sp3 occupied elements could serve as a site for interaction with the DNA-bound NF-κB. These interactions may result in inhibition of NHE2 transcription by either blocking of the stimulatory effect of Sp1/Sp3 or may result in steric hindrance and interfere with the essential action of Sp1/Sp3 or the basal transcriptional machinery. In this regard, it is perceivable that a protein-protein interaction process involving DNA-bound NF-κB and other regulatory factors bound to the proximal promoter region, may contribute to the negative effect of TNF-α-induced NF-κB on the NHE2 expression. Additionally, interactions between these complexes may result in recruitment of other repressor factors such as histone deacetylases leading to attenuated transcriptional activity as reported previously.28
Our earlier investigations showed that exposure of C2BBe1 cells to a combination of TNF-α/IFN-γ results in down-regulation of the NHE3 promoter activity accompanied by its reduced transcript and protein expression.13 Furthermore, we demonstrated that repression of NHE3 promoter activity was mediated by PKA signaling pathway leading to phosphorylation of Sp1/Sp3 and their reduced interactions with the NHE3 core promoter region.13 In a recent study, the human NHE8 expression was also shown to be inhibited by TNF-α through reduced interaction of Sp3 with the minimal promoter region.33 Whether Sp1 and/or Sp3 are phosphorylated by TNF-α alone and play a role in mediating the repressive effect of TNF-α on the NHE2 expression is not known. However, the lack of response to TNF-α in constructs harboring Sp1 binding sites (p−415/+150, p−270/+150 and p−117/+150) rules out the direct involvement of Sp1/Sp3 in NHE2 repression by TNF-α (Fig. 2B).
In a recent report, Sullivan et al., 200934 demonstrated that although several Na+ absorptive transporters including NHE3 were downregulated in colonic samples from IBD patients compared to controls, the NHE2 protein expression remained unaltered. Our data, however, show a considerable reduction in the NHE2 protein expression in C2BBe1 cells in response to TNF-α. The discrepancies may result from the complexity of the gene regulatory processes in an in vivo system that is subject to integration of a plethora of signaling molecules and protein factors that are derived from not only from the intestinal epithelial cells, but also other cell types. Therefore, an isolated single cytokine treatment in cell culture model after TNF-α exposure may not necessarily recapitulate the outcome of the chronic effects of a multitude of stimuli that are seen in IBD.
In summary, here we present evidence that in C2BBe1 intestinal epithelial cells, TNF-α represses the human NHE2 gene expression and transport activity. The reduced NHE2 expression is mediated by attenuation of transcription through TNF-α-induced NF-κB activation and its interaction with the NHE2 promoter. We showed that the presence of the intact NF-κB binding site in the NHE2 promoter is essential for repression of NHE2 by TNF-α. These findings provide novel insight into the molecular regulation of Na+/H+ exchanger NHE2 in response to proinflammatory cytokine TNF-α; and for the first time implicate NF-κB in the modulation of Na+/H+ exchange in response to TNF-α.
Acknowledgments
This work was supported by NIDDK awards R01-DK33349 (JM), R01-DK54016 (PKD) and P01-DK06887 (KR, PKD, JM). The plasmids pRSV-RelA (p65) and pRSV-NF-κB1 (p50) were obtained through the AIDS Research and Reference Reagent Program, Division of AIDS, NIAID, NIH from Dr. Gary Nabel and Dr. Neil Perkins.
References
- 1.Zachos NC, Tse M, Donowitz M. Molecular physiology of intestinal Na+/H+ exchange. Annu Rev Physiol. 2005;67:411–43. doi: 10.1146/annurev.physiol.67.031103.153004. [DOI] [PubMed] [Google Scholar]
- 2.Kiela PR, Ghishan FK. Ion transport in the intestine. Curr Opin Gastroenterol. 2009;25:87–91. doi: 10.1097/MOG.0b013e3283260900. [DOI] [PMC free article] [PubMed] [Google Scholar]
- 3.Malakooti J, Dahdal RY, Dudeja PK, et al. The human Na(+)/H(+) exchanger NHE2 gene: genomic organization and promoter characterization. Am J Physiol Gastrointest Liver Physiol. 2001;280:G763–73. doi: 10.1152/ajpgi.2001.280.4.G763. [DOI] [PubMed] [Google Scholar]
- 4.Pearse I, Zhu YX, Murray EJ, et al. Sp1 and Sp3 control constitutive expression of the human NHE2 promoter by interactions with the proximal promoter and the transcription initiation site. Biochem J. 2007;407:101–11. doi: 10.1042/BJ20070364. [DOI] [PMC free article] [PubMed] [Google Scholar]
- 5.Malakooti J, Sandoval R, Memark VC, et al. Zinc finger transcription factor Egr-1 is involved in stimulation of NHE2 gene expression by phorbol 12-myristate 13-acetate. Am J Physiol Gastrointest Liver Physiol. 2005;289:G653–63. doi: 10.1152/ajpgi.00010.2005. [DOI] [PubMed] [Google Scholar]
- 6.Brown K, Gerstberger S, Carlson L, et al. Control of I kappa B-alpha proteolysis by site-specific, signal-induced phosphorylation. Science. 1995;267:1485–8. doi: 10.1126/science.7878466. [DOI] [PubMed] [Google Scholar]
- 7.Chen Z, Hagler J, Palombella VJ, et al. Signal-induced site-specific phosphorylation targets I kappa B alpha to the ubiquitin-proteasome pathway. Genes Dev. 1995;9:1586–97. doi: 10.1101/gad.9.13.1586. [DOI] [PubMed] [Google Scholar]
- 8.Baeuerle PA, Baichwal VR. NF-kappa B as a frequent target for immunosuppressive and anti-inflammatory molecules. Adv Immunol. 1997;65:111–37. [PubMed] [Google Scholar]
- 9.Ghosh S, Hayden MS. New regulators of NF-kappaB in inflammation. Nat Rev Immunol. 2008;8:837–48. doi: 10.1038/nri2423. [DOI] [PubMed] [Google Scholar]
- 10.Cominelli F. Cytokine-based therapies for Crohn’s disease--new paradigms. N Engl J Med. 2004;351:2045–8. doi: 10.1056/NEJMp048253. [DOI] [PubMed] [Google Scholar]
- 11.Clayburgh DR, Musch MW, Leitges M, et al. Coordinated epithelial NHE3 inhibition and barrier dysfunction are required for TNF-mediated diarrhea in vivo. J Clin Invest. 2006;116:2682–94. doi: 10.1172/JCI29218. [DOI] [PMC free article] [PubMed] [Google Scholar]
- 12.Rocha F, Musch MW, Lishanskiy L, et al. IFN-gamma downregulates expression of Na(+)/H(+) exchangers NHE2 and NHE3 in rat intestine and human Caco-2/bbe cells. Am J Physiol Cell Physiol. 2001;280:C1224–32. doi: 10.1152/ajpcell.2001.280.5.C1224. [DOI] [PubMed] [Google Scholar]
- 13.Amin MR, Malakooti J, Sandoval R, et al. IFN-gamma and TNF-alpha regulate human NHE3 gene expression by modulating the Sp family transcription factors in human intestinal epithelial cell line C2BBe1. Am J Physiol Cell Physiol. 2006;291:C887–96. doi: 10.1152/ajpcell.00630.2005. [DOI] [PubMed] [Google Scholar]
- 14.Duckett CS, Perkins ND, Kowalik TF, et al. Dimerization of NF-KB2 with RelA(p65) regulates DNA binding, transcriptional activation, and inhibition by an I kappa B-alpha (MAD-3) Mol Cell Biol. 1993;13:1315–22. doi: 10.1128/mcb.13.3.1315. [DOI] [PMC free article] [PubMed] [Google Scholar]
- 15.Peterson MD, Mooseker MS. Characterization of the enterocyte-like brush border cytoskeleton of the C2BBe clones of the human intestinal cell line, Caco-2. J Cell Sci. 1992;102 ( Pt 3):581–600. doi: 10.1242/jcs.102.3.581. [DOI] [PubMed] [Google Scholar]
- 16.Moeser AJ, Nighot PK, Ryan KA, et al. Prostaglandin-mediated inhibition of Na+/H+ exchanger isoform 2 stimulates recovery of barrier function in ischemia-injured intestine. Am J Physiol Gastrointest Liver Physiol. 2006;291:G885–94. doi: 10.1152/ajpgi.00380.2005. [DOI] [PubMed] [Google Scholar]
- 17.Malakooti J, Sandoval R, Amin MR, et al. Transcriptional stimulation of the human NHE3 promoter activity by PMA: PKC independence and involvement of the transcription factor EGR-1. Biochem J. 2006;396:327–36. doi: 10.1042/BJ20051391. [DOI] [PMC free article] [PubMed] [Google Scholar]
- 18.Baud V, Karin M. Signal transduction by tumor necrosis factor and its relatives. Trends Cell Biol. 2001;11:372–7. doi: 10.1016/s0962-8924(01)02064-5. [DOI] [PubMed] [Google Scholar]
- 19.Xu H, Collins JF, Bai L, et al. Epidermal growth factor regulation of rat NHE2 gene expression. Am J Physiol Cell Physiol. 2001;281:C504–13. doi: 10.1152/ajpcell.2001.281.2.C504. [DOI] [PubMed] [Google Scholar]
- 20.Hawker PC, McKay JS, Turnberg LA. Electrolyte transport across colonic mucosa from patients with inflammatory bowel disease. Gastroenterology. 1980;79:508–11. [PubMed] [Google Scholar]
- 21.Rask-Madsen J, Hammersgaard EA, Knudsen E. Rectal electrolyte transport and mucosal permeability in ulcerative colitis and Crohn’s disease. J Lab Clin Med. 1973;81:342–53. [PubMed] [Google Scholar]
- 22.Martinez-Augustin O, Romero-Calvo I, Suarez MD, et al. Molecular bases of impaired water and ion movements in inflammatory bowel diseases. Inflamm Bowel Dis. 2009;15:114–27. doi: 10.1002/ibd.20579. [DOI] [PubMed] [Google Scholar]
- 23.Ruiz PA, Braune A, Holzlwimmer G, et al. Quercetin inhibits TNF-induced NF-kappaB transcription factor recruitment to proinflammatory gene promoters in murine intestinal epithelial cells. J Nutr. 2007;137:1208–15. doi: 10.1093/jn/137.5.1208. [DOI] [PubMed] [Google Scholar]
- 24.Erlejman AG, Jaggers G, Fraga CG, et al. TNFalpha-induced NF-kappaB activation and cell oxidant production are modulated by hexameric procyanidins in Caco-2 cells. Arch Biochem Biophys. 2008;476:186–95. doi: 10.1016/j.abb.2008.01.024. [DOI] [PubMed] [Google Scholar]
- 25.Schmid RM, Adler G, Liptay S. Activation of NFkappaB in inflammatory bowel disease. Gut. 1998;43:587–8. doi: 10.1136/gut.43.4.586c. [DOI] [PMC free article] [PubMed] [Google Scholar]
- 26.Ellis RD, Goodlad JR, Limb GA, et al. Activation of nuclear factor kappa B in Crohn’s disease. Inflamm Res. 1998;47:440–5. doi: 10.1007/s000110050358. [DOI] [PubMed] [Google Scholar]
- 27.Zhu NL, Li C, Huang HH, et al. TNF-alpha represses transcription of human Bone Morphogenetic Protein-4 in lung epithelial cells. Gene. 2007;393:70–80. doi: 10.1016/j.gene.2007.01.016. [DOI] [PMC free article] [PubMed] [Google Scholar]
- 28.Ashburner BP, Westerheide SD, Baldwin AS., Jr The p65 (RelA) subunit of NF-kappaB interacts with the histone deacetylase (HDAC) corepressors HDAC1 and HDAC2 to negatively regulate gene expression. Mol Cell Biol. 2001;21:7065–77. doi: 10.1128/MCB.21.20.7065-7077.2001. [DOI] [PMC free article] [PubMed] [Google Scholar]
- 29.Hirano F, Tanaka H, Hirano Y, et al. Functional interference of Sp1 and NF-kappaB through the same DNA binding site. Mol Cell Biol. 1998;18:1266–74. doi: 10.1128/mcb.18.3.1266. [DOI] [PMC free article] [PubMed] [Google Scholar]
- 30.Kostadinova RM, Nawrocki AR, Frey FJ, et al. Tumor necrosis factor alpha and phorbol 12-myristate-13-acetate down-regulate human 11beta-hydroxysteroid dehydrogenase type 2 through p50/p50 NF-kappaB homodimers and Egr-1. Faseb J. 2005;19:650–2. doi: 10.1096/fj.04-2820fje. [DOI] [PubMed] [Google Scholar]
- 31.Chapman NR, Perkins ND. Inhibition of the RelA(p65) NF-kappaB subunit by Egr-1. J Biol Chem. 2000;275:4719–25. doi: 10.1074/jbc.275.7.4719. [DOI] [PubMed] [Google Scholar]
- 32.Anderson HD, Rahmutula D, Gardner DG. Tumor necrosis factor-alpha inhibits endothelial nitric-oxide synthase gene promoter activity in bovine aortic endothelial cells. J Biol Chem. 2004;279:963–9. doi: 10.1074/jbc.M309552200. [DOI] [PubMed] [Google Scholar]
- 33.Xu H, Chen H, Dong J, et al. Tumor necrosis factor-{alpha} downregulates intestinal NHE8 expression by reducing basal promoter activity. Am J Physiol Cell Physiol. 2009;296:C489–97. doi: 10.1152/ajpcell.00482.2008. [DOI] [PMC free article] [PubMed] [Google Scholar]
- 34.Sullivan S, Alex P, Dassopoulos T, et al. Downregulation of sodium transporters and NHERF proteins in IBD patients and mouse colitis models: potential contributors to IBD-associated diarrhea. Inflamm Bowel Dis. 2009;15:261–74. doi: 10.1002/ibd.20743. [DOI] [PMC free article] [PubMed] [Google Scholar]


