Abstract
Early retinal studies categorized ganglion cell behavior as either linear or nonlinear and rectifying as represented by the familiar X- and Y-type ganglion cells in cat. Nonlinear behavior is in large part a consequence of the rectifying nonlinearities inherent in synaptic transmission. These nonlinear signals underlie many special functions in retinal processing, including motion detection, motion in motion, and local edge detection. But linear behavior is also required for some visual processing tasks. For these tasks, the inherently nonlinear signals are “linearized” by “crossover inhibition.” Linearization utilizes a circuitry whereby nonlinear ON inhibition adds with nonlinear OFF excitation or ON excitation adds with OFF inhibition to generate a more linear postsynaptic voltage response. Crossover inhibition has now been measured in most bipolar, amacrine, and ganglion cells. Functionally crossover inhibition enhances edge detection, allows ganglion cells to recognize luminance-neutral patterns with their receptive fields, permits ganglion cells to distinguish contrast from luminance, and maintains a more constant conductance during the light response. In some cases, crossover extends the operating range of cone-driven OFF ganglion cells into the scotopic levels. Crossover inhibition is also found in neurons of the lateral geniculate nucleus and V1.
Keywords: Retina, Inhibition, Amacrine cells, Visual signals
Introduction
The generation of nonlinearity at synapses
Early retinal studies in cat revealed two main classes of ganglion cell: “X” cells were shown to respond “linearly,” while “Y” cells responded nonlinearly (Hochstein & Shapley, 1976a,b; Jakiela & Enroth-Cugell, 1976; Linsenmeier et al., 1982; Richter & Ullman, 1982; Enroth-Cugell & Robson, 1984; Troy & Enroth-Cugell, 1993). In spike recordings, X cells responded at either the onset or the termination of illumination, but Y cells respond at both ON and OFF. X cells summed illumination across their receptive fields generating a null response to a drifting or inverting grating, but Y cells extracted intensity differences within their receptive fields and so generated activity even in response to a intensity-neutral drifting or inverting grating.
Nonlinearity serves an essential role for many visual functions. For example, directionally selective neurons receive nonlinear inputs that allow them to be motion sensitive (Barlow & Levick, 1965; Euler et al., 2002; Fried et al., 2002, 2005; Lee & Zhou, 2006). The local edge detector also relies on nonlinear inputs at both center and surround if its receptive field (Levick, 1965; van Wyk et al., 2006). Cat Y cells discussed above represent a significant population of nonlinear ganglion cells.
But nonlinearities can also interfere with proper visual processing in some cases. The ability of the retina to enhance edges, to distinguish between luminance and contrast, and to average photon count across the receptive fields of individual retinal neurons is compromised by the nonlinearities. One of the sources of nonlinearity is transmitter release that depends on calcium entry at the synaptic terminals. Release mediated by voltage-gated calcium channels, and the activation of these calcium channels is a nonlinear function of membrane voltage (Katz & Miledi, 1967). As a consequence of this nonlinearity, transmitter release during depolarization is greater than release during hyperpolarization. In graded potential neurons, including many cell types in the retina, this can lead to unacceptable distortions of the postsynaptic response. These distortions occur at every level of retinal processing. However, the nonlinearities are corrected by the special circuitry of crossover inhibition. So whereas a linear retinal response may at first seem the more simple, linearity actually requires additional retinal circuitry to correct for the inherent nonlinearity associated with synaptic transmission.
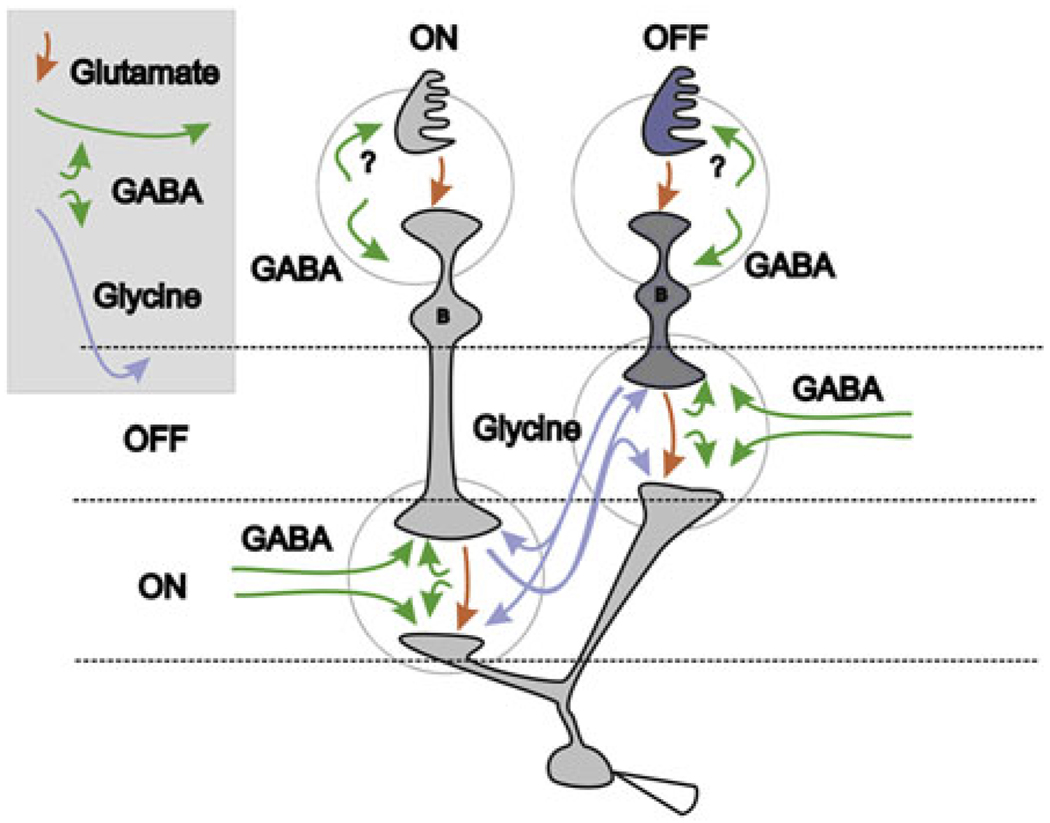
A general summary plan for signal flow through the retina is shown in Fig. 1. Red arrows show the excitatory glutamatergic synaptic pathways from photoreceptors and bipolar cells and from bipolar to ganglion cells. Icons for the inhibitory amacrine cell interneurons are not shown to keep the figure simple, but the pathways for these amacrine-mediated inhibitory signals are represented. Green arrows show pathways for the narrow and wide GABA signals. Included for completeness are the green arrows in the upper part of the figure representing possible GABA feedforward to bipolar cells and feedback to cones via a yet-to-be resolved mechanism. More important here, the blue arrows show the glycinergic pathways that traverse the inner plexiform layer (IPL) vertically, carrying crossover signals between the ON and OFF sublaminae. The blue arrows show glycinergic crossover inhibition to bipolar, amacrine, and ganglion cells. All crossover signals measured have been shown to be glycinergic (Molnar & Werblin, 2007; Hsueh et al., 2008; Manookin et al., 2008; Molnar et al., 2009). Glycinergic amacrine cells have the appropriate morphology for carrying signals between the ON and the OFF sublamina (Menger et al., 1998). They are horizontally narrowly ramifying and vertically diffuse, spanning both the ON and the OFF sublaminae.
Fig. 1.
Crossover inhibition between bipolar, amacrine, and ganglion cells. The blue arrows show the pathways for crossover inhibition acting at bipolar and ganglion cells. ON bipolar, amacrine, and ganglion cells receive glycinergic OFF inhibition and OFF bipolar, amacrine, and ganglion cells receive glycinergic ON inhibition (blue arrows). Narrow field ON and OFF GABAergic amacrine cells (short green arrows) receive glycinergic inhibition. Wide field ON–OFF amacrine cells (long lateral green arrows) receive no inhibition. GABAergic amacrine cells (all green arrows) feedback to bipolar cells and forward to ganglion cells but not to other amacrine cells. Red arrows indicated excitatory pathways. This circuitry is verified by measurements of excitation and pharmacological block of inhibition in each cell type in many previous studies. All crossover signals could interact at the diad at the bipolar terminal as suggested in Fig. 2.
Synaptic circuitry for crossover inhibition is available at the bipolar cell terminal diad
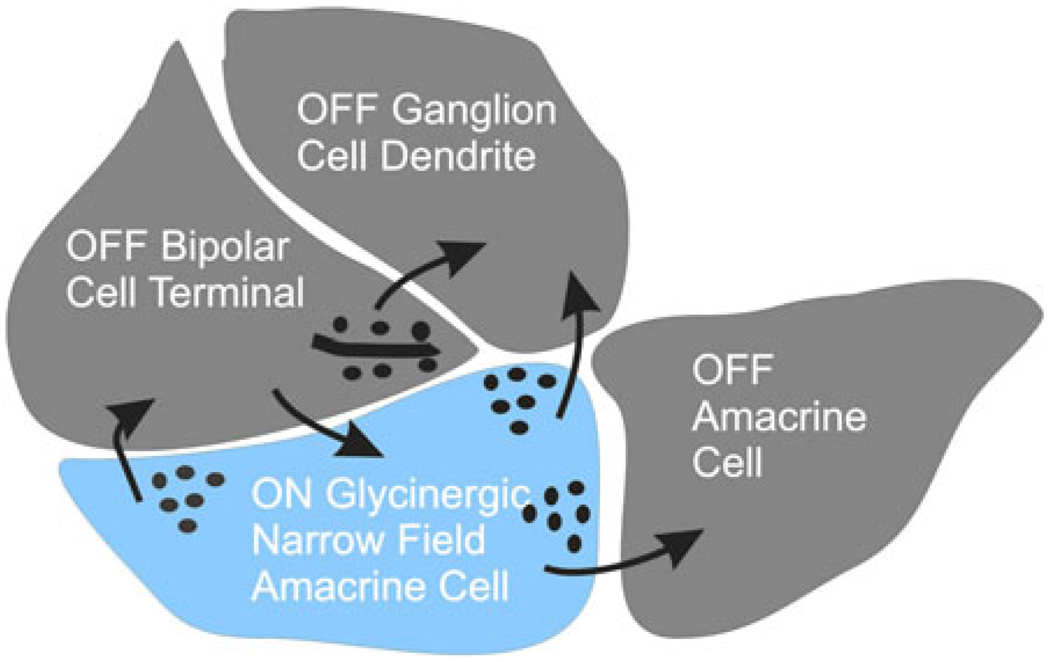
What is the likely microcircuitry responsible for crossover effects in bipolar, amacrine, and ganglion cells? Most of the synaptic contacts necessary for these interactions are found in the complex at the bipolar cell terminal at the “diad” synapse as sketched in Fig. 2. Here, the colored interneuron is the ON glycinergic amacrine cell that provides inhibitory input to bipolar, amacrine, and ganglion cells. This specific circuitry has never been verified, but the synaptic pathways can be inferred from electron microscopic studies (Dowling & Boycott, 1965, 1966; Dowling, 1968, 1970a,b).
Fig. 2.
Summary sketch of electron micrograph of a synaptic terminal of an OFF bipolar cell terminal diad showing the synaptic pathways typically found in these images. OFF bipolar cell drives an OFF ganglion cell and an OFF amacrine cell. An ON amacrine cell (blue), driven by an ON bipolar cell, feeds back to the OFF bipolar cell and forward to the OFF ganglion cell. The amacrine cell also inhibits a neighboring OFF amacrine cell. A complementary set of connections would exist for the ON bipolar cell terminal. This sketch suggests all the connections that would be required for crossover inhibition to bipolar, amacrine, and ganglion cells. It is difficult to fit all of the processes around the bipolar cell ribbon in this two-dimensional representation, but all processes could be included in three dimensions.
Generation of the synaptic nonlinearity
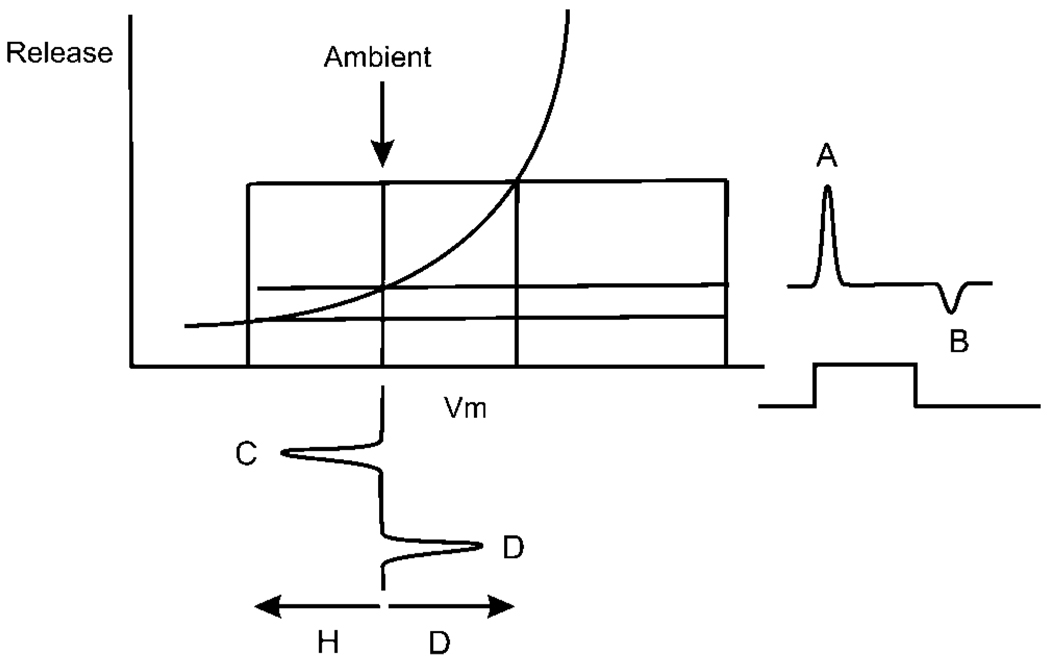
The release/voltage nonlinearity responsible for nonlinear synaptic function is sketched in Fig. 3. The degree of rectification can be measured as the ratio of the transients A to B (Molnar & Werblin, 2007). But how does rectification lead to an asymmetry between the response at ON versus that at OFF? If release simply followed the exponential curve from hyperpolarization (C) to depolarization (D), and back again, the trajectories would be equal and opposite, and no asymmetry would develop. But most retinal light responses originate from a common ambient potential (arrow in Fig. 3) and are transient depolarizations or hyperpolarizations above and below that ambient level. These transients traverse two different slope regions along the transmitter release curve. The slope for depolarization is steeper than that for hyperpolarization. The transient responses, spanning different regions of the exponential-like release trajectory curve, lead to the nonlinear responses recorded in the intracellular studies. In the following discussion, linearity is measured as the ratio of A:B. The signal would be considered linear if A = B.
Fig. 3.
A representation of a typical voltage response as might be measured in an ON depolarizing bipolar cell is shown along the abscissa. At the input, the transient depolarizing and hyperpolarizing response peaks C and D are of similar magnitude. The membrane would typically begin near −40 mV and generate 5–10 mV transients. This voltage response initiates voltage-dependent release A and B generating asymmetrical outward and inward currents in a postsynaptic cell A and B. These current peaks would typically be between 50 and 100 pA.
There is good evidence that transmission from photoreceptors is linear (Thoreson et al., 2004; Heidelberger et al., 2005), but many of the downstream synapses appear to be less linear. One would also expect release from OFF bipolar cells to be more linear than ON bipolar cells, but recordings from bipolar, amacrine, and ganglion cells (Roska & Werblin, 2001; Molnar & Werblin, 2007; Hsueh et al., 2008) show the ON pathway is more linear than the OFF pathway.
Crossover signals and circuitry correct for synaptic rectification
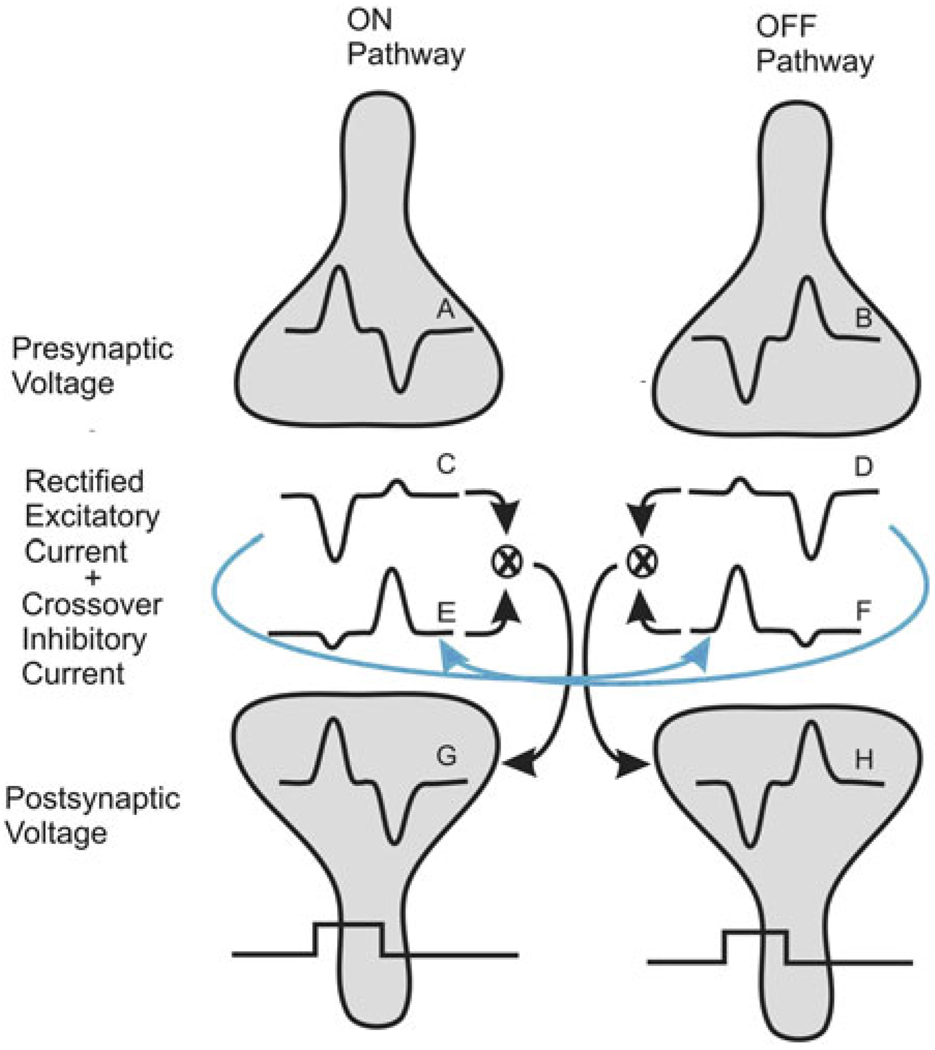
This synaptic nonlinearity shown in Fig. 3 is compensated for at each neuron in the IPL by a repeating circuitry motif illustrated in Fig. 4. This figure summarizes and characterized the signals and circuitry that underlie crossover inhibition based on earlier patch clamp recordings from identified retinal bipolar (Molnar & Werblin, 2007), amacrine (Hsueh et al., 2008), and ganglion cells (Roska & Werblin, 2001; Roska et al., 2006). The relatively linear presynaptic voltage responses to a flashed step of illumination are shown for an ON and an OFF bipolar cell as A and B. These signals, once transmitted synaptically, appear as rectified postsynaptic currents as C and D. The currents are asymmetrical because release is greater during the depolarizing than the hyperpolarizing phase of the presynaptic voltage response in each cell type as shown earlier in Fig. 3. E and F show the inhibitory currents that would be generated in the postsynaptic cells by the glycinergic amacrine cells that mediate crossover inhibition. The rectified ON signal F is inhibitory to the OFF postsynaptic cell, and the rectified OFF signal E is inhibitory to the ON postsynaptic cell. These inhibitory currents E and F are in phase with the excitatory currents C and D in the ON and OFF pathways: when excitatory current is inward, inhibitory current is also inward, and when the excitatory current is outward, the inhibitory current is also outward. The additive combination of the excitatory and inhibitory currents along both the ON and the OFF pathways leads to a voltage response in the postsynaptic cells G and H that is more linear than either of the currents.
Fig. 4.
Compensation for nonlinearities mediated by crossover inhibition. Scheme for signal flow of crossover inhibition at a generalized synapse in the retina. (A and B) Voltage responses in ON and OFF presynaptic cells to a bright step of light. (C) Excitatory currents generated in the postsynaptic ON cells showing rectification where presynaptic depolarization elicits a large inward current, while presynaptic hyperpolarization elicits a smaller outward current. (D) Excitatory currents generated in a postsynaptic OFF cell. (E) Crossover current to an ON postsynaptic cell derived from the OFF pathway carried by an OFF amacrine cell (blue arrow). (F) Crossover current to an OFF postsynaptic cell. (G) Voltage in an ON postsynaptic cell generated by the addition of ON excitation and OFF crossover inhibition. (H) Postsynaptic voltage in an OFF postsynaptic cell generated by OFF excitation and ON crossover inhibition.
This interactive motif, crossover between ON and OFF signal streams illustrated in Fig. 4, is repeated at the inputs to bipolar, amacrine, and ganglion cells and shown to be mediated by glycine (Roska & Werblin, 2001; Roska et al., 2006; Molnar & Werblin, 2007; Hsueh et al., 2008). The most common glycinergic amacrine cells in rabbit are the narrow field diffuse cells that traverse the ON and OFF sublaminae of the IPL as described via immunohistochemistry (Menger et al., 1998; Haverkamp et al., 2003, 2004; Vitanova et al., 2004; Heinze et al., 2007; Weiss et al., 2008). Most of the glycinergic currents we have measured have narrow receptive fields (Hsueh et al., 2008). These are the likely candidates that mediate ON glycinergic amacrine to OFF amacrine and ganglion cells and OFF inhibition to ON cells.
Six different roles for crossover inhibition in the retina
Crossover inhibition provides a variety of enhancements and corrections to the nonlinear rectified visual signals that course through the retina. This section summarizes six different ways in which crossover inhibition corrects for nonlinearities and enhances visual function.
Crossover inhibition converts Y-like responses into X-like responses to an inverting grating
Generation of Y-like nonlinear responses
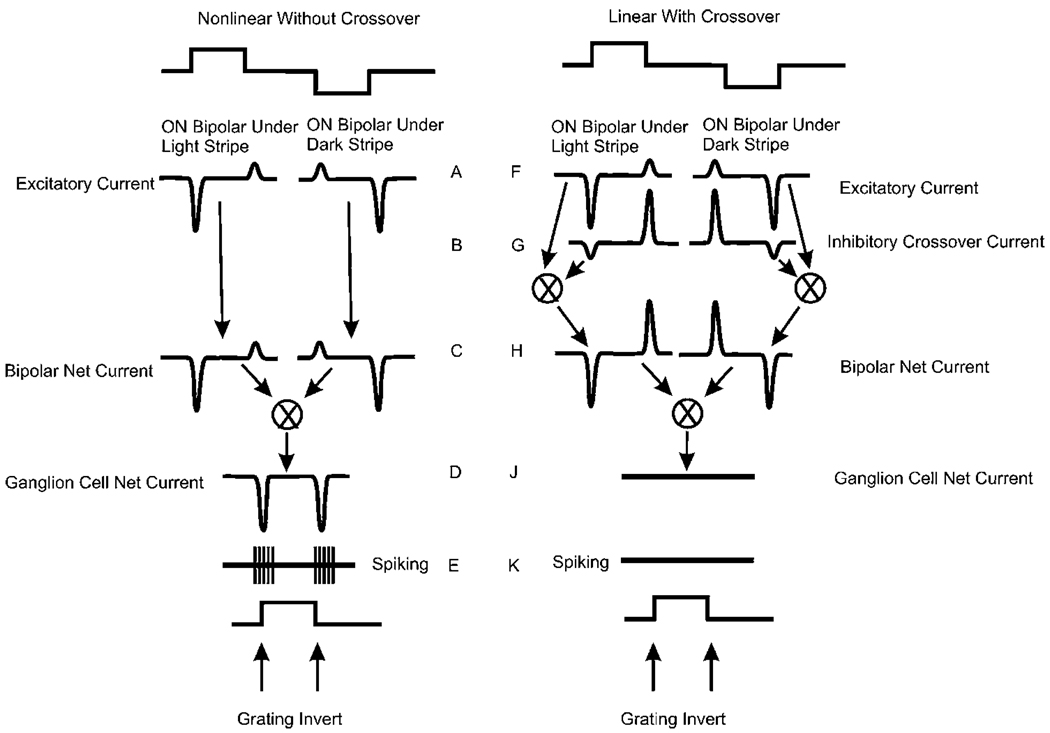
Nonlinear rectifying cat Y cells respond with a transient burst of spikes to each grating inversion (Levick, 1965; Enroth-Cugell & Robson, 1984; Demb et al., 1999). This nonlinear characteristic was identified as rectification (Richter & Ullman, 1982; Enroth-Cugell & Robson, 1984). Ganglion cells that respond to inverting gratings (Hamasaki & Sutija, 1979; Hamasaki et al., 1979; Demb et al., 2001) have been shown to receive nonlinear rectifying excitatory input from bipolar cells similar to the signals shown in Fig. 3 (Roska & Werblin, 2001; Roska et al., 2006). In recent studies of the crossover nonlinearity measuring synaptic currents, evidence of rectification is given by the asymmetric synaptic currents measured in ganglion cells at the onset and termination of the flash as shown in Fig. 4. The left panel in Fig. 5 shows how the nonlinear rectified responses measured intracellularly as asymmetrical currents in ganglion cells could lead to nonlinear spike activity, namely a burst of spikes each time the grating inverts. When the grating inverts, the increase in excitatory currents at the bright stripes is larger than the decrease in excitation at the dark stripes (Fig. 5C). Synaptic input to the ganglion cell from the bright-going and the dark-going stripe regions add (Fig. 5D), so every inversion of the grating elicits net transient excitation and concomitant spiking (Fig. 5E). This response is similar to that found earlier in Y-type cat ganglion cells (Enroth-Cugell & Robson, 1984).
Fig. 5.
Superposition of the excitatory and inhibitory currents in a population of ON ganglion cells leading to null response to inverting grating. Left column: nonlinear responses without crossover. Right column: responses linearized by crossover. The initiation of “dark stripe” activity and “light stripe” activity occurs simultaneously in neighboring spatial regions. The upward and downward steps in the timing graphs at the top of the figure represent the transitions of the contrasting stripes. They overlap in time and are adjacent in space. Here, the left stripe transitions to light, while the right stripe transitions to dark. These two temporally coincident events are shown separately in the figure to illustrate how temporally-simultaneous currents beneath neighboring stripes are integrated by the postsynaptic neuron. Without crossover inhibition, shown in the left panel, the currents at ON and OFF are asymmetrical (C). These two currents add at the ganglion cell membrane. A net inward current is generated at both the onset of the dark transition and the offset of the light transition, leading to a response at each transition of the inverting grating (D). The inward currents at ON and OFF in the nonlinear cells on the left would generate an ON–OFF (E) spiking response characteristic of a Y cell in cat (Richter & Ullman, 1982). With crossover inhibition (right panel), the excitatory currents under each stripe (F) are combined with the inhibitory currents (G) to generate symmetrical currents with each stripe inversion as shown in (H). These currents at (H) are equal and opposite and occur simultaneously, so there is no net current generated in the ganglion cell (J) and no spiking (K).
Generation of X-like linear responses
One of the criteria for linearity in the earlier studies was the null response to luminance-neutral inverting gratings. This is characteristic of cat X cells (Enroth-Cugell & Robson, 1966; Richter & Ullman, 1982; Enroth-Cugell & Freeman, 1987). Despite the local changes in luminance, the overall luminance of an inverting grating remains constant. This condition comes about through two separate current additions as illustrated in the following: The excitatory synaptic inputs from two ON bipolar cells, one beneath the bright-going stripe and the other beneath the dark-going stripe, are shown by the pair of excitatory responses in Fig. 5F. These two excitatory currents would generate a net excitation with each inversion of the grating as shown in Fig. 5D. But with crossover (Fig. 5G), the rectified excitatory current in each stripe (Fig. 5F) is added to an inhibitory current as shown in Fig. 5G. The two currents under each stripe are now symmetrical (Fig. 5H) but equal and opposite. When these two currents are added at the ganglion cell membrane (Fig. 5J), two currents oppose each other, so the postsynaptic voltage response of the cell is not modulated (Fig. 5J) and spiking does not occur (Fig. 5K).
Crossover inhibition converts a passive antagonistic surround at the outer retina into an active antagonistic surround at the inner retina
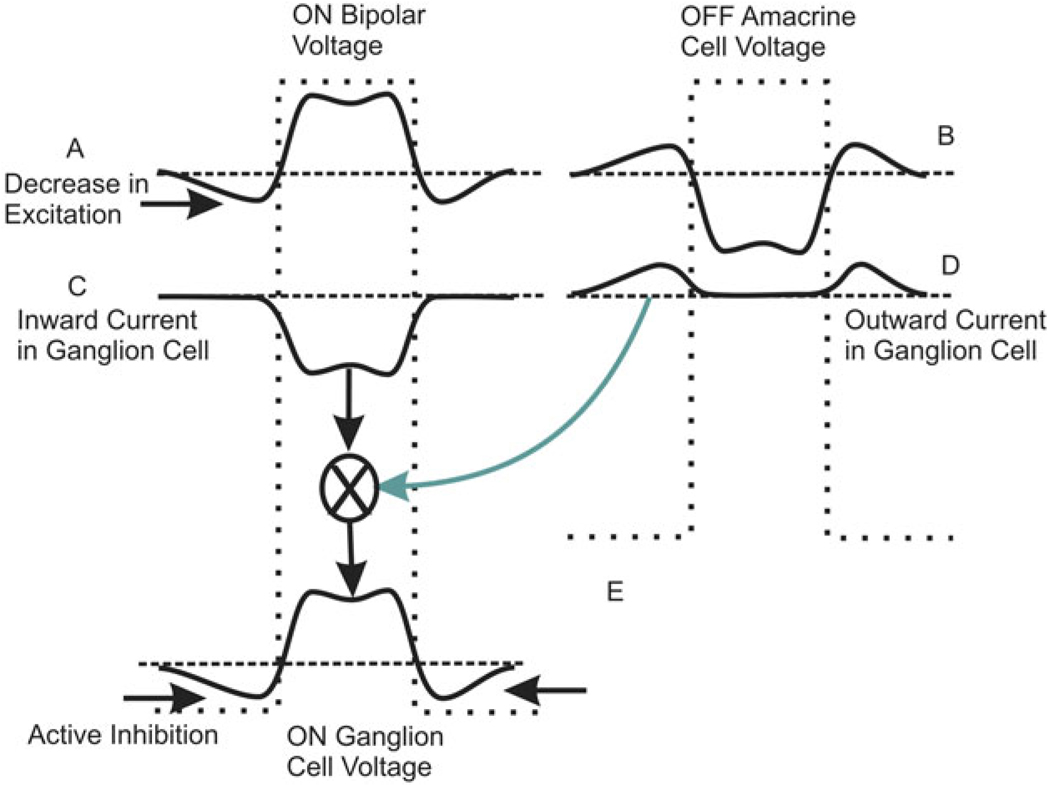
Fig. 6 shows the spatial profile of activity across a population of ON bipolar cells across and outside the region of a flashed light bar. In the region coincident with the bar, the ON bipolar cells are depolarized, and in the regions adjacent to the bar, the bipolar cells are hyperpolarized due to the action of horizontal cells that project their antagonistic activity laterally from the region of the bar (Fig. 6A). ON ganglion cells receive a rectified input from these ON bipolar cells: the ganglion cells receive an inward current in regions beneath the bar, but in regions adjacent to the bar, there is little outward current because rectification has truncated release there (Fig. 6B). The OFF bipolar cells respond to the dark bar in a complementary way: they decrease release in regions beneath the bar but act to depolarize amacrine cells in regions adjacent to the bar. These amacrine cells in adjacent regions actively inhibit ganglion cells adjacent to the bar as shown in Fig. 6C. The excitatory and inhibitory currents add to generate a response profile for the ON ganglion cells (Fig. 6D) that resembles the profile of the ON bipolar cell A more closely than either the excitatory or the inhibitory currents arriving at the ganglion cells B and C. Moreover, what was only a decrease in activity in the surround measured in the bipolar cell is transformed into an active inhibition at the ganglion cell level. In this way, crossover provides an additional active current, increasing the antagonistic effect from the surround.
Fig. 6.
Crossover creates an active antagonistic surround. (A) Original spatial profile of voltage responses for a population of ON bipolar cells in response to a bright stripe. The width of the stripe is shown in the dotted trace. (B) Voltage profile for an array of OFF crossover amacrine cells. (C) Inward current arriving at the ON ganglion cell from the ON bipolar cells. (D) Outward-going currents elicited at the periphery of the light bar. (E) Currents (C) and (D) add to generate an active inhibitory region in the periphery of the light bar in the ON ganglion cells.
Crossover inhibition extends the range of intensities to the scotopic level for cone-driven ganglion cells
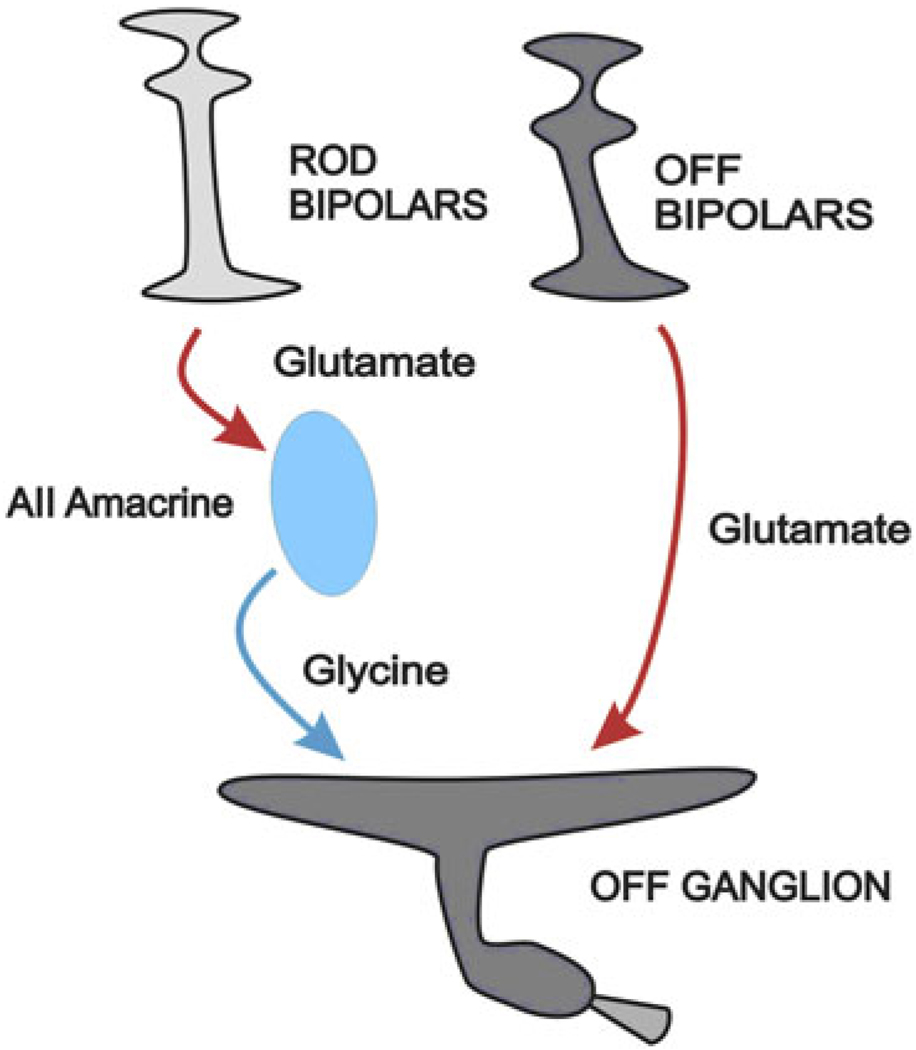
Earlier studies (Pang et al., 2003; Manookin et al., 2008) showed that crossover signals, mediated by AII amacrine cells, add to the synaptic input to extend the sensitivity range of OFF alpha cells. In those studies, it appears that the more sensitive rod signals are conveyed synaptically to the OFF bipolar cells via the AII amacrine cells as shown in Fig. 7. There is also the possibility of similar crossover signals in salamander (Pang et al., 2007).
Fig. 7.
Crossover enhances low light sensitivity via AII amacrine cells. OFF bipolar cells provide excitation to the OFF ganglion cell. Rod bipolar cells excite AII amacrine cells via a conventional glutamate synapse. AII amacrine cells convey crossover ON inhibition to the OFF ganglion cell to extend the range of this otherwise cone-driven response to include scotopic sensitivity. This figure is abstracted from Manookin et al. (2008).
Crossover inhibition reduces the net change in input conductance
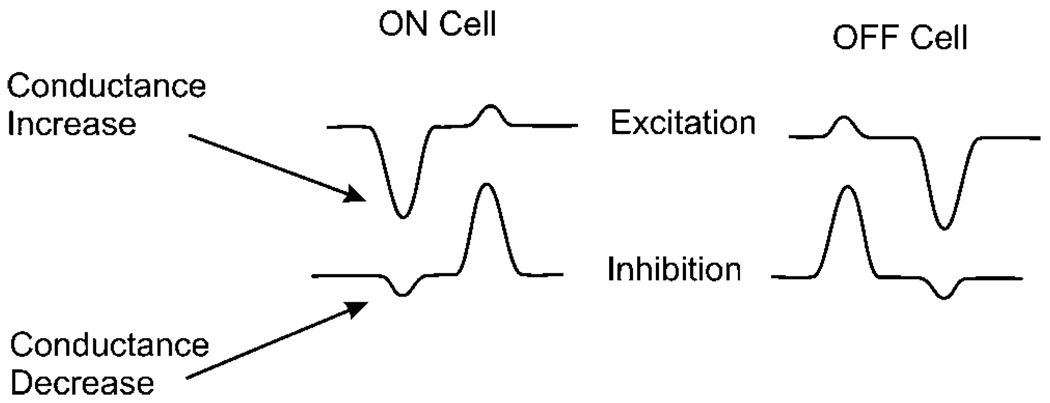
It is evident from Figs. 4 and 5 that excitation and inhibition generate opposing conductance changes. Each increase in conductance from the excitatory input is offset by a decrease in conductance from the inhibitory input as summarized in Fig. 8. The combination of these two opposing conductance inputs tends to reduce the net conductance change in the postsynaptic neuron. This is valuable because other inputs to the neuron will not be modified at different states of excitation or inhibition.
Fig. 8.
Crossover inhibition reduces conductance changes in the postsynaptic neuron. Traces extracted from Fig. 1. In the ON cell at light ON, the inward excitatory current is associated with a conductance increase, but the inward inhibitory current is associated with a conductance decrease. The net change in conductance is less than the increase due to excitation.
As a consequence of these opposing conductance changes, the I–V curve for the total light-elicited conductance will tend to become less steep. If the conductance changes were exactly equal and opposite, there would be no net conductance and the I–V curve would be horizontal, never crossing the voltage axis.
Crossover inhibition can eliminate signal offsets that are common to all neurons
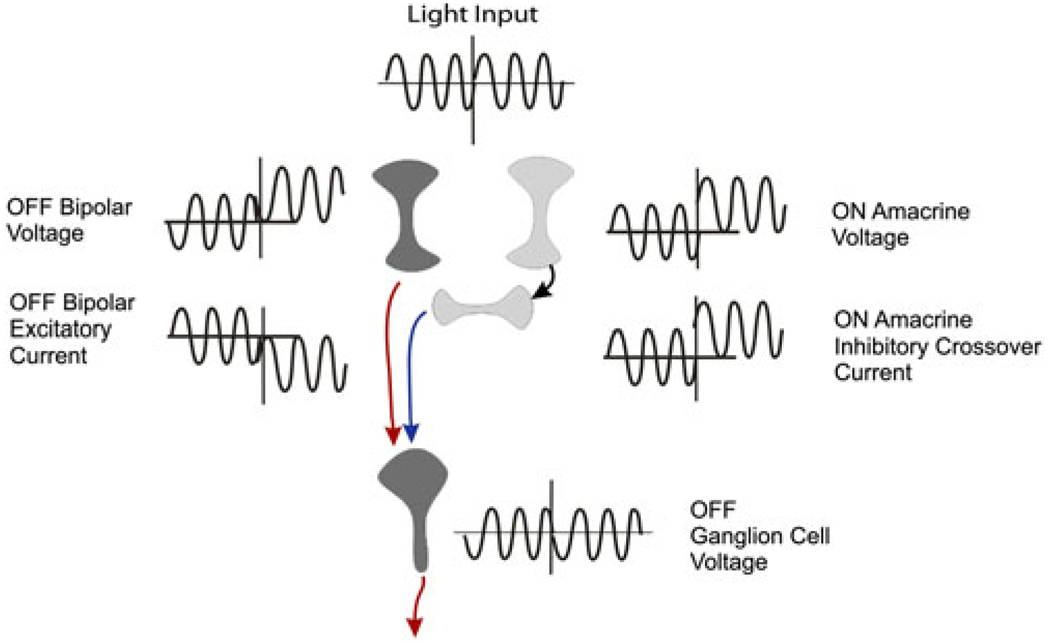
Fig. 9 illustrates how crossover inhibition could compensate for membrane potential offsets that would be common to both excitation and inhibition in the retina. Such offsets could come about because of changes in extracellular potassium concentration or changes in other factors that would offset membrane potential in all neurons. In this example, the input is a sinusoidally modulated illumination. At the midpoint of the traces, all neurons have been subjected to a common depolarization. In the left column, the membrane voltages of the bipolar cell and the amacrine cell become more positive. In the middle column, excitation from the bipolar cell and inhibition from the amacrine cell bring both sinusoidal inputs in phase, but membrane potential current offsets cancel. This leads to a sinusoidal output that is in phase with the original excitatory input but with no sign of the offset. This function is valuable because it decreases distortions to the visual signal due to perturbations within the retina.
Fig. 9.
Crossover corrects for offsets in retinal circuitry. At the midpoint of the traces the voltages of the OFF bipolar and ON amacrine cells become more positive. At the ganglion cell, the bipolar cell current becomes more inward, but the inhibitory current from the ON amacrine cell becomes more outward. The contrast signals are in phase, but the offset currents cancel so that the OFF ganglion cell voltage is unaffected by the offsets in bipolar and amacrine cell voltage.
Crossover inhibition allows the retina to distinguish luminance from contrast
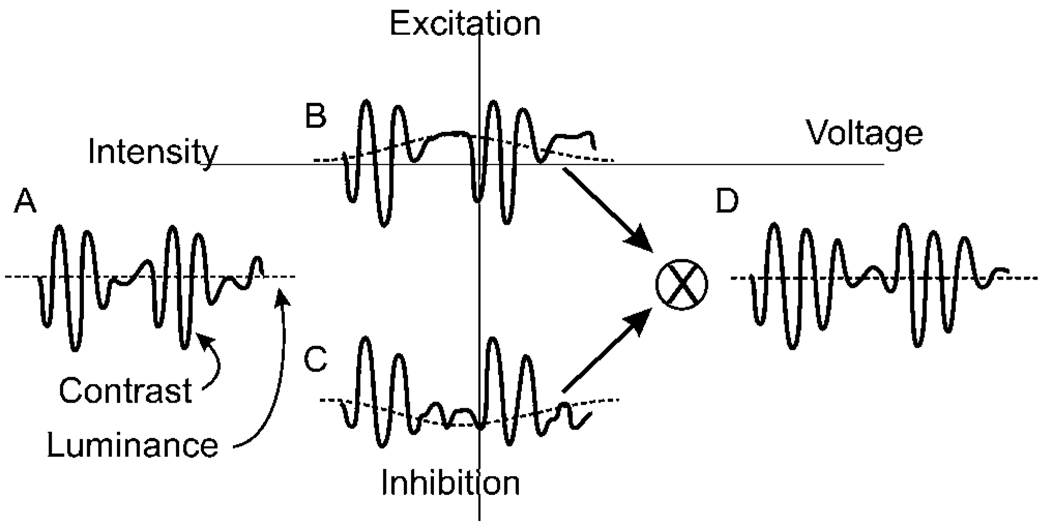
The rectifying nonlinearity can lead to confusion between luminance and contrast. Fig. 10 replicates a measurement that illustrates this point. The signal in Fig. 10A is a voltage trace in a retinal neuron where the retina has been stimulated by a sinusoid that is amplitude modulated by a slower sinusoid. One can consider the faster sinusoid as a contrast signal around a steady luminance represented by the average value of the signal. The postsynaptic excitation shown in Fig. 10B, generated by this neuron, shows an offset of the luminance value caused by synaptic rectification. The postsynaptic inhibition shown in Fig. 10C also shows the offset but in the opposite direction. When excitation and inhibition are combined, the final output voltage resembles more closely the input signal with little luminance offset shown in Fig. 10D. This is valuable for maintaining the difference between contrast and luminance.
Fig. 10.
Crossover inhibition eliminates confusion between contrast and luminance. (A) Fast sinusoidal illumination modulated by a slower frequency sinusoid. (B and C) Rectified currents in postsynaptic ganglion cell. In this case, rectification causes an artifactual shift in the representation of intensity in both the excitatory (B) and the inhibitory (C) currents. The higher frequency components are in phase and additive, but the shift components are out of phase and cancel. (D) Addition of the excitatory and inhibitory currents results in an output voltage in which the high frequency components are preserved, but the artifactual changes in the representation of luminance are suppressed (from Molnar & Werblin, 2007).
Functional implications of crossover inhibition
The role of crossover inhibition in visual processing
Retinal signals are nonlinear because synapses are inherently nonlinear. In many cases, this nonlinearity is desirable. It underlies signaling for motion detection (Barlow & Levick, 1965; Fried et al., 2005; Lee & Zhou, 2006), local edge detection (Levick, 1965; van Wyk et al., 2006), object motion (Baccus et al., 2008), and a variety of other retinal visual function. However, it is also necessary in some cases to process visual signals linearly. Crossover inhibitory circuitry compensates for the nonlinear behavior of synapses, so that linear signal streams can be maintained throughout the visual pathway. This crossover inhibition combines rectified excitatory currents with rectified crossover inhibitory currents to reconstruct a linear nonrectified membrane voltage in ganglion, bipolar, and amacrine cells (Molnar & Werblin, 2007; Hsueh et al., 2008; Molnar et al., 2009).
Crossover inhibition facilitates excitation
The crossover signals are inhibitory in the conventional synaptic sense: they are mediated by glycine and modulate chloride channel conductance (Wassle et al., 1986; Molnar & Werblin, 2007; Hsueh et al., 2008). However, functionally, crossover inhibition, rather than opposing excitation, acts in concert with and serves to augment excitation as illustrated in Fig. 4.
There is a commonality in disinhibition within the vertebrate and limulus retinas, which is a decrease in inhibition. In limulus, this occurs by inhibition of inhibition (Hartline & Ratliff, 1957), while in vertebrates, it is attributable to a decreased excitatory drive of an inhibitory interneuron. In both cases, the net result is decreased inhibition leading to enhanced activity.
In many of the pharmacological studies performed in our lab and others, we find that blocking glycine inhibition can lead to a decrease in excitatory activity in ganglion cells. This has often been misinterpreted as representing a form of disinhibition: The hypothesis is that some glycine pathways block GABA inhibition. So when glycine is blocked, the GABA inhibition fed back to bipolar terminals increases, thereby reducing excitation. Understanding the role of crossover inhibition leads to an alternative hypothesis: Blocking glycine pathways interferes with crossover inhibition to bipolar, amacrine, and ganglion cells and thereby reduces the response of all three cell types. It should be possible to test these hypotheses by measuring the change in magnitude of GABAergic inhibition when glycine pathways are blocked.
Linear neuronal activity is found only in the voltage response of neurons; it is not found in excitatory, inhibitory, or in spiking activity
The voltage response of each postsynaptic cell that receives crossover inhibition is more linear than either its excitation or its inhibition. In this sense, excitation and inhibition are less complete nonlinear representations of the visual message than the more linear membrane voltage. The problem is even more severe in spiking neurons such as the axons of the optic nerve because voltage-to-spiking is often more nonlinear than synaptic release. This reasoning leads to the paradoxical conclusion that the optic nerve fibers and, for that matter, every spiking pathway throughout the central nervous system carry only a partial rectified signal. For linear signal reconstruction, these partial spiking signals carrying excitation and inhibition then converge on each postsynaptic neuron to reestablish linearity in the voltage response of the postsynaptic neuron.
Crossover inhibition must be repeated at every level in the visual system
To maintain linearity, crossover inhibition has to reestablish linearity at every level in the retina. Each synapse introduces rectifying nonlinearity into the visual stream. It can be shown that if the nonlinear signal is subjected to another operation such as high- or low-pass filtering before it is compensated by crossover, linearity is lost and can no longer be reestablished by subsequent crossover inhibition (Molnar et al., 2009).
Each neuron along the pathway to the cortex generates spikes, and spiking is inherently even more nonlinear and rectifying than synaptic transmission. Therefore, the neuronal destination of each spike-generating neuron must itself receive crossover inhibition for lateral geniculate nucleus (LGN) and cortical cells to respond linearly. This process of crossover inhibition appears to be repeated at higher visual centers: similar “push–pull” circuitry has been inferred at the LGN and visual cortex (Anderson et al., 2000; Hirsch, 2003; Lauritzen & Miller, 2003). Crossover inhibition is almost never exactly balanced with excitation. A precise linearity is never found in any of the interactions. It is therefore possible that nonlinearities could accumulate and not be corrected as the visual signal moves centrally.
More crossover is measured in the OFF than the ON pathways
In the rabbit, where each cell type has been studied, almost all OFF bipolar cells and ganglion cells receive ON crossover inhibition. But only about half of the ON bipolar and ganglion cells receive OFF crossover inhibition. Conversely, almost all ON amacrine cells receive OFF crossover inhibition, but only about half of the OFF amacrine cells receive crossover ON inhibition. Taken together, this seems to suggest that crossover is more prevalent in the OFF than the ON system. Nonlinear signals originating in the OFF bipolar and ganglion cells are corrected by ON amacrine cells. These three OFF cell types receive the majority of crossover activity. We have less information from most other animals. But an interaction quite similar to crossover inhibition has been described in guinea pig ganglion cells (Zaghloul et al., 2003). Fig. 7 shows that the OFF alpha cells in guinea pig receive ON AII amacrine crossover as shown by Manookin et al. (2008).
One could measure nonlinearity as the ratio of the ON to OFF transient currents arriving at any of the retinal neurons (Molnar et al., 2009). If this ratio is unity, the signal is “linear.” By this measure, the ON bipolar and ON ganglion cells receive more linear inputs than the corresponding OFF cells (Molnar & Werblin, 2007). In summary, the ON pathways are inherently more linear but receive less crossover compensation. The OFF pathways are inherently less linear but are made more linear than the ON signals because of crossover inhibition. The relative nonlinearities of these pathways probably reflect an asymmetry in ON and OFF inputs in the visual world, but this correspondence is not yet well understood.
It might be expected that transmission from OFF bipolars would be more nonlinear than transmission from ON bipolars because OFF bipolar cells are more depolarized at the ambient level than ON bipolars and therefore their membrane potential lies further within the nonlinear voltage-to-transmission curve in Fig. 1. In fact, we measured more nonlinearity in the OFF pathway than the ON and found more crossover correction to the OFF than the ON pathways of both bipolar and ganglion cells.
Not all forms of push–pull interaction are crossover inhibition
Crossover inhibition can be thought of as a form of push–pull interaction. With crossover, excitation “pushes” by increasing conductance, while inhibition “pulls” by decreasing conductance, yet both currents move the membrane potential. Similar interactions have been described in guinea pig (Manookin et al., 2008), carp (Toyoda et al., 1992), mouse (Pang et al., 2007), and mudpuppy (Belgum et al., 1982; Arkin & Miller, 1988).
But push–pull has meant other things in many other studies. For example, the form of push–pull described earlier by Belgum et al. (1987) showed that illumination of the receptive field surround decreased synaptic input from the center and increased synaptic input from the surround. The push–pull described by Rabl et al. (2002) also involves interaction between center and surround processes. Crossover is also different from the push–pull interaction described by McGuire et al. (1986). They showed that for the ON beta cell, for example, excitation at light ON from the CBb1 and disinhibition from CBb2 and the reverse at light OFF. A similar push–pull interaction between ON and OFF bipolar cells was described by Gaudiano (1994). This is again different from the crossover inhibition that is discussed in this review. The push–pull described by Hirsch (2003) at higher levels of visual processing seems more consistent with retinal crossover: this push–pull involves interactions between excitatory and inhibitory inputs that work co-operatively to enhance the responses of cortical neurons.
References
- Anderson JS, Carandini M, Ferster D. Orientation tuning of input conductance, excitation, and inhibition in cat primary visual cortex. Journal of Neurophysiology. 2000;84:909–926. doi: 10.1152/jn.2000.84.2.909. [DOI] [PubMed] [Google Scholar]
- Arkin MS, Miller RF. Bipolar origin of synaptic inputs to sustained OFF-ganglion cells in the mudpuppy retina. Journal of Neurophysiology. 1988;60:1122–1142. doi: 10.1152/jn.1988.60.3.1122. [DOI] [PubMed] [Google Scholar]
- Baccus SA, Olveczky BP, Manu M, Meister M. A retinal circuit that computes object motion. The Journal of Neuroscience. 2008;28:6807–6817. doi: 10.1523/JNEUROSCI.4206-07.2008. [DOI] [PMC free article] [PubMed] [Google Scholar]
- Barlow HB, Levick WR. The mechanism of directionally selective units in rabbit’s retina. The Journal of Physiology. 1965;178:477–504. doi: 10.1113/jphysiol.1965.sp007638. [DOI] [PMC free article] [PubMed] [Google Scholar]
- Belgum JH, Dvorak DR, McReynolds JS. Light-evoked sustained inhibition in mudpuppy retinal ganglion cells. Vision Research. 1982;22:257–260. doi: 10.1016/0042-6989(82)90125-0. [DOI] [PubMed] [Google Scholar]
- Belgum JH, Dvorak DR, McReynolds JS, Miyachi E. Push-pull effect of surround illumination on excitatory and inhibitory inputs to mudpuppy retinal ganglion cells. The Journal of Physiology. 1987;388:233–243. doi: 10.1113/jphysiol.1987.sp016612. [DOI] [PMC free article] [PubMed] [Google Scholar]
- Demb JB, Haarsma L, Freed MA, Sterling P. Functional circuitry of the retinal ganglion cell’s nonlinear receptive field. The Journal of Neuroscience. 1999;19:9756–9767. doi: 10.1523/JNEUROSCI.19-22-09756.1999. [DOI] [PMC free article] [PubMed] [Google Scholar]
- Demb JB, Zaghloul K, Haarsma L, Sterling P. Bipolar cells contribute to nonlinear spatial summation in the brisk-transient (Y) ganglion cell in mammalian retina. The Journal of Neuroscience. 2001;21:7447–7454. doi: 10.1523/JNEUROSCI.21-19-07447.2001. [DOI] [PMC free article] [PubMed] [Google Scholar]
- Dowling JE. Synaptic organization of the frog retina: An electron microscopic analysis comparing the retinas of frogs and primates. Proceedings of the Royal Society of London B: Biological Sciences. 1968;170:205–228. doi: 10.1098/rspb.1968.0034. [DOI] [PubMed] [Google Scholar]
- Dowling JE. Organization of the vertebrate retina. Nippon Seirigaku Zasshi. Journal of the Physiological Society of Japan. 1970a;32:546–547. [PubMed] [Google Scholar]
- Dowling JE. Organization of vertebrate retinas. Investigative Ophthalmology. 1970b;9:655–680. [PubMed] [Google Scholar]
- Dowling JE, Boycott BB. Neural connections of the retina: Fine structure of the inner plexiform layer. Cold Spring Harbor Symposia on Quantitative Biology. 1965;30:393–402. doi: 10.1101/sqb.1965.030.01.039. [DOI] [PubMed] [Google Scholar]
- Dowling JE, Boycott BB. Organization of the primate retina: Electron microscopy. Proceedings of the Royal Society of London B: Biological Sciences. 1966;166:80–111. doi: 10.1098/rspb.1966.0086. [DOI] [PubMed] [Google Scholar]
- Enroth-Cugell C, Freeman AW. The receptive-field spatial structure of cat retinal Y cells. The Journal of Physiology. 1987;384:49–79. doi: 10.1113/jphysiol.1987.sp016443. [DOI] [PMC free article] [PubMed] [Google Scholar]
- Enroth-Cugell C, Robson JG. The contrast sensitivity of retinal ganglion cells of the cat. The Journal of Physiology. 1966;187:517–552. doi: 10.1113/jphysiol.1966.sp008107. [DOI] [PMC free article] [PubMed] [Google Scholar]
- Enroth-Cugell C, Robson JG. Functional characteristics and diversity of cat retinal ganglion cells. Basic characteristics and quantitative description. Investigative Ophthalmology & Visual Science. 1984;25:250–267. [PubMed] [Google Scholar]
- Euler T, Detwiler PB, Denk W. Directionally selective calcium signals in dendrites of starburst amacrine cells. Nature. 2002;418:845–852. doi: 10.1038/nature00931. [DOI] [PubMed] [Google Scholar]
- Fried SI, Munch TA, Werblin FS. Mechanisms and circuitry underlying directional selectivity in the retina. Nature. 2002;420:411–414. doi: 10.1038/nature01179. [DOI] [PubMed] [Google Scholar]
- Fried SI, Munch TA, Werblin FS. Directional selectivity is formed at multiple levels by laterally offset inhibition in the rabbit retina. Neuron. 2005;46:117–127. doi: 10.1016/j.neuron.2005.02.007. [DOI] [PubMed] [Google Scholar]
- Gaudiano P. Simulations of X and Y retinal ganglion cell behavior with a nonlinear push-pull model of spatiotemporal retinal processing. Vision Research. 1994;34:1767–1784. doi: 10.1016/0042-6989(94)90131-7. [DOI] [PubMed] [Google Scholar]
- Hamasaki DI, Sutija VG. Classification of cat retinal ganglion cells into X- and Y-cells with a contrast reversal stimulus. Experimental Brain Research. 1979;35:25–36. doi: 10.1007/BF00236782. [DOI] [PubMed] [Google Scholar]
- Hamasaki DI, Tasaki K, Suzuki H. Properties of X- and Y-cells in the rabbit retina. The Japanese Journal of Physiology. 1979;29:445–457. doi: 10.2170/jjphysiol.29.445. [DOI] [PubMed] [Google Scholar]
- Hartline HK, Ratliff F. Inhibitory interaction of receptor units in the eye of limulus. The Journal of General Physiology. 1957;40:357–376. doi: 10.1085/jgp.40.3.357. [DOI] [PMC free article] [PubMed] [Google Scholar]
- Haverkamp S, Muller U, Harvey K, Harvey RJ, Betz H, Wassle H. Diversity of glycine receptors in the mouse retina: Localization of the alpha3 subunit. The Journal of Comparative Neurology. 2003;465:524–539. doi: 10.1002/cne.10852. [DOI] [PubMed] [Google Scholar]
- Haverkamp S, Muller U, Zeilhofer HU, Harvey RJ, Wassle H. Diversity of glycine receptors in the mouse retina: Localization of the alpha2 subunit. The Journal of Comparative Neurology. 2004;477:399–411. doi: 10.1002/cne.20267. [DOI] [PubMed] [Google Scholar]
- Heidelberger R, Thoreson WB, Witkovsky P. Synaptic transmission at retinal ribbon synapses. Progress in Retinal and Eye Research. 2005;24:682–720. doi: 10.1016/j.preteyeres.2005.04.002. [DOI] [PMC free article] [PubMed] [Google Scholar]
- Heinze L, Harvey RJ, Haverkamp S, Wassle H. Diversity of glycine receptors in the mouse retina: Localization of the alpha4 subunit. The Journal of Comparative Neurology. 2007;500:693–707. doi: 10.1002/cne.21201. [DOI] [PubMed] [Google Scholar]
- Hirsch JA. Synaptic physiology and receptive field structure in the early visual pathway of the cat. Cerebral Cortex. 2003;13:63–69. doi: 10.1093/cercor/13.1.63. [DOI] [PubMed] [Google Scholar]
- Hochstein S, Shapley RM. Linear and nonlinear spatial subunits in Y cat retinal ganglion cells. The Journal of Physiology. 1976a;262:265–284. doi: 10.1113/jphysiol.1976.sp011595. [DOI] [PMC free article] [PubMed] [Google Scholar]
- Hochstein S, Shapley RM. Quantitative analysis of retinal ganglion cell classifications. The Journal of Physiology. 1976b;262:237–264. doi: 10.1113/jphysiol.1976.sp011594. [DOI] [PMC free article] [PubMed] [Google Scholar]
- Hsueh HA, Molnar A, Werblin FS. Amacrine-to-amacrine cell inhibition in the rabbit retina. Journal of Neurophysiology. 2008;100:2077–2088. doi: 10.1152/jn.90417.2008. [DOI] [PubMed] [Google Scholar]
- Jakiela HG, Enroth-Cugell C. Adaptation and dynamics in X-cells and Y-cells of the cat retina. Experimental Brain Research. 1976;24:335–342. doi: 10.1007/BF00235001. [DOI] [PubMed] [Google Scholar]
- Katz B, Miledi R. A study of synaptic transmission in the absence of nerve impulses. The Journal of Physiology. 1967;192:407–436. doi: 10.1113/jphysiol.1967.sp008307. [DOI] [PMC free article] [PubMed] [Google Scholar]
- Lauritzen TZ, Miller KD. Different roles for simple-cell and complex-cell inhibition in V1. The Journal of Neuroscience. 2003;23:10201–10213. doi: 10.1523/JNEUROSCI.23-32-10201.2003. [DOI] [PMC free article] [PubMed] [Google Scholar]
- Lee S, Zhou ZJ. The synaptic mechanism of direction selectivity in distal processes of starburst amacrine cells. Neuron. 2006;51:787–799. doi: 10.1016/j.neuron.2006.08.007. [DOI] [PMC free article] [PubMed] [Google Scholar]
- Levick WR. Receptive fields of rabbit retinal ganglion cells. American Journal of Optometry & Archives of American Academy of Optometry. 1965;42:337–343. doi: 10.1097/00006324-196506000-00003. [DOI] [PubMed] [Google Scholar]
- Linsenmeier RA, Frishman LJ, Jakiela HG, Enroth-Cugell C. Receptive field properties of x and y cells in the cat retina derived from contrast sensitivity measurements. Vision Research. 1982;22:1173–1183. doi: 10.1016/0042-6989(82)90082-7. [DOI] [PubMed] [Google Scholar]
- Manookin MB, Beaudoin DL, Ernst ZR, Flagel LJ, Demb JB. Disinhibition combines with excitation to extend the operating range of the OFF visual pathway in daylight. The Journal of Neuroscience. 2008;28:4136–4150. doi: 10.1523/JNEUROSCI.4274-07.2008. [DOI] [PMC free article] [PubMed] [Google Scholar]
- McGuire BA, Stevens JK, Sterling P. Microcircuitry of beta ganglion cells in cat retina. The Journal of Neuroscience. 1986;6:907–918. doi: 10.1523/JNEUROSCI.06-04-00907.1986. [DOI] [PMC free article] [PubMed] [Google Scholar]
- Menger N, Pow DV, Wassle H. Glycinergic amacrine cells of the rat retina. The Journal of Comparative Neurology. 1998;401:34–46. doi: 10.1002/(sici)1096-9861(19981109)401:1<34::aid-cne3>3.0.co;2-p. [DOI] [PubMed] [Google Scholar]
- Molnar A, Hsueh HA, Roska B, Werblin FS. Crossover inhibition in the retina: Circuitry that compensates for nonlinear rectifying synaptic transmission. Journal of Computational Neuroscience. 2009;27:569–590. doi: 10.1007/s10827-009-0170-6. [DOI] [PMC free article] [PubMed] [Google Scholar]
- Molnar A, Werblin F. Inhibitory feedback shapes bipolar cell responses in the rabbit retina. Journal of Neurophysiology. 2007;98:3423–3435. doi: 10.1152/jn.00838.2007. [DOI] [PubMed] [Google Scholar]
- Pang JJ, Gao F, Wu SM. Light-evoked excitatory and inhibitory synaptic inputs to ON and OFF alpha ganglion cells in the mouse retina. The Journal of Neuroscience. 2003;23:6063–6073. doi: 10.1523/JNEUROSCI.23-14-06063.2003. [DOI] [PMC free article] [PubMed] [Google Scholar]
- Pang JJ, Gao F, Wu SM. Cross-talk between ON and OFF channels in the salamander retina: Indirect bipolar cell inputs to ON-OFF ganglion cells. Vision Research. 2007;47:384–392. doi: 10.1016/j.visres.2006.09.021. [DOI] [PubMed] [Google Scholar]
- Rabl K, Banvolgyi T, Gabriel R. Electrophysiological evidence for push-pull interactions in the inner retina of turtle. Acta Biologica Hungarica. 2002;53:141–151. doi: 10.1556/ABiol.53.2002.1-2.14. [DOI] [PubMed] [Google Scholar]
- Richter J, Ullman S. A model for the temporal organization of X- and Y-type receptive fields in the primate retina. Biological Cybernetics. 1982;43:127–145. doi: 10.1007/BF00336975. [DOI] [PubMed] [Google Scholar]
- Roska B, Molnar A, Werblin FS. Parallel processing in retinal ganglion cells: How integration of space-time patterns of excitation and inhibition form the spiking output. Journal of Neurophysiology. 2006;95:3810–3822. doi: 10.1152/jn.00113.2006. [DOI] [PubMed] [Google Scholar]
- Roska B, Werblin F. Vertical interactions across ten parallel, stacked representations in the mammalian retina. Nature. 2001;410:583–587. doi: 10.1038/35069068. [DOI] [PubMed] [Google Scholar]
- Thoreson WB, Rabl K, Townes-Anderson E, Heidelberger R. A highly Ca2+sensitive pool of vesicles contributes to linearity at the rod photoreceptor ribbon synapse. Neuron. 2004;42:595–605. doi: 10.1016/s0896-6273(04)00254-5. [DOI] [PMC free article] [PubMed] [Google Scholar]
- Toyoda J, Shimbo K, Kondo H, Kujiraoka T. Push-pull modulation of ganglion cell responses of carp retina by amacrine cells. Neuroscience Letters. 1992;142:41–44. doi: 10.1016/0304-3940(92)90615-e. [DOI] [PubMed] [Google Scholar]
- Troy JB, Enroth-Cugell C. X and Y ganglion cells inform the cat’s brain about contrast in the retinal image. Experimental Brain Research. 1993;93:383–390. doi: 10.1007/BF00229354. [DOI] [PubMed] [Google Scholar]
- van Wyk M, Taylor WR, Vaney DI. Local edge detectors: A substrate for fine spatial vision at low temporal frequencies in rabbit retina. The Journal of Neuroscience. 2006;26:13250–13263. doi: 10.1523/JNEUROSCI.1991-06.2006. [DOI] [PMC free article] [PubMed] [Google Scholar]
- Vitanova L, Haverkamp S, Wassle H. Immunocytochemical localization of glycine and glycine receptors in the retina of the frog Rana ridibunda. Cell and Tissue Research. 2004;317:227–235. doi: 10.1007/s00441-004-0914-6. [DOI] [PubMed] [Google Scholar]
- Wassle H, Schafer-Trenkler I, Voigt T. Analysis of a glycinergic inhibitory pathway in the cat retina. The Journal of Neuroscience. 1986;6:594–604. doi: 10.1523/JNEUROSCI.06-02-00594.1986. [DOI] [PMC free article] [PubMed] [Google Scholar]
- Weiss J, O’Sullivan GA, Heinze L, Chen HX, Betz H, Wassle H. Glycinergic input of small-field amacrine cells in the retinas of wildtype and glycine receptor deficient mice. Molecular and Cellular Neurosciences. 2008;37:40–55. doi: 10.1016/j.mcn.2007.08.012. [DOI] [PubMed] [Google Scholar]
- Zaghloul KA, Boahen K, Demb JB. Different circuits for ON and OFF retinal ganglion cells cause different contrast sensitivities. The Journal of Neuroscience. 2003;23:2645–2654. doi: 10.1523/JNEUROSCI.23-07-02645.2003. [DOI] [PMC free article] [PubMed] [Google Scholar]


